MARKETING COSTS IN ALTERNATIVE MARKETING CHANNELS Shermain Hardesty


- Slides: 41
MARKETING COSTS IN ALTERNATIVE MARKETING CHANNELS Shermain Hardesty & Penny Leff University of California Small Farm Program
OVERVIEW n n Growth in Direct Marketing Objective & Approach n n n detailed review of marketing related expenses Application to YOUR farm Comparing Profitability in Alternative Channels
Growth In Direct Marketing n Direct agricultural marketing, particularly farmers’ markets, has grown in popularity n n n Farms engaged in direct marketing increased from 86, 432 in 1992 to 110, 639 in 1997 and 116, 733 in 2002 Revenues rose from $404. 1 million in 1992 to $812. 2 million in 2002 Promoted extensively by small farm programs n n n Farmers markets CSAs Roadside stands
Objective & Approach n n Compare the relative marketing costs and profitability of different marketing channels— farmers’ markets, CSAs and wholesale markets Based on case studies of 3 organic fruit and vegetable producers n n Well established Small, medium & large Northern California Sell through farmers markets, CSA and wholesale
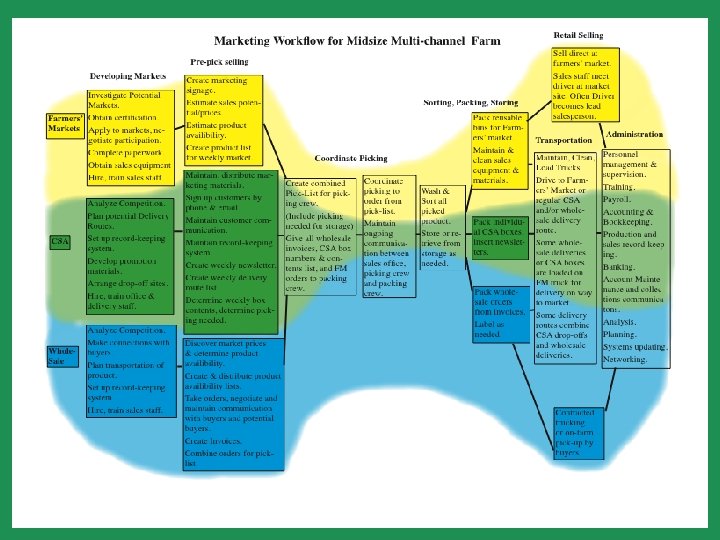
Approach n n n Excluded all costs involved in crop production Developed detailed list of postharvest activities involved in the flow of product from the field to consumers for the different marketing channels Subsequently grouped these activities into 3 categories n n n packing and storage transportation marketing and administration
Sorting & Packing Costs n n n Sort & pack product – facilities & equipment Sort & pack product – labor & materials Load, unload truck – labor Maintain market supplies & equipment – labor Training & supervision - labor
Transportation Costs n n n Delivery vehicle - capital & operating costs Delivery – labor Contracted Trucking Tolls Driver training & delivery management labor
Selling & Administrative Costs n n n Market communications – labor Wholesales – labor Retail sales – labor Marketing materials costs – labor and materials Sales staff administration – labor n n n Office facilities, equipment, supplies, services use Record keeping systems Account maintenance, banking, bookkeeping – labor Other office staff – labor Business planning – labor
Measuring Costs n Chronological sequence of events involved from harvest through sales n n n examined separately for each day of the week for the seasons (winter, summer) and for each market channel elicited estimates of staffing and hours of labor involved for each marketing activity in each market channel type determined what purchased goods and services and capital assets were utilized
Measuring Costs n n Used original purchase values and straight line method to calculate depreciation Valued operator labor at same rates paid to hired labor for same activity
MEASURING MARKETING COSTS FOR YOUR OPERATION
n Combining direct marketing and wholesale selling as a small or mid-size grower usually involves a complicated pattern of shared use of labor, vehicles and facilities by the different marketing channels.
n To determine the profitability of each channel, we need to look closely at this pattern and allocate the costs as accurately as possible. We have prepared a series of worksheets to help put all this information into a useful order.
Worksheet 1 - Asset & Labor Usage Allocating shared costs n n Allocate Packing Facility costs based on hours used by each marketing channel Allocate Transportation Labor costs based on the percentage of vehicle use time for each marketing channel. Allocate Office Facility costs based on the hours the office is used by each marketing channel. Allocate Transportation Vehicle costs based on the percentage of vehicle miles driven for each marketing channel
Very Important note: Because owners and family members usually do many marketing tasks on a small farm, payroll records are not sufficient for allocating costs. When computing the hours and miles for the different marketing activities, be sure to include time spent by the farm owners and family members, even if they are not paid a wage, in order to get an accurate picture of the labor cost of each channel.
Worksheet 1 - Allocating Packing Facility Costs n n Start with a normal workweek in Summer List each task in packing facility, starting with washing or cleaning produce and ending with loading delivery vehicles n Determine how many people-hours each task takes for product destined for each marketing channel, estimating where needed Include owner & family labor hours Add up usual weekly labor hours for each channel for Summer work pattern n Total should equal 100% of weekly Summer packing facility labor hours, including cleaning & maintenance
Worksheet 1 - Allocating Packing Facility Costs n n Repeat the process for Winter or other seasonal weekly work pattern Multiply by number of weeks for each pattern Add seasonal totals to determine total annual packing facility hours for each marketing channel Divide annual hours for each channel by total annual hours for all channels to determine percentage use of packing facility by each channel. This is the basis for allocating costs.
Worksheet 1 - Allocating Transportation Labor Costs n Using first a normal Summer weekly work pattern, then a normal Winter weekly work pattern, list all delivery vehicle usage hours, broken down by marketing channel n n Assign hours that vehicle is parked at a farmers’ market as farmers’ market hours for this purpose For combined loads, assign hours based on the percent value of product going to each marketing channel Determine total annual delivery vehicle hours for each marketing channel, making sure that combined total equals 100% of delivery hours Divide total hours for each channel by combined total to determine percentage use for each channel. This is the basis for allocating transportation labor costs.
Worksheet 1 - Allocating Facility Costs, Sales & Admin Office n n List the people who work in the office, including owners & family members List total hours in office for each person Break total hours down for each person, listing hours spent on tasks for each marketing channel, and also hours for non-marketing office tasks such as production payroll & planning Determine percent of office labor hours used for each marketing channel. Total will be less than 100% of all office labor hours if office is used also for production administration.
Worksheet 1 - Allocating Transportation Asset & Operations Costs n Starting with weekly delivery vehicle use patterns, compute annual miles delivery vehicles are used for each marketing channel, and then percent of total combined mileage for each channel, using methods used above. n n n Mileage for each portion of a mixed load delivery route can be estimated by allocation to each segment the proportion of the total miles for the route that is the same as the proportion of value of product delivered, or the proportion of space used in the vehicle. If delivery vehicles are also used for personal use or production, note the percent of use for delivery. If different vehicles have significantly different operating costs, use Worksheet 2 as a guide.
Worksheet 3 - Labor Cost n n List the wage rate for each worker in a category, such as “driver” or “packer” or “market sales” Look up or estimate the number of overtime hours in the year. Use this information to figure out the actual average hourly wage for each category Add employer tax, workers’ comp, health & other benefit costs per hour to determine average hourly cost for each labor category
Worksheet 3 - Labor Cost n n Figure average legal wage rate for all categories of work, including any work customarily paid in cash and work often done by owners & family members. Note that the owner’s work is valued at the rate per hour that is the same as the average legal labor cost of a worker doing the same work.
Worksheet 4 - Allocations of Asset & Operations Costs n n Now we will add up the actual costs to be allocated to each channel First, the transportation operations costs n n n List all delivery vehicle operating costs If vehicles are used for both business and personal use, or for production activities, list only the portion of costs that approximate the portion of marketing use of the vehicles. Add all the costs listed.
Worksheet 4 - Allocations of Asset & Operations Costs n When computing packing and delivery labor cost, use the total numbers of hours computed in worksheet 1 n n Multiply the total number of hours by the average labor cost for each category of worker Be sure to include owner and family labor hours Selling labor costs will be added later for each marketing channel Sum listed costs and other costs as needed, to determine total shared costs to be allocated
Worksheet 5 - Channel Specific Costs n n n Costs that can be clearly connected to a specific marketing channel Selling labor costs are all directly charged to the channel where the sales occur For selling labor costs for the farmers’ market channel, add the total number of hours of selling labor and multiply by the average hourly labor cost of a farmers’ market salesperson from Worksheet 3 n n Include owner and family members’ hours Do not count the driver/lead salespersons’ time at market twice
Worksheet 6 - Marketing Cost Summary n n n This worksheet puts all our computations together. Find percentage rates for allocations from Worksheet 1 Find costs to be allocated from Worksheet 4 Multiply the appropriate percentage by the cost to be allocated, and enter the results for each channel. Enter channel specific costs from Worksheet 5 as needed.
Worksheet 6 - Marketing Cost Summary n n Total each category of costs (packing, transportation, selling & admin. ) for each marketing channel Divide each total by the total revenue for that channel to get cost as a percent of revenue. Add category totals to get total marketing cost for each channel. Divide total marketing cost by total revenue for each channel to get marketing cost as a percent of revenue for each marketing channel.
Congratulations! You have just determined a close estimate of the marketing costs of each of your marketing channels, including the cost of the farm owners’ and family members’ time.
Return to Marketing n Subtract the final line in Worksheet 6, the marketing costs as a percent of total revenue, from 1 to get a percentage called “Return to Marketing”
Medium Size Case Study Farm, 2005
Marketing Costs For All Delivered Product By Channel, Medium Farm
Marketing Costs For All Delivered Product By Channel, Medium Farm
Net Rate of Return to Marketing
COMPARING PROFITABILITY ACROSS CHANNELS
Factors Affecting Overall Profitability n n n Cost of production as a proportion of wholesale income, expressed as a decimal value. (Call this C) Proportion of farmers’ market load that is actually sold (Call this S) Average price markup rate for farmers’ market prices from wholesale prices (Call this M)
2 Sources of Unsold Product At Farmers Markets n n Product used for sampling, customer bonuses, and rounding-off weights. Product not sold because of lack of demand (such as bad weather) or because farmer used the marketing strategy of keeping the tables full all day (and much of this product is subsequently donated)
Unsold Product for Medium Farm n n Estimated proportion of delivered product that was unsold was about 20% But 30% of the unsold product was overripe or too damaged to be sold. 14 was unsold product rate for farmers’ market n Resulting in. 86 (1 -. 14) as value for S n
Comparing Profitability n Formula to determine profit of the farmers’ market channel minus profit in wholesale channel (RW is net rate of return to marketing in wholesale channel and RFM is net rate of return to marketing in farmers’ market channel):
Comparing Profit in Farmers Market minus Profit in Wholesale for Medium Farm
Conclusions n n Higher prices charged when direct marketing are necessary to cover higher marketing costs Differences in profitability across market channels are affected by: n n n Net rate of return to marketing in each channel (R) Proportion of product actually sold (S) Markup rate (M) Cost of production (C) Direct marketing can provide a market for produce that is not sellable in wholesale channel