Lecture 7 Curve Fitting Standard curves Straight line
 The equation of a straight line")
 points (xi, yi), i= 0,")


- Slides: 9
Lecture 7 Curve Fitting Standard curves (Straight line) The equation of a straight line is a first-degree relationship and can always be expressed in the form: where m = dy/dx is the gradient of the line and c is the y value where the line crosses the y-axis – the vertical intercept
Least Squares Method If there a set of (m+1) points (xi, yi), i= 0, 1, 2, ………. , , m or a function f(x) in an interval (a, b), and a set of basic (coordinate) functions φi(x), i= 0, 1, 2, ……. . , n, it is required to fit the function: n F(x) = Σ ai φi(x) i=0 to the given readings such that ρ(F(x), f(x)) will be minimum, where ai are coefficients to be determined. f(x) y = f(x) F(x) x Special cases: Polynomials Let φ0(x) = 1& φ1(x) = x & φ2(x) = x 2 & … φn(x) = xn i. e. F(x) = a 0 + a 1 x + a 2 x 2 + ……. … + an xn. By using the least square method the following matrices equations can be obtained
Σ 1 = number of the given readings = m + 1 Straight Line φ0(x) = 1& φ1(x) = x F(x) = a 0 + a 1 x
│ Σ 1 Σx │ │ a 0 │ = │ Σ y │ 2 │ Σx Σx │ │ a 1 │ │ Σ xy │ Solving these matrix equations to determine a 0 , a 1 Example: • Fit the straight line y = a 0 + a 1 x to the following readings: x 1 2 3 4 y 6. 5 9. 6 13. 8 18. 3 Number of readings = 4, the following table can be formed: x y x 2 xy 1 6. 5 2 9. 6 4 19. 2 3 13. 8 9 41. 4 4 18. 3 16 73. 5 10 48. 2 30 140. 3 Σ 1=4 & Σ x = 10 & Σ y = 48. 2 & Σ x 2 = 30 & Substitute in the matrix form: 4 10 a 0 48. 2 = 10 30 a 1 140. 3 48. 2 = 4 a 0 + 10 a 1 140. 3 = 10 a 0 + 30 a 1 By solving these equations the coefficients a 0 = 2. 15 & a 1 = 3. 96. • y = 2. 15 + 3. 96 x Σ xy = 140. 3
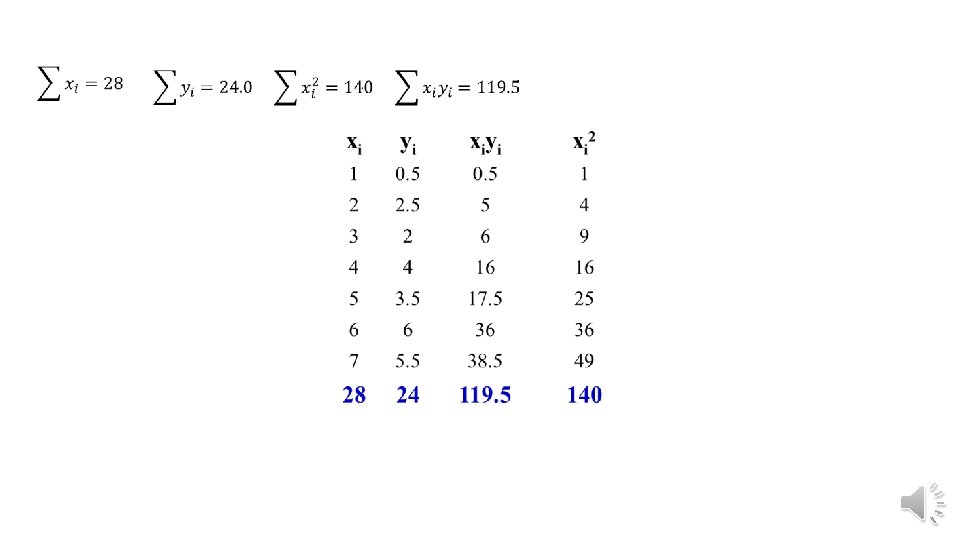
Linear Regression Fitting a straight line to a set of paired observations: (x 1, y 1), (x 2, y 2), …, (xn, yn). y = a 0+ a 1 x + e a 1 - slope a 0 - intercept e - error, or residual, between the model and the observations How to find a 0 and a 1 so that the error would be minimum? Least Squares Fit of a Straight Line: Example Fit a straight line to the x and y values in the following Table:
1 0 0 0 1 2. 9999999 3. 0682 1. 1591 Then a 0 = 2. 9999999, a 1 = 3. 0682, and a 2 = 1. 1591. The equation of the curve is 2. 999999 + 3. 0682 x + 1. 1591 x 2