Key Trends Shaping Transportation System Management Operations Timothy
- Slides: 13
Key Trends Shaping Transportation System Management Operations Timothy Papandreou CIO, Director Office of Innovation San Francisco Municipal Transportation Agency @tpap_
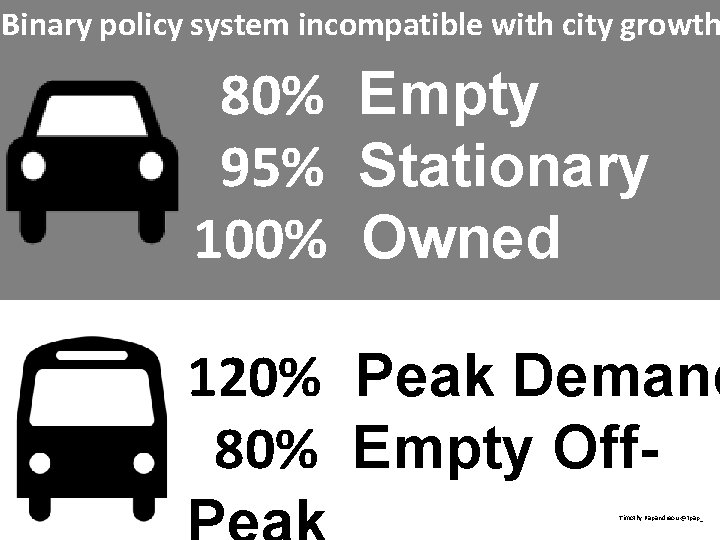
Binary policy system incompatible with city growth 80% Empty 95% Stationary 100% Owned 120% Peak Demand 80% Empty Off. Timothy Papandreou @tpap_
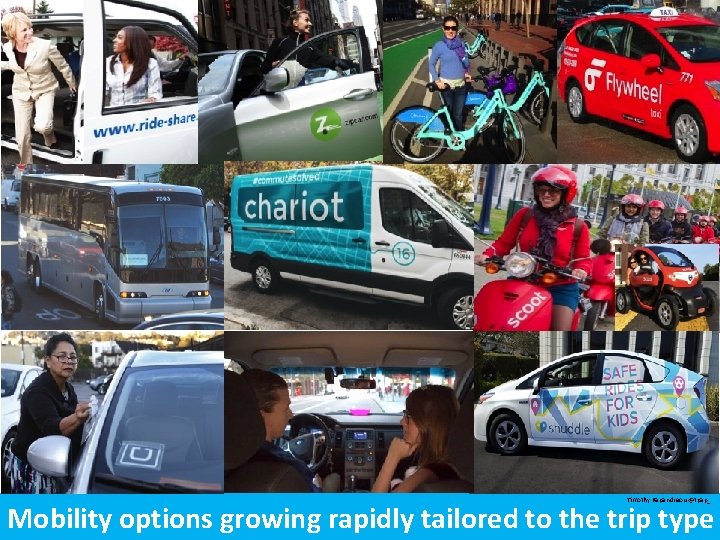
Timothy Papandreou @tpap_ @NACTO #NACTO 14 Mobility options growing rapidly tailored to the@tpap_ trip type
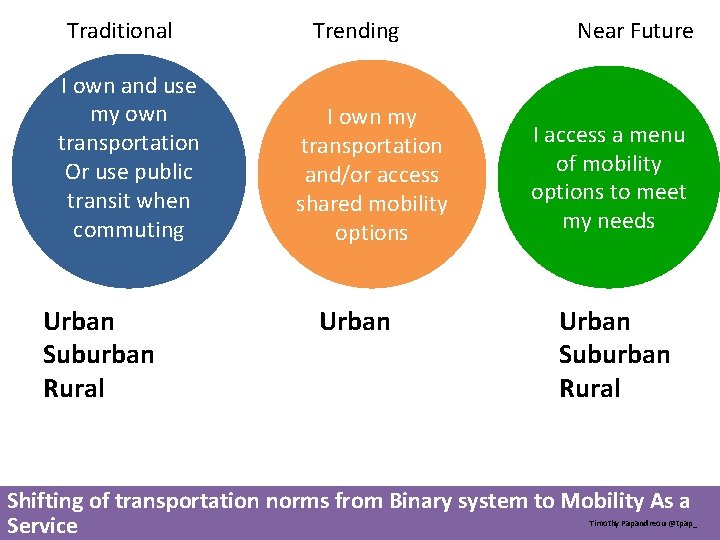
Traditional I own and use my own transportation Or use public transit when commuting Urban Suburban Rural Trending I own my transportation and/or access shared mobility options Urban Near Future I access a menu of mobility options to meet my needs Urban Suburban Rural Shifting of transportation norms from Binary system to Mobility As 4 a Service Timothy Papandreou @tpap_
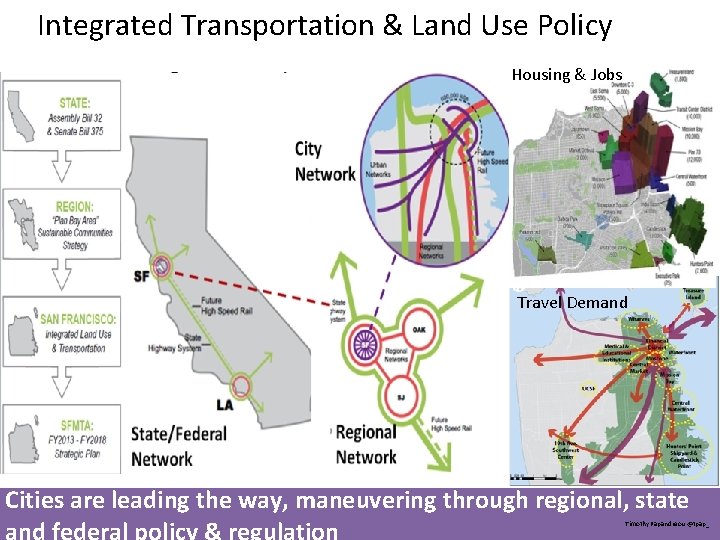
Integrated Transportation & Land Use Policy Housing & Jobs Travel Demand Cities are leading the way, maneuvering through regional, state and federal policy & regulation Timothy Papandreou @tpap_
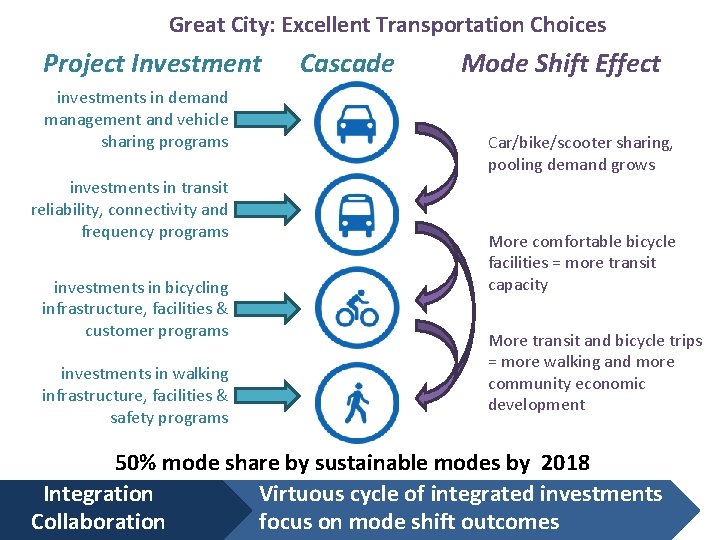
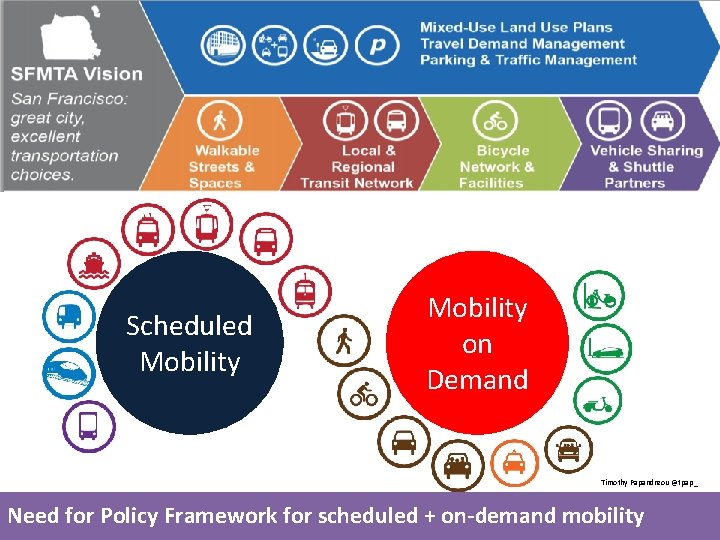
Great City: Excellent Transportation Choices Project Investment investments in demand management and vehicle sharing programs investments in transit reliability, connectivity and frequency programs investments in bicycling infrastructure, facilities & customer programs investments in walking infrastructure, facilities & safety programs Cascade Mode Shift Effect Car/bike/scooter sharing, pooling demand grows More comfortable bicycle facilities = more transit capacity More transit and bicycle trips = more walking and more community economic development 50% mode share by sustainable modes by 2018 Integration Virtuous cycle of integrated investments Collaboration focus on mode shift outcomes
Scheduled Mobility on Demand Timothy Papandreou @tpap_ Need for Policy Framework for scheduled + on-demand mobility 7
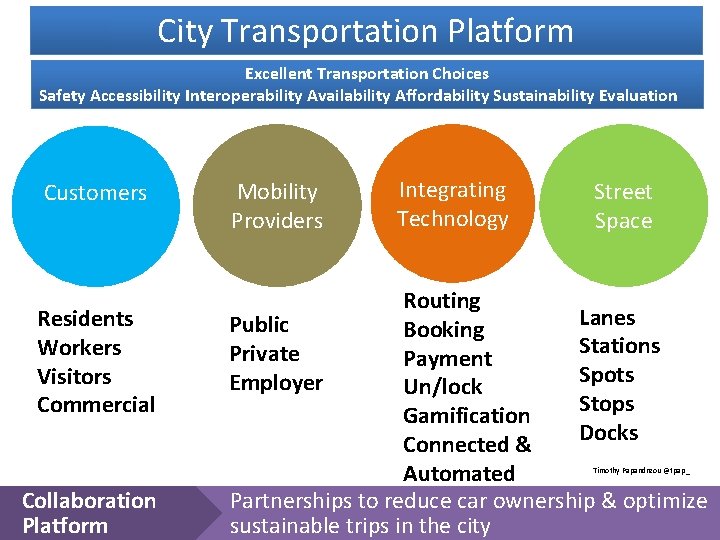
City Transportation Platform Excellent Transportation Choices Safety Accessibility Interoperability Availability Affordability Sustainability Evaluation Customers Residents Workers Visitors Commercial Mobility Providers Integrating Technology Street Space Routing Lanes Public Booking Stations Private Payment Spots Employer Un/lock Stops Gamification Docks Connected & Automated Partnerships to reduce car ownership & optimize 8 sustainable trips in the city Timothy Papandreou @tpap_ Collaboration Platform
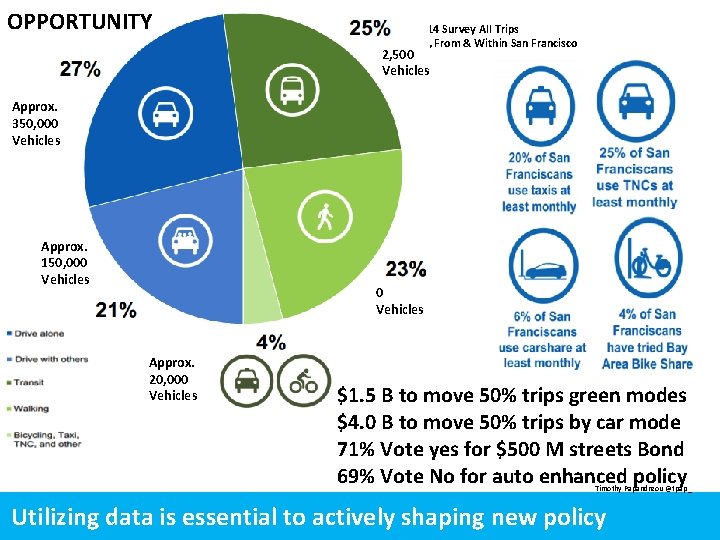
OPPORTUNITY 2014 Survey All Trips to, From & Within San Francisco 2, 500 Vehicles Approx. 350, 000 Vehicles Approx. 150, 000 Vehicles Approx. 20, 000 Vehicles $1. 5 B to move 50% trips green modes $4. 0 B to move 50% trips by car mode 71% Vote yes for $500 M streets Bond 69% Vote No for auto enhanced policy Timothy Papandreou @tpap_ Utilizing data is essential to actively shaping new policy
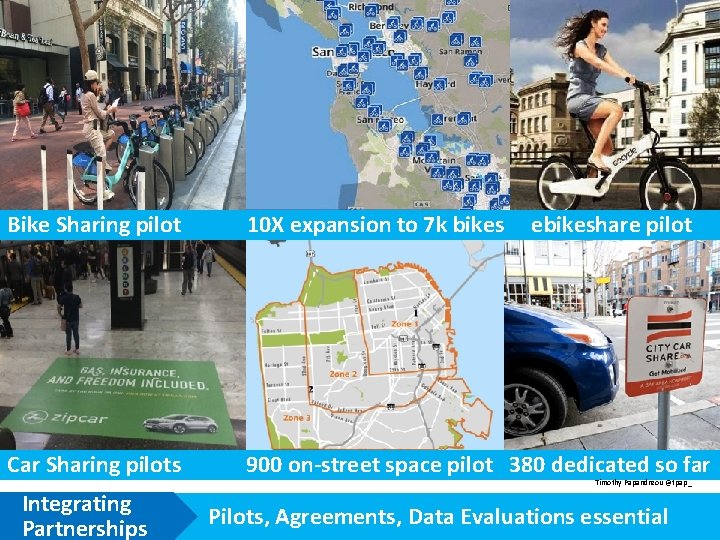
Bike Sharing pilot 10 X expansion to 7 k bikes Car Sharing pilots 900 on-street space pilot 380 dedicated so far Integrating Partnerships ebikeshare pilot Timothy Papandreou @tpap_ Pilots, Agreements, Data Evaluations essential
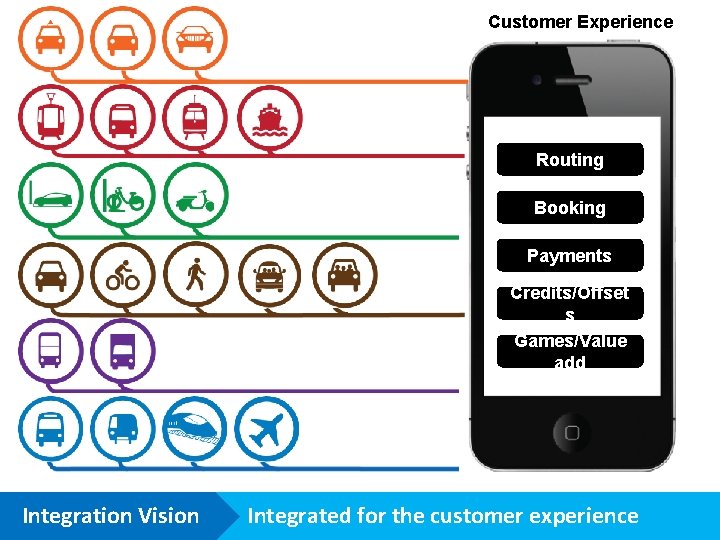
Customer Experience Routing Booking Payments Credits/Offset s Games/Value add Integration Vision Integrated for the customer experience
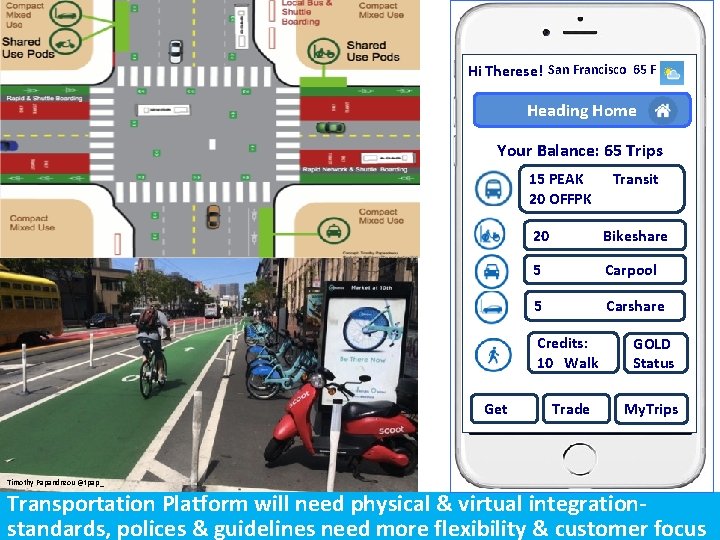
Hi Therese! San Francisco 65 F Heading Home Your Balance: 65 Trips 15 PEAK 20 OFFPK 20 Get Transit Hi Tim!Bikeshare 5 Carpool 5 Carshare Credits: 10 Walk GOLD Status Trade My. Trips Timothy Papandreou @tpap_ Transportation Platform will need physical & virtual integrationstandards, polices & guidelines need more flexibility & customer focus
Timothy. papandreou@sfmta. com Timothy Papandreou @tpap_ 13