TRANSPORTATION SYSTEMS MANAGEMENT AND OPERATIONS Program Plan Development


 o")


- Slides: 38
TRANSPORTATION SYSTEMS MANAGEMENT AND OPERATIONS Program Plan Development Roundtable December 13, 2016
Why TSMO in Iowa? Iowa’s TSMO Program Plan The ICE-OPS Analysis www. iowadot. gov/tsmo
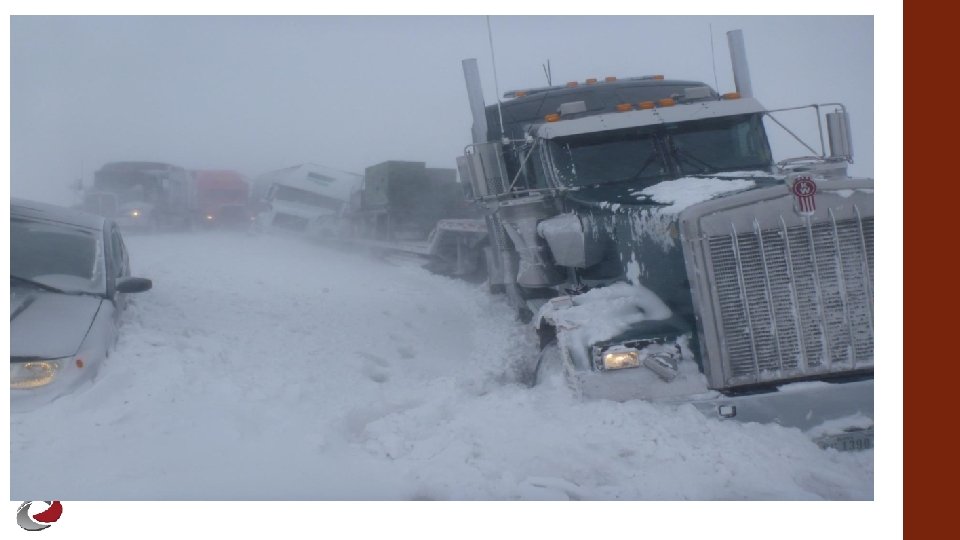
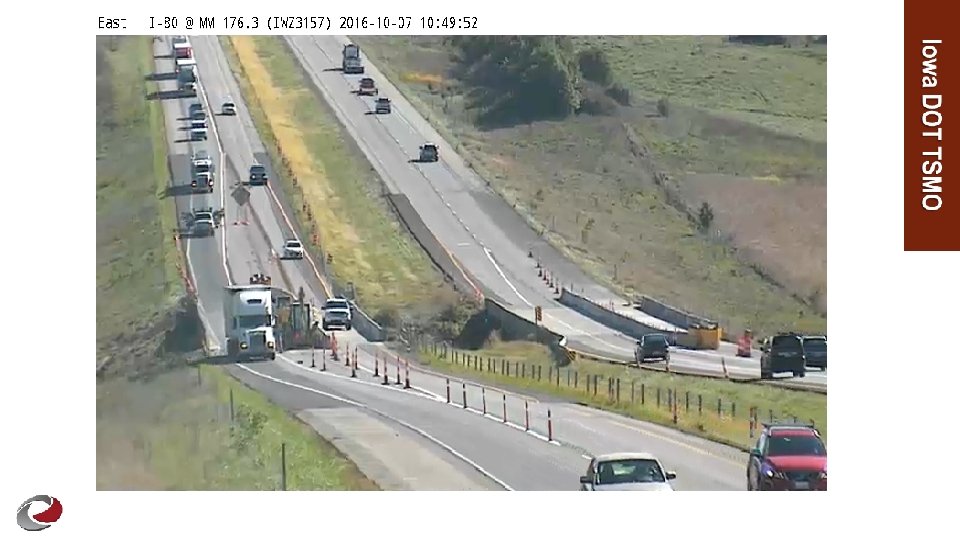
Poor Signal Timing; 5% Special Events; 5% Recurrent Congestion Bottlenecks; 23% Bad Weather; 28% Non-recurrent Congestion Work Zones; 12% Traffic Incidents; 27%
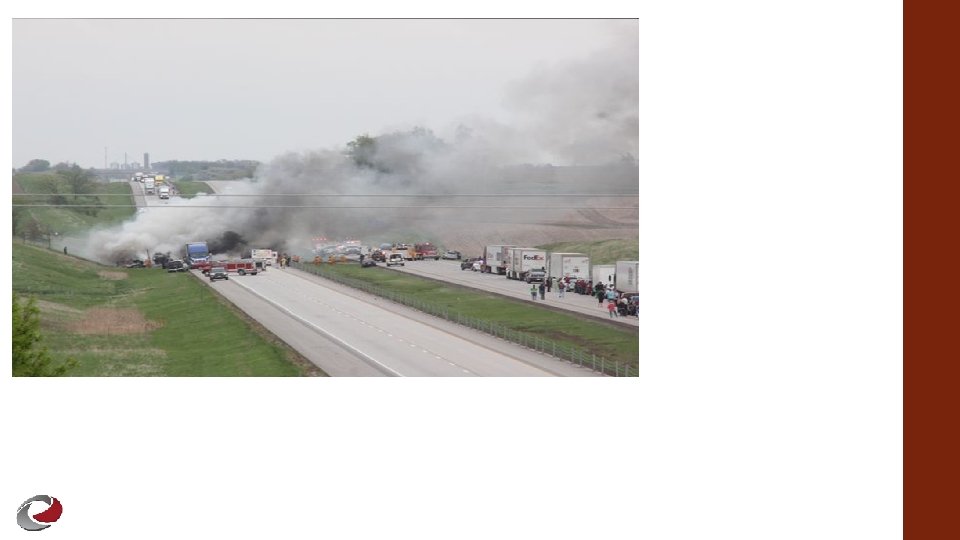
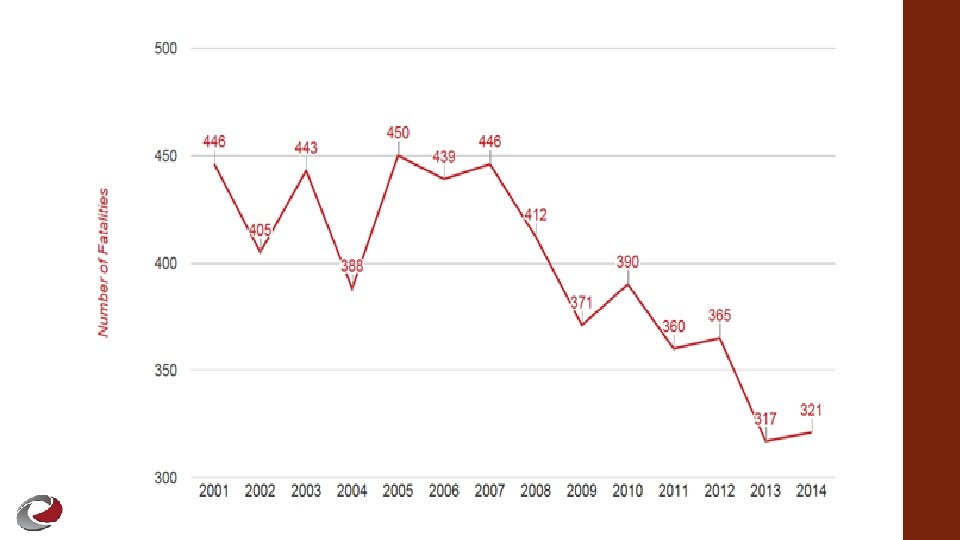
BY THE NUMBERS 35, 092 U. S. FATALITIES IN 2015
BY THE NUMBERS 35, 092 U. S. FATALITIES IN 2015 FATALITIES IN IOWA IN 2015 320
BY THE NUMBERS 35, 092 U. S. FATALITIES IN 2015 FATALITIES IN IOWA IN 2015 320 AVG 1, 900 INCIDENTS PER MONTH
Emergency Vehicles; Flooding; 2; 0% 31; 2% 2 vehicle collision; 82; 4% Winter Closure; 4; 0% 1 vehicle collision; 3+ vehicle collision; 36; 2% 234; 13% Debris in Roadway; 187; 10% 1 vehicle collision Debris in Roadway Road Work Slow Traffic Stalled Vehicle; 769; 43% Winter Closure Road Work; 407; 23% Flooding 2 vehicle collision 3+ vehicle collision Emergency Vehicles Slow Traffic ; 50; 3%
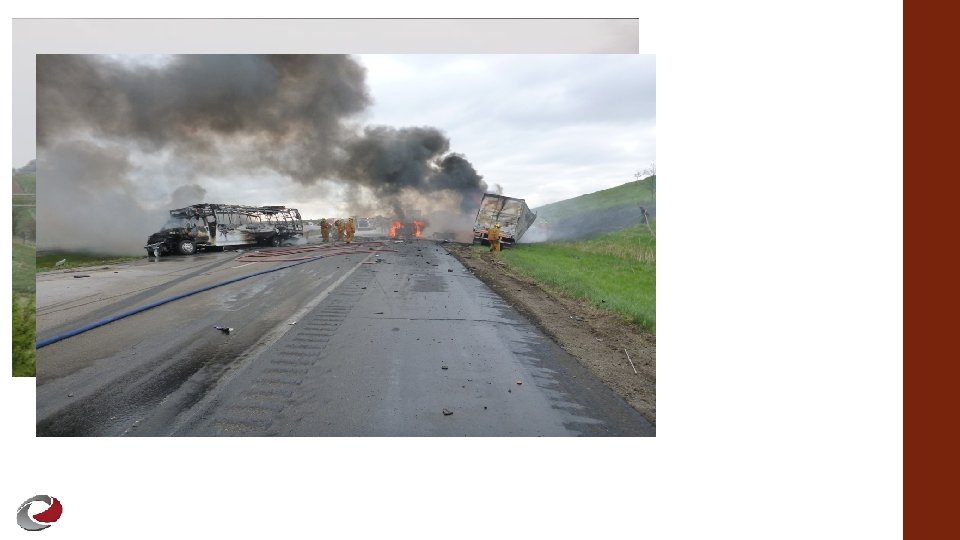
BY THE NUMBERS 35, 092 U. S. FATALITIES IN 2015 AVG MINUTES LANES BLOCKED 56 FATALITIES IN IOWA IN 2015 320 AVG 1, 900 INCIDENTS PER MONTH
BY THE NUMBERS 35, 092 FATALITIES IN 320 U. S. FATALITIES IN 2015 1: 4 AVG MINUTES LANES BLOCKED 56 IOWA IN 2015 RATIO OF LANE BLOCKAGE TO DELAY AVG 1, 900 INCIDENTS PER MONTH
BY THE NUMBERS 35, 092 FATALITIES IN 320 U. S. FATALITIES IN 2015 1: 4 AVG MINUTES LANES BLOCKED 56 IOWA IN 2015 RATIO OF LANE BLOCKAGE TO DELAY AVG 1, 900 INCIDENTS PER MONTH PER MINUTE LIKELIHOOD OF A SECONDARY CRASH 2. 8%
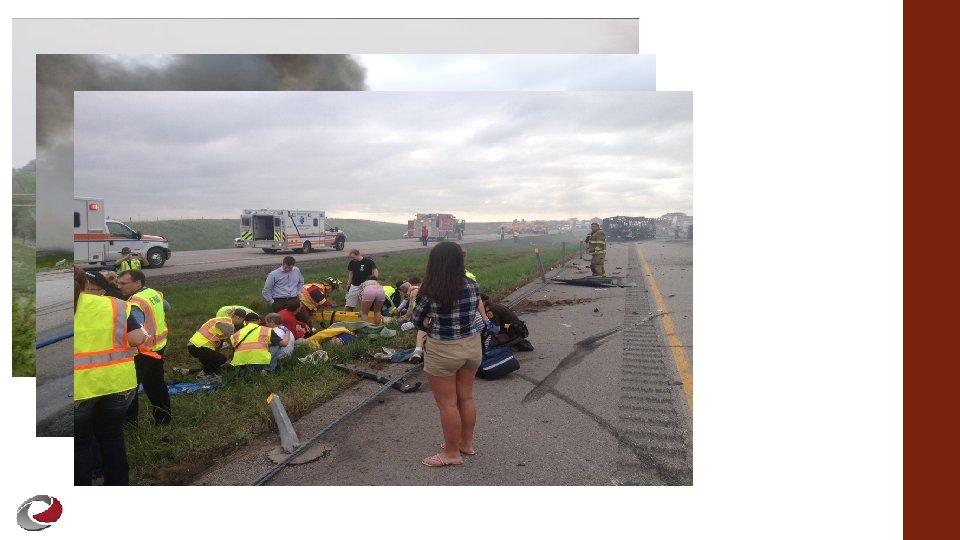
People are safer when we keep traffic moving
BY THE NUMBERS $ 563 B GOODS MOVING THROUGH IOWA VALUE OF
BY THE NUMBERS $ 563 B GOODS MOVING THROUGH IOWA VALUE OF GOODS SHIPPED BY 80% TRUCK
BY THE NUMBERS $ 563 B GOODS MOVING THROUGH IOWA VALUE OF GOODS SHIPPED BY 80% TRUCK 32% PROJECTED GROWTH IN TRUCK TONNAGE
BY THE NUMBERS $ 563 B GOODS MOVING THROUGH IOWA VALUE OF $380 M LOST TIME AND WASTED FUEL GOODS SHIPPED BY 80% TRUCK 32% PROJECTED GROWTH IN TRUCK TONNAGE
BY THE NUMBERS $ 563 B GOODS MOVING THROUGH IOWA VALUE OF $380 M GOODS SHIPPED BY TRUCK 80% $536, 000 LOST TIME AND WASTED FUEL IN PROJECTED GROWTH IN TRUCK TONNAGE IN DELAY COSTS ON 380 32% JULY 2015 I-
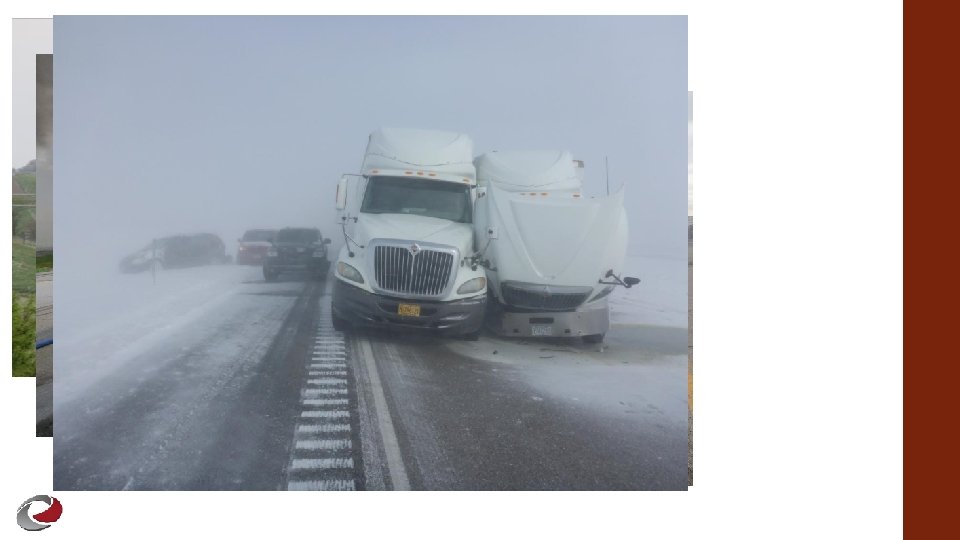
The transportation system is more efficient when we keep traffic moving
Iowa’s TSMO Program Plan www. iowadot. gov/tsmo
Iowa TSMO Plan § § Completed in February 2016 5 Year Plan Annualized Accomplishment Year Plan http: //www. iowadot. gov/tsmo/
Three Levels of the TSMO Plan
TSMO Service Layers Traffic Management Center ITS and Communications Traveler Information Traffic Incident Management Emergency Transportation Operations Work Zone Management Active Transp. and Demand Management Connected and Autonomous Vehicle
TSMO Capability Maturity 5 -Year Program Integration and ICE -OPS Systems and Technology New ATMS and Decision Support System Performance Management Real-Time System Performance Measures Culture GOAL: 3. 0 5 -Year Goal Business Processes TSMO-Oriented Policies and Buy-in Organization/ Staffing District Capacity Building Collaboration Internal and External Relationships LEVEL 1 Performed LEVEL 2 Managed LEVEL 3 Integrated LEVEL 4 Optimized
The ICE-OPS Analysis www. iowadot. gov/tsmo
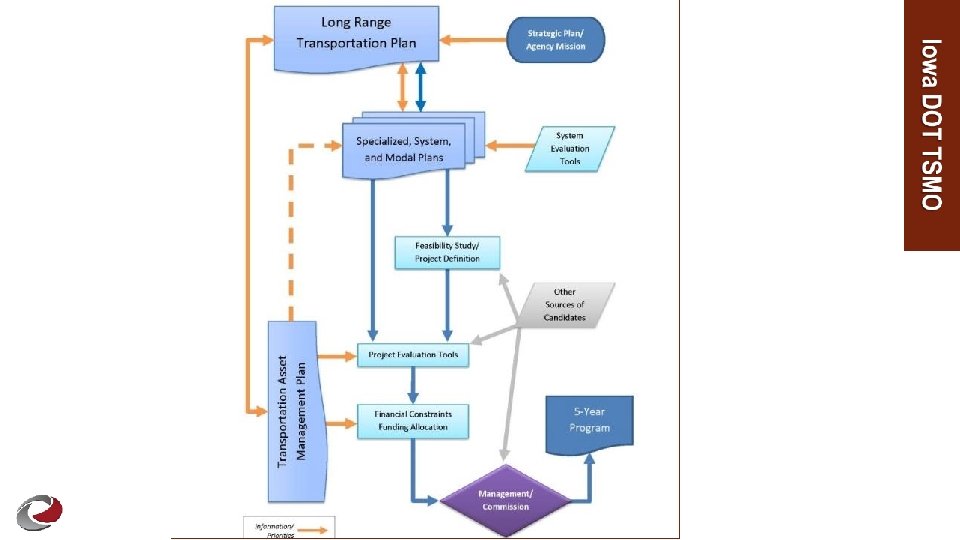
TSMO Relationship to Planning New plans being developed (TSMO Plan, Interstate Corridor Plan, State Freight Plan, Transportation Asset Management Plan, etc. ) § Some required; all good practice § Need to explore plan relationships § Iterative/cyclical process § Key part of updating the Long Range Transportation Plan §
ICE – Infrastructure Condition Evaluation Screening tool to inform use of limited resources § Focused on pavements and bridges § Developed by Planning office §
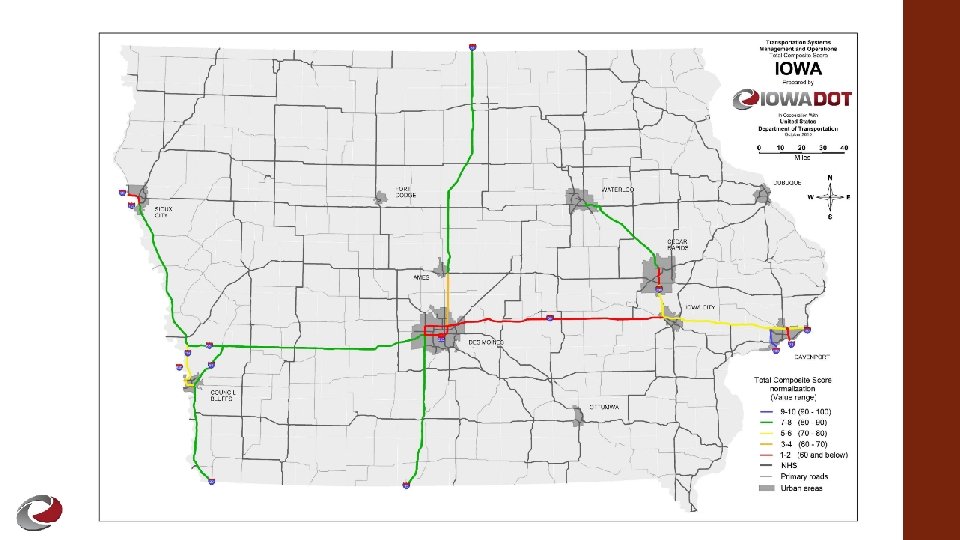
ICE–OPS - Infrastructure Condition Evaluation for Operations Developed parallel tool with similar structure, but with operations focus § Information summarized to 21 interstate corridors §
ICE-OPS Structure § Uses nine operations-oriented criteria: All bottleneck occurrences per mile (10%) o Freight bottleneck occurrences per mile (10%) o Traffic incident frequency per mile (15%) o Crash rate (15%) o Planning time index (10%) o Event center buffer index (5%) o Weather-sensitive corridor mileage (10%) o Average annual daily traffic (20%) o ICE rating (5%) o
ICE-OPS Structure cont. § § § Each criteria assigned a normalized value (1 -10 scale) based on range of observed values Calculates composite score after applying weighting to each normalized value (max 100) Ranks interstate corridors from an operational perspective
Thank You! Scott Marler Director, Office of Traffic Operations scott. marler@iowadot. us 515. 239. 1040 www. iowadot. gov/tsmo