KDD Group Presentation 8 Fall 01 Constructive Induction

- Slides: 25
KDD - Group Presentation #8 - Fall ‘ 01 Constructive Induction for Knowledge Discovery: Clustering Techniques for KDD Friday, November 9, 2001 Cecil P. Schmidt Department of Computing and Information Sciences, Kansas State University http: //www. cis. ksu. edu/~cps 4444@cis. ksu. edu KDD Group Presentation #7 Fall’ 01 Kansas State University Department of Computing and Information Sciences
Presentation Outline • • • Background and definitions The K-Means Algorithm Similarity, Association, and Distance K, Weights, and Scaling Agglomerative Algorithms – Agglomeration by Single Linkage – Agglomeration By Comparison of Centroids • Two-level Approach • Summary and Discussion • Bibliography KDD Group Presentation #7 Fall’ 01 Kansas State University Department of Computing and Information Sciences
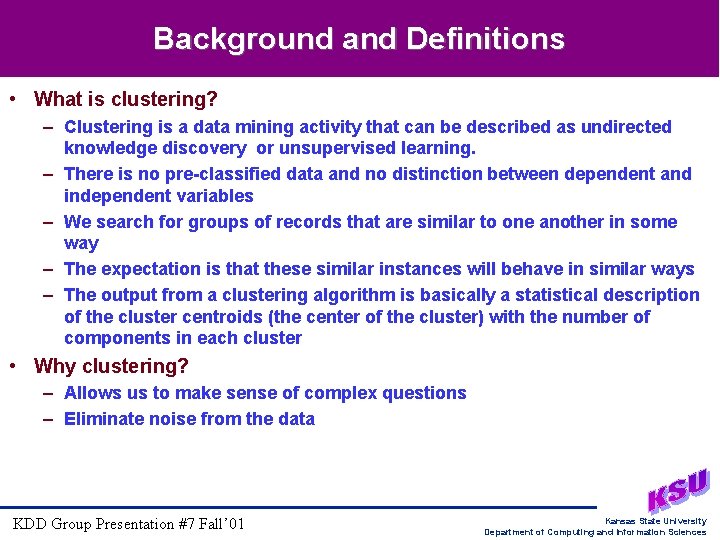
Background and Definitions • What is clustering? – Clustering is a data mining activity that can be described as undirected knowledge discovery or unsupervised learning. – There is no pre-classified data and no distinction between dependent and independent variables – We search for groups of records that are similar to one another in some way – The expectation is that these similar instances will behave in similar ways – The output from a clustering algorithm is basically a statistical description of the cluster centroids (the center of the cluster) with the number of components in each cluster • Why clustering? – Allows us to make sense of complex questions – Eliminate noise from the data KDD Group Presentation #7 Fall’ 01 Kansas State University Department of Computing and Information Sciences
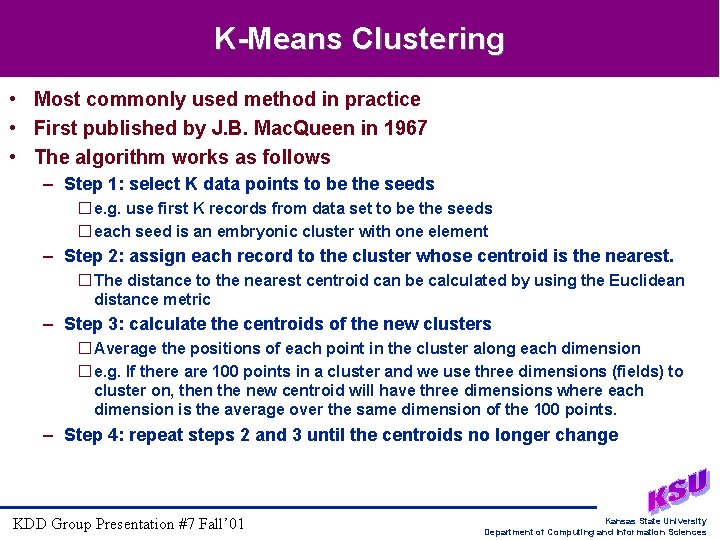
K-Means Clustering • Most commonly used method in practice • First published by J. B. Mac. Queen in 1967 • The algorithm works as follows – Step 1: select K data points to be the seeds � e. g. use first K records from data set to be the seeds � each seed is an embryonic cluster with one element – Step 2: assign each record to the cluster whose centroid is the nearest. � The distance to the nearest centroid can be calculated by using the Euclidean distance metric – Step 3: calculate the centroids of the new clusters � Average the positions of each point in the cluster along each dimension � e. g. If there are 100 points in a cluster and we use three dimensions (fields) to cluster on, then the new centroid will have three dimensions where each dimension is the average over the same dimension of the 100 points. – Step 4: repeat steps 2 and 3 until the centroids no longer change KDD Group Presentation #7 Fall’ 01 Kansas State University Department of Computing and Information Sciences
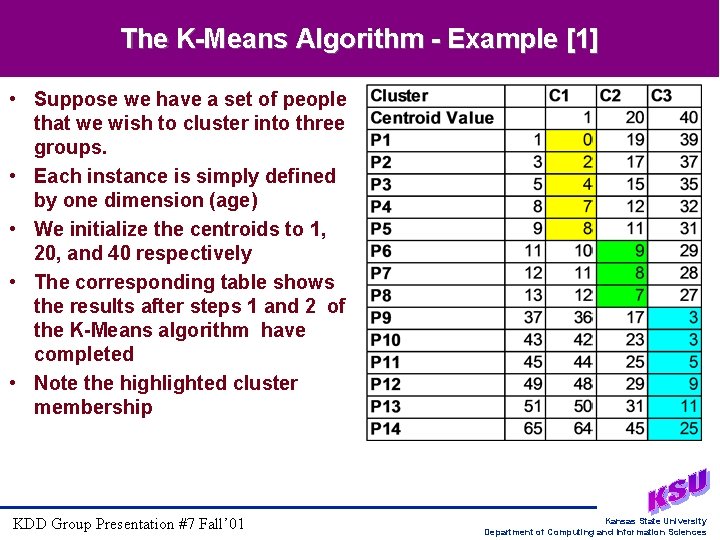
The K-Means Algorithm - Example [1] • Suppose we have a set of people that we wish to cluster into three groups. • Each instance is simply defined by one dimension (age) • We initialize the centroids to 1, 20, and 40 respectively • The corresponding table shows the results after steps 1 and 2 of the K-Means algorithm have completed • Note the highlighted cluster membership KDD Group Presentation #7 Fall’ 01 Kansas State University Department of Computing and Information Sciences
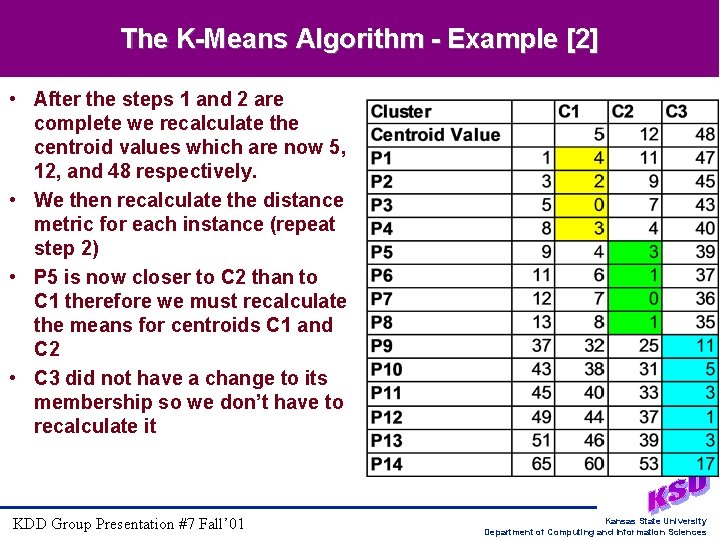
The K-Means Algorithm - Example [2] • After the steps 1 and 2 are complete we recalculate the centroid values which are now 5, 12, and 48 respectively. • We then recalculate the distance metric for each instance (repeat step 2) • P 5 is now closer to C 2 than to C 1 therefore we must recalculate the means for centroids C 1 and C 2 • C 3 did not have a change to its membership so we don’t have to recalculate it KDD Group Presentation #7 Fall’ 01 Kansas State University Department of Computing and Information Sciences
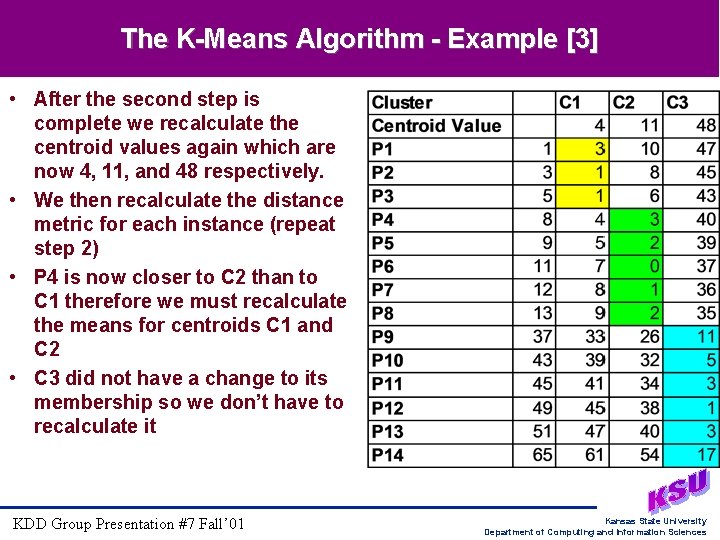
The K-Means Algorithm - Example [3] • After the second step is complete we recalculate the centroid values again which are now 4, 11, and 48 respectively. • We then recalculate the distance metric for each instance (repeat step 2) • P 4 is now closer to C 2 than to C 1 therefore we must recalculate the means for centroids C 1 and C 2 • C 3 did not have a change to its membership so we don’t have to recalculate it KDD Group Presentation #7 Fall’ 01 Kansas State University Department of Computing and Information Sciences
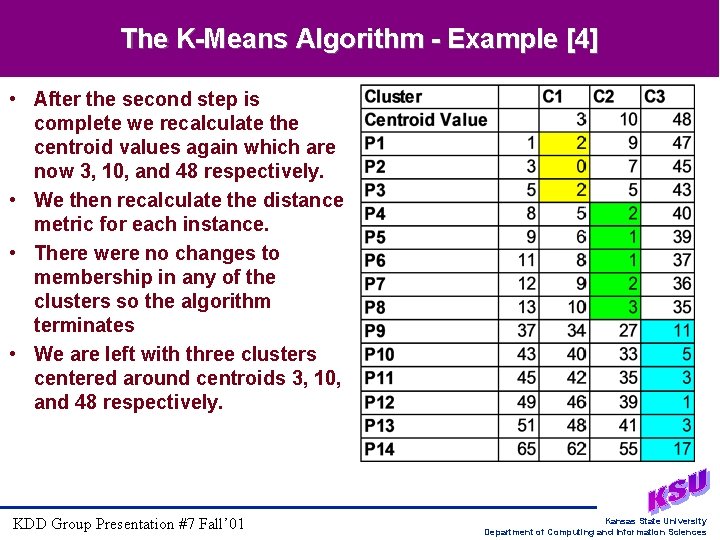
The K-Means Algorithm - Example [4] • After the second step is complete we recalculate the centroid values again which are now 3, 10, and 48 respectively. • We then recalculate the distance metric for each instance. • There were no changes to membership in any of the clusters so the algorithm terminates • We are left with three clusters centered around centroids 3, 10, and 48 respectively. KDD Group Presentation #7 Fall’ 01 Kansas State University Department of Computing and Information Sciences
Similarity, Association, and Distance • Similarity, Association, and Distance – How do we convert our intuitive notions that members of a cluster have some type of natural association to a representative metric? – We could use a geometric conversion but there are problems with this � Many variable types, such as categorical variables and many numerical variables such as rankings, cannot be converted. � In a database the contributions of one dimension may be more important than another – To understand these issues we must review measurement theory [3] � nominal - has no meaning; e. g. sports uniform numbers � ordinal - means one before other; e. g. class rank � interval - distance between two observations; no well understood zero; Temp. � ratio - has well understood zero; e. g. feet to meters � absolute - no conversion required; eg. lines of code – Two of the most often used measures include � Euclidian distance - the square root of the sum of the squared distances � Number of common features - count of the degree of overlap which could produce a ratio of number of matches to total number of fields KDD Group Presentation #7 Fall’ 01 Kansas State University Department of Computing and Information Sciences
K, Weights, and Scaling • How do we choose K? – In many cases we have no prior knowledge of the number of clusters there should be – K is often chosen at random and with the results tested for the cluster strength; eg. average distance between records in a cluster – Subjective evaluation is also required – K could be a hyper-parameter with fitness determined by a cluster strength metric • Weighting and Scaling of variables (A Data Cleansing Process) – Scaling deals with the problem that different variables are measured in different units � Converting all measurements to scale; eg. Feet, inches, and miles to inches � How about different types of measurements? This is a problem! � We can overcome this somewhat by mapping all variables to a common range so that a change in ratio is comparable between the variables – Weighting deals with the problem that we care about some variables more than others � Weighting can be used to bias one field over another � It can also be used as an optimization parameter with GA’s KDD Group Presentation #7 Fall’ 01 Kansas State University Department of Computing and Information Sciences
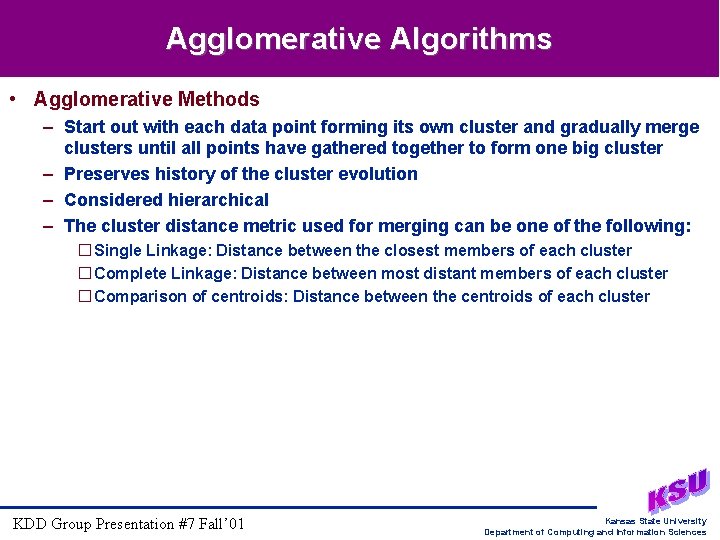
Agglomerative Algorithms • Agglomerative Methods – Start out with each data point forming its own cluster and gradually merge clusters until all points have gathered together to form one big cluster – Preserves history of the cluster evolution – Considered hierarchical – The cluster distance metric used for merging can be one of the following: � Single Linkage: Distance between the closest members of each cluster � Complete Linkage: Distance between most distant members of each cluster � Comparison of centroids: Distance between the centroids of each cluster KDD Group Presentation #7 Fall’ 01 Kansas State University Department of Computing and Information Sciences
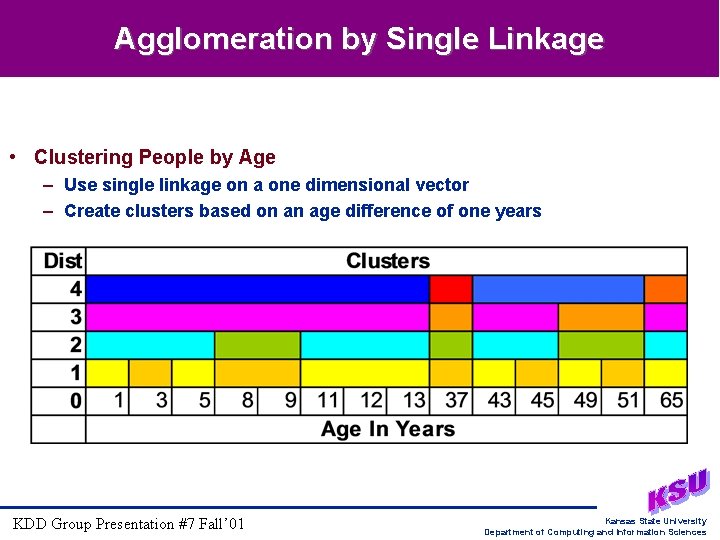
Agglomeration by Single Linkage • Clustering People by Age – Use single linkage on a one dimensional vector – Create clusters based on an age difference of one years KDD Group Presentation #7 Fall’ 01 Kansas State University Department of Computing and Information Sciences
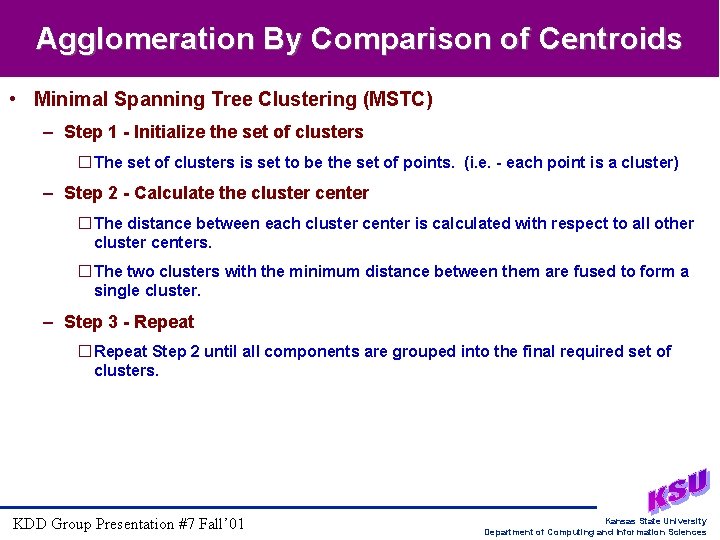
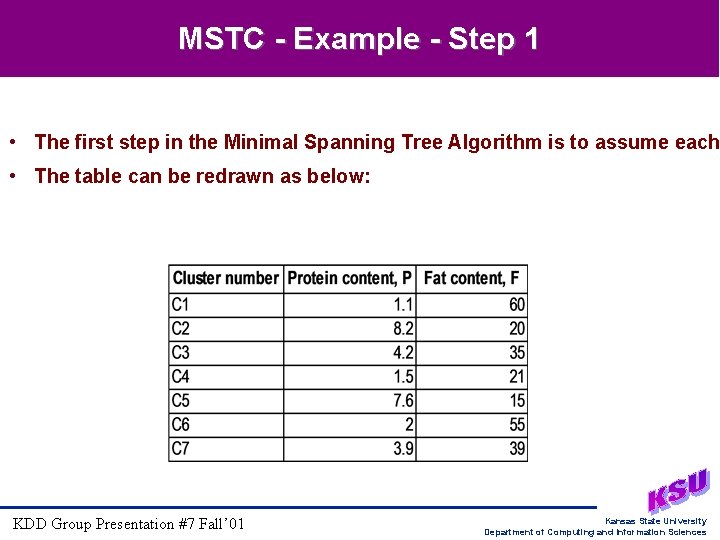
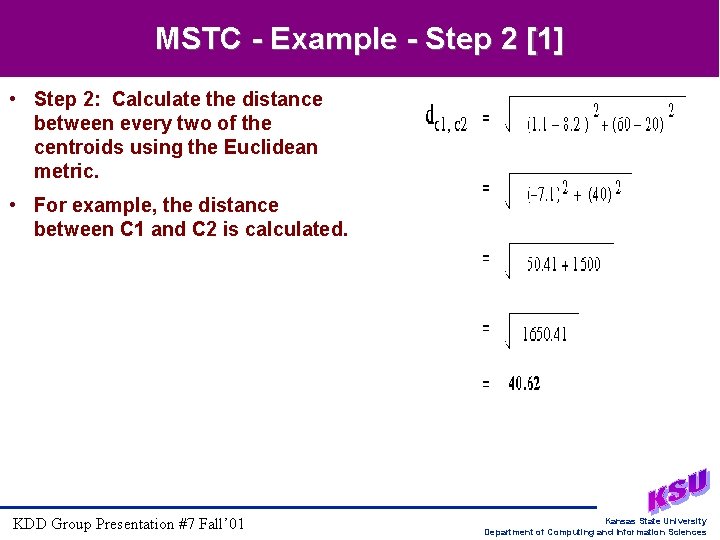
Agglomeration By Comparison of Centroids • Minimal Spanning Tree Clustering (MSTC) – Step 1 - Initialize the set of clusters � The set of clusters is set to be the set of points. (i. e. - each point is a cluster) – Step 2 - Calculate the cluster center � The distance between each cluster center is calculated with respect to all other cluster centers. � The two clusters with the minimum distance between them are fused to form a single cluster. – Step 3 - Repeat � Repeat Step 2 until all components are grouped into the final required set of clusters. KDD Group Presentation #7 Fall’ 01 Kansas State University Department of Computing and Information Sciences
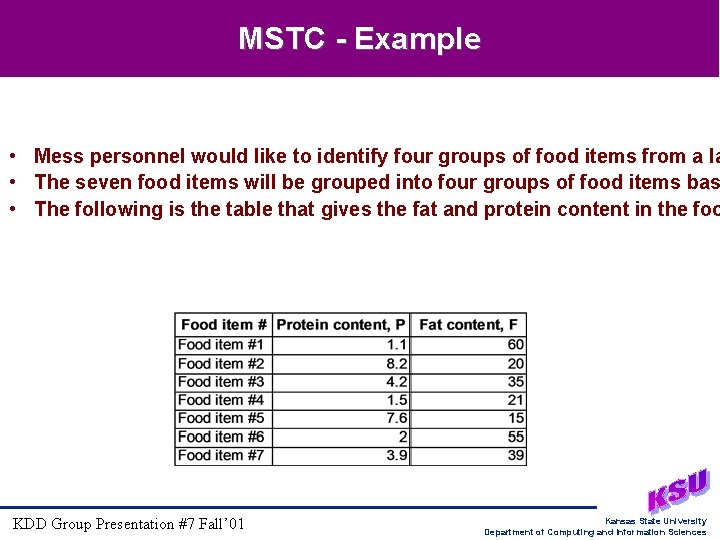
MSTC - Example • Mess personnel would like to identify four groups of food items from a la • The seven food items will be grouped into four groups of food items bas • The following is the table that gives the fat and protein content in the foo KDD Group Presentation #7 Fall’ 01 Kansas State University Department of Computing and Information Sciences
MSTC - Example - Step 1 • The first step in the Minimal Spanning Tree Algorithm is to assume each • The table can be redrawn as below: KDD Group Presentation #7 Fall’ 01 Kansas State University Department of Computing and Information Sciences
MSTC - Example - Step 2 [1] • Step 2: Calculate the distance between every two of the centroids using the Euclidean metric. • For example, the distance between C 1 and C 2 is calculated. KDD Group Presentation #7 Fall’ 01 Kansas State University Department of Computing and Information Sciences
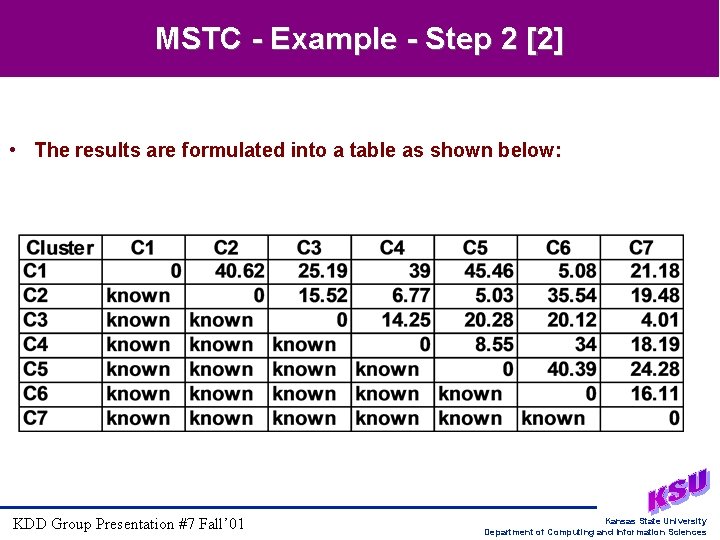
MSTC - Example - Step 2 [2] • The results are formulated into a table as shown below: KDD Group Presentation #7 Fall’ 01 Kansas State University Department of Computing and Information Sciences
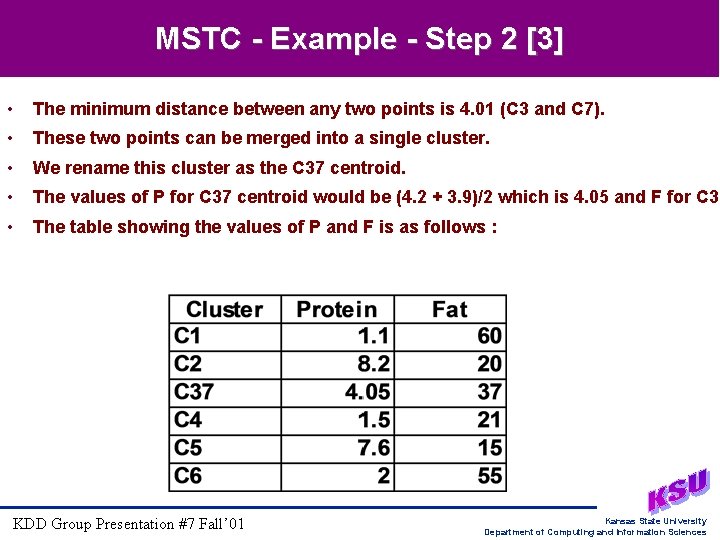
MSTC - Example - Step 2 [3] • The minimum distance between any two points is 4. 01 (C 3 and C 7). • These two points can be merged into a single cluster. • We rename this cluster as the C 37 centroid. • The values of P for C 37 centroid would be (4. 2 + 3. 9)/2 which is 4. 05 and F for C 37 • The table showing the values of P and F is as follows : KDD Group Presentation #7 Fall’ 01 Kansas State University Department of Computing and Information Sciences
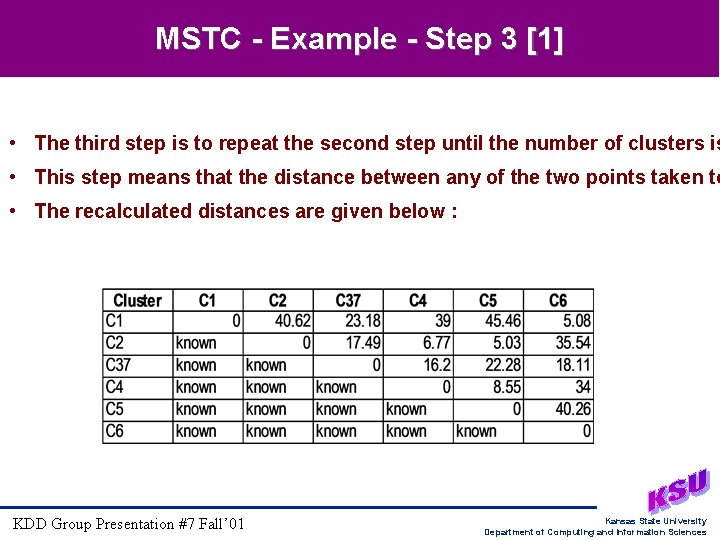
MSTC - Example - Step 3 [1] • The third step is to repeat the second step until the number of clusters is • This step means that the distance between any of the two points taken to • The recalculated distances are given below : KDD Group Presentation #7 Fall’ 01 Kansas State University Department of Computing and Information Sciences
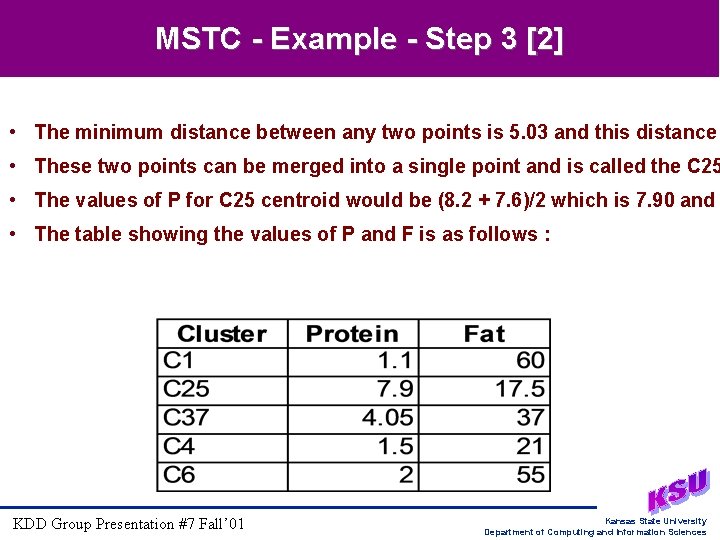
MSTC - Example - Step 3 [2] • The minimum distance between any two points is 5. 03 and this distance • These two points can be merged into a single point and is called the C 25 • The values of P for C 25 centroid would be (8. 2 + 7. 6)/2 which is 7. 90 and • The table showing the values of P and F is as follows : KDD Group Presentation #7 Fall’ 01 Kansas State University Department of Computing and Information Sciences
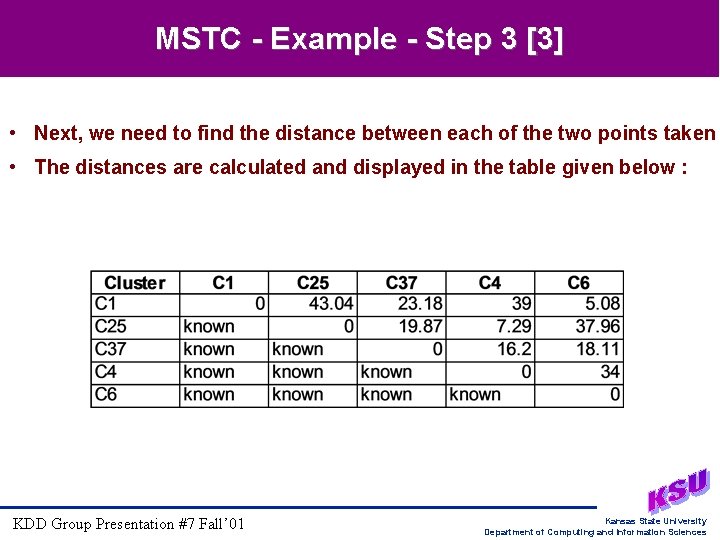
MSTC - Example - Step 3 [3] • Next, we need to find the distance between each of the two points taken • The distances are calculated and displayed in the table given below : KDD Group Presentation #7 Fall’ 01 Kansas State University Department of Computing and Information Sciences
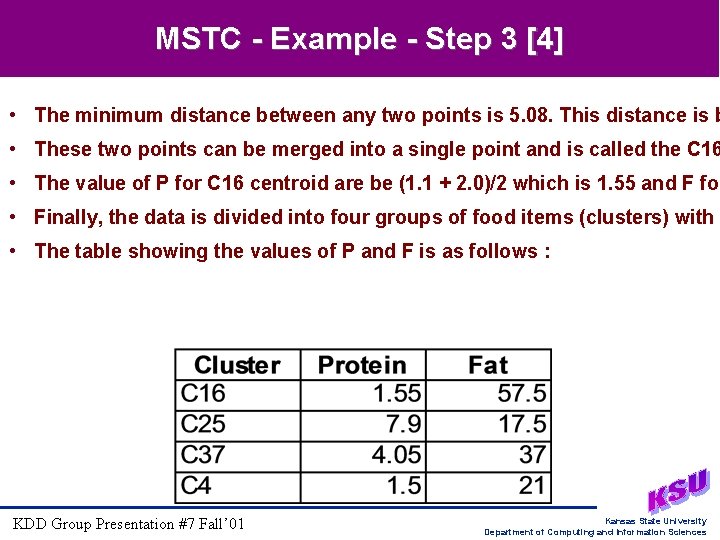
MSTC - Example - Step 3 [4] • The minimum distance between any two points is 5. 08. This distance is b • These two points can be merged into a single point and is called the C 16 • The value of P for C 16 centroid are be (1. 1 + 2. 0)/2 which is 1. 55 and F for • Finally, the data is divided into four groups of food items (clusters) with • The table showing the values of P and F is as follows : KDD Group Presentation #7 Fall’ 01 Kansas State University Department of Computing and Information Sciences
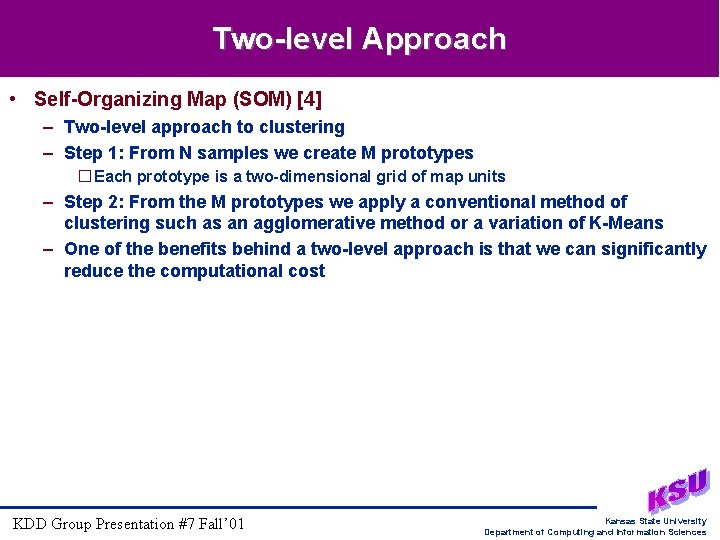
Two-level Approach • Self-Organizing Map (SOM) [4] – Two-level approach to clustering – Step 1: From N samples we create M prototypes � Each prototype is a two-dimensional grid of map units – Step 2: From the M prototypes we apply a conventional method of clustering such as an agglomerative method or a variation of K-Means – One of the benefits behind a two-level approach is that we can significantly reduce the computational cost KDD Group Presentation #7 Fall’ 01 Kansas State University Department of Computing and Information Sciences
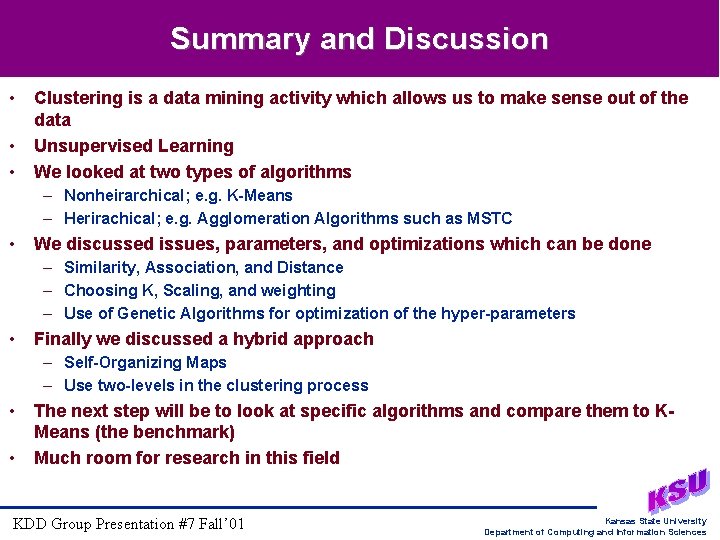
Summary and Discussion • • • Clustering is a data mining activity which allows us to make sense out of the data Unsupervised Learning We looked at two types of algorithms – Nonheirarchical; e. g. K-Means – Herirachical; e. g. Agglomeration Algorithms such as MSTC • We discussed issues, parameters, and optimizations which can be done – Similarity, Association, and Distance – Choosing K, Scaling, and weighting – Use of Genetic Algorithms for optimization of the hyper-parameters • Finally we discussed a hybrid approach – Self-Organizing Maps – Use two-levels in the clustering process • • The next step will be to look at specific algorithms and compare them to KMeans (the benchmark) Much room for research in this field KDD Group Presentation #7 Fall’ 01 Kansas State University Department of Computing and Information Sciences
Bibliography • [1] Menasce’, D. A. , Denning, P. J. , et. al. , DAU Stat Refresher Module, http: //cne. gmu. edu/modules/dau/stat/clustgalgs/clust 4_frm. html, Center for the New Engineer, George Mason University, Fairfax, Virginia • [2] Berry, M. J. A. , and Linoff, G. S. Data Mining Techniques for Marketing, Sales, and Customer Support. John Wiley and Sons, New York, NY, 1997. • [3] Gustafson, D. , CIS 740 Software Engineering Course Notes, Fall, 2000 • [4] Vesanto, J. and Alhoniemi, E. , Clustering of the Self-Organizing Map, IEEE Transactions on Neural Networks, accepted KDD Group Presentation #7 Fall’ 01 Kansas State University Department of Computing and Information Sciences