Inherited vs Selfmade Wealth Theory Evidence from a
")

 We propose a new theoretical definition of the share")


 Real estate assets")
 Real estate")
 Real estate")

- Slides: 27
Inherited vs Self-made Wealth Theory & Evidence from a Rentier Society (Paris 1872 -1937) Thomas Piketty, Gilles Postel-Vinay & Jean-Laurent Rosenthal Paris School of Economics February 2011
• Q. : What do we know about the relative importance of inherited wealth vs self-made wealth? • A. : Very little… • & very controversial: Kotlikoff-Summers JPE 1981: inherited wealth = 80% of total US wealth accumulation Modigliani AER 1986: inherited wealth = 20% of total US wealth accumulation… → This extreme confusion is due both to illdefined concepts (inadequate representative agent framework) and to bad data
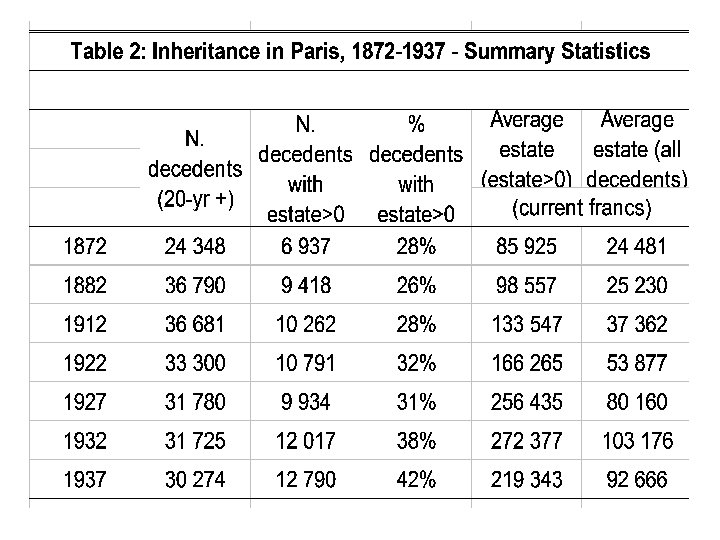
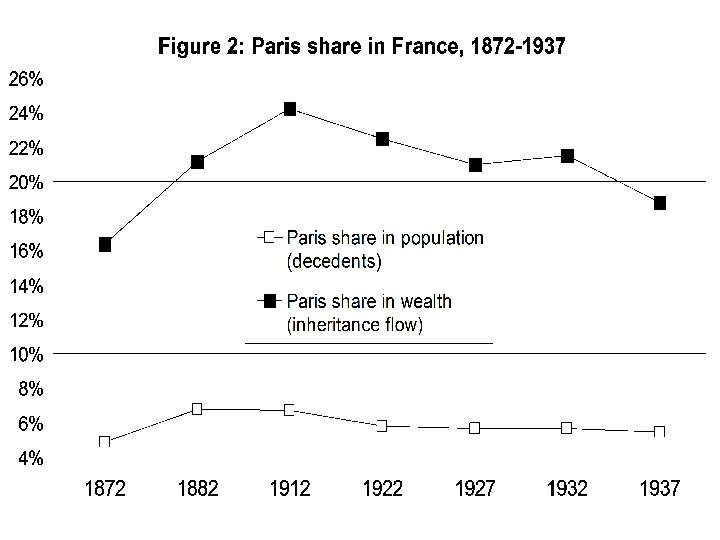
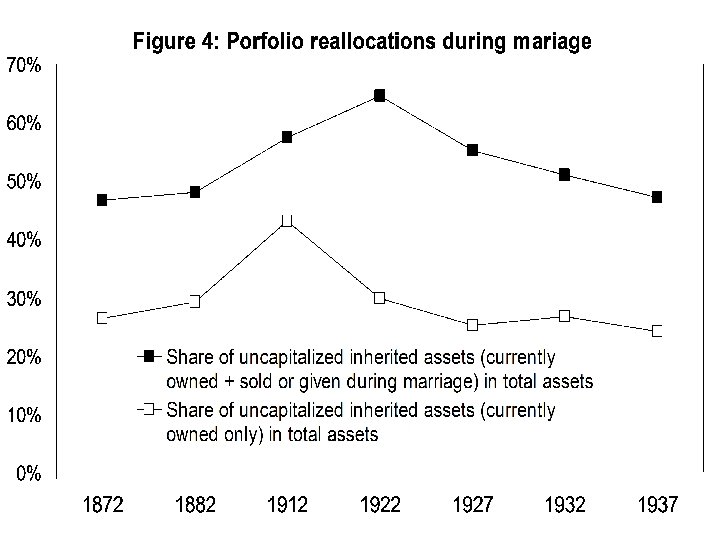
What this paper does (1) We propose a new theoretical definition of the share of inherited wealth in aggregate wealth, based upon the division of population into two groups : « inheritors » (or « rentiers » ) vs « savers » (or « self-made men » ). Straightforward, but completely different from standard, representative-agent definitions (2) We apply this definition to new data base on inheritance and matrimonial property regimes which we collected using individual estate tax records in Paris 1872 -1937
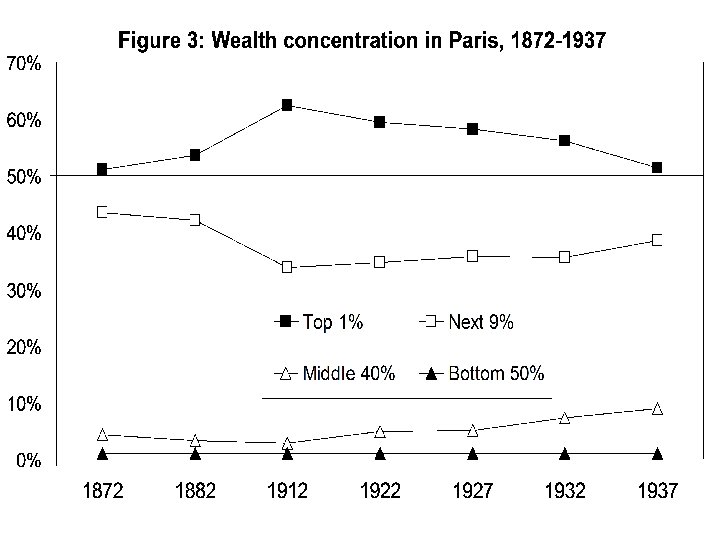
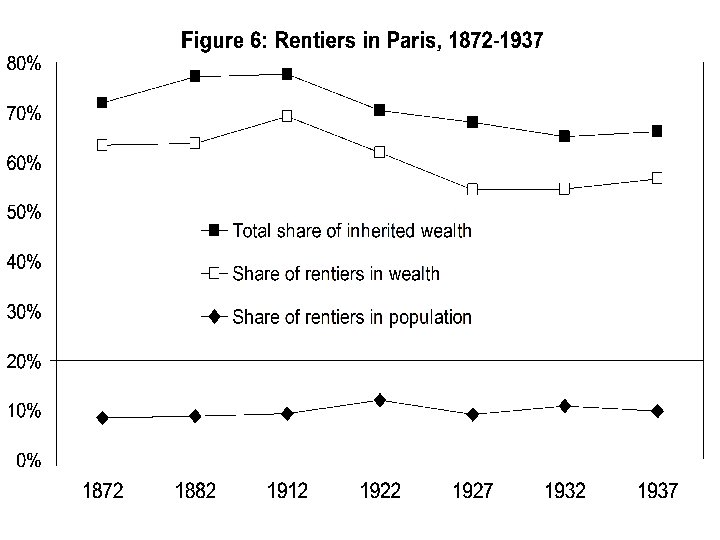
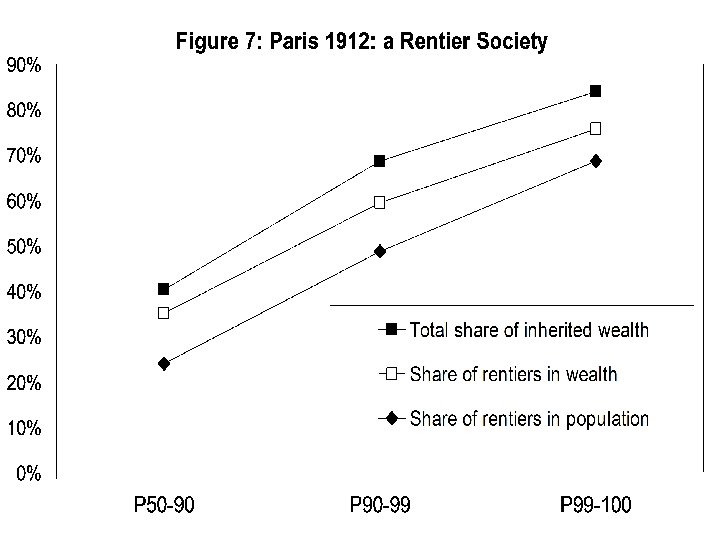
What we find • Paris 1872 -1937 = quintessence of a « rentier society » : top successors, by consuming the return to their inherited wealth, can sustain living standards which are very hard to attain via labor income • Rentiers: 10% of population, but 60%-70% of wealth • Total share of inherited wealth = 70%-80% • Rentiers = only 25% of « middle class » (wealth fractile P 50 -90), but 50% of « middle rich » (P 9099), & 70% of « very rich » (P 99 -100) • Even at the very top, we always find 25%-30% of self-made men. But they are a minority. Two very different groups. Representative agent models are inappropriate to study wealth accumulation.
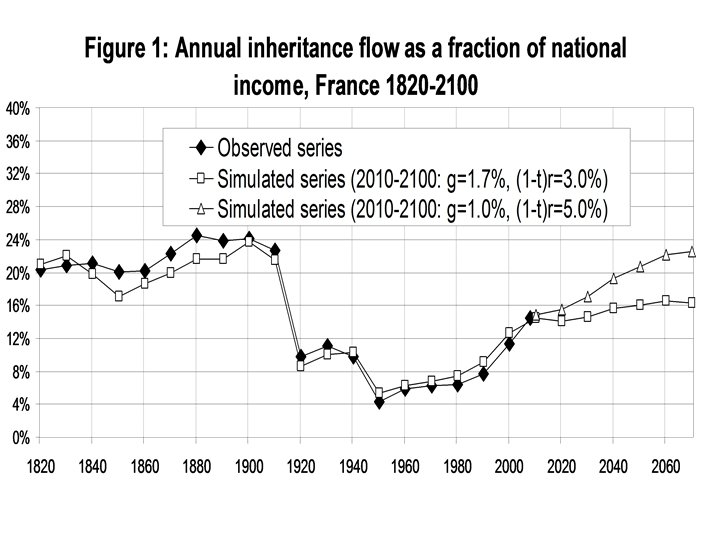
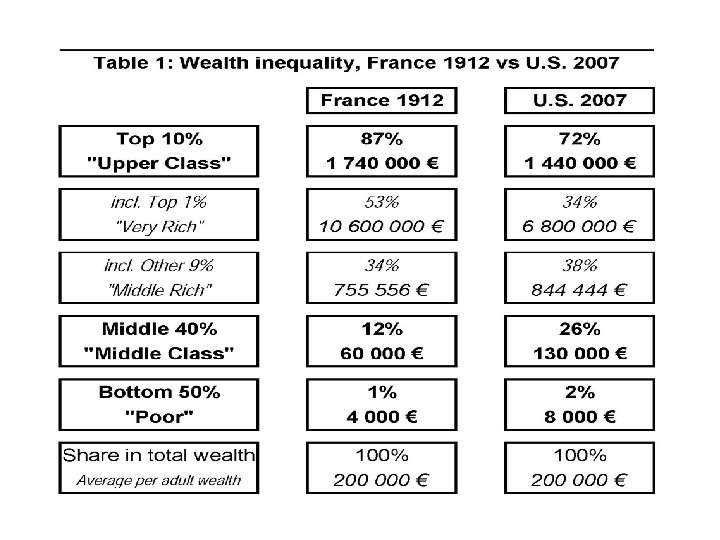
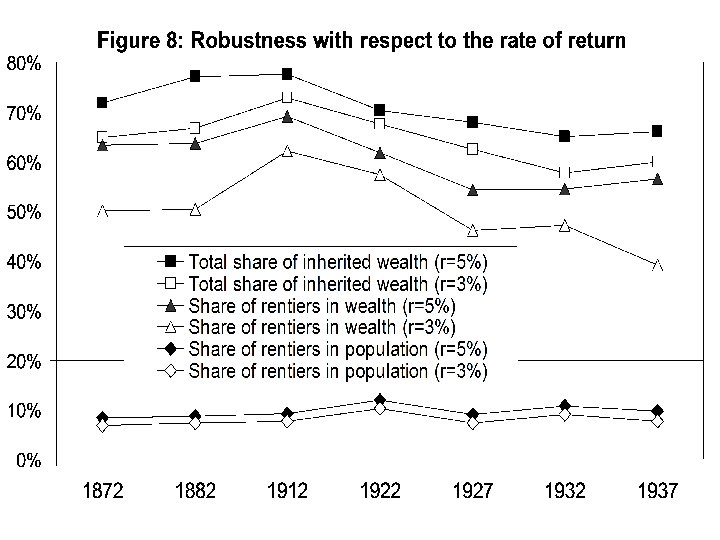
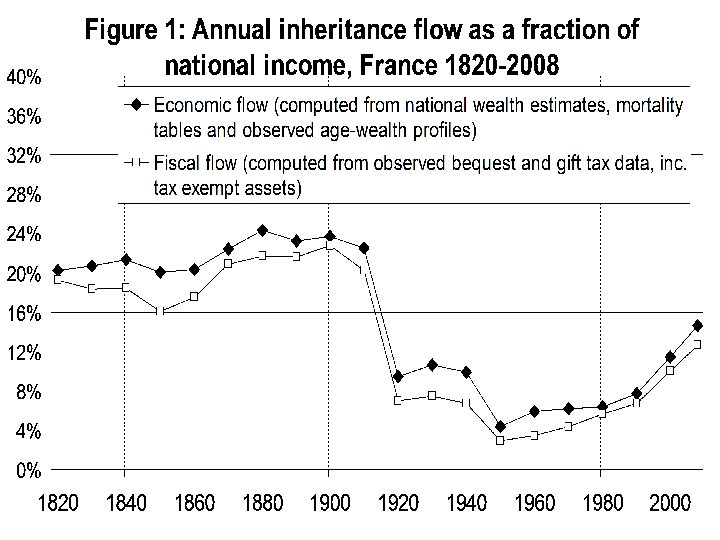
Do rentiers belong to the past? ● • - • No modern data source is as rich as our 1872 -1937 Paris data base; with modern data, we would probably find lower rentiers shares; but it is impossible to say at this stage One should not over-estimate how much the world has changed since 1900: Aggregate inheritance flows – as compared to aggregate income & wealth – will probably be as large in 21 C as in 19 C (r>g logic): see Piketty, « On the Long-Run Evolution of Inheritance – France 1820 -2050 » Wealth concentration did not decline all that much: top 10% share = 87% France 1912, 72% US 2007 (lower bound) In any case, critical point: these important issues need to be studied with proper concepts & data; wealth accumulation always involves 2 very different kinds of people (inheritors vs savers); representative-agent models are inappropriate
Theory 1: basic notations • Population = Nt , Aggregate private wealth = Wt • National income Yt=YLt+rt. Wt, where YLt = labor income, and rt = average rate of return on private wealth • wt=Wt/Nt = per capita wealth, y. Lt=YLt/Nt = per capita labor income, yt=y. Lt+rtwt = per capita national income • Consider a given individual i with wealth wti at time t. Assume he or she received bequest bti 0 at time ti<t. • Note bti* = bti 0 er(ti, t) the capitalized value of bti 0 at time t (where r(ti, t) is the cumulated rate of return between time ti and time t).
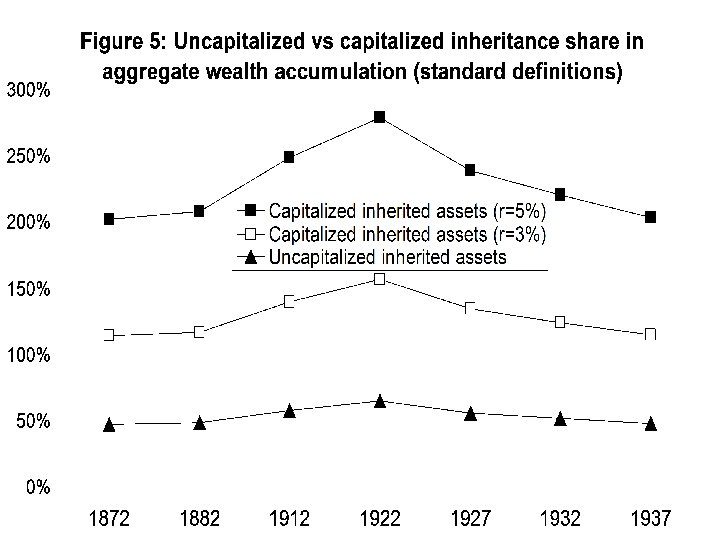
Theory 2: definitions • • Nt = Nt r + Nt s Ntr = “inheritors” (or “rentiers”) = {i s. t. wti<bti*} Nts = “savers” (or “self-made men”) = {i s. t. wti>bti*} By construction: during their lifetime, inheritors have consumed more than their labor income, while savers have consumed less than their labor income • Rentier share in population ρt =Ntr/Nt • Average rentiers wealth: wtr=E(wti | wti<bti*) • Average savers wealth: wts=E(wti | wti≥bti*) • Average capitalized bequests: btr*=E(bti* | wti<bti*) (rentiers) bts*=E(bti* | wti≥bti*) (savers) • Rentier share in wealth πt=ρtwtr/wt • Share of inherited wealth in aggregate wealth: φt = [ρtwtr + (1 -ρt)bts*]/wt = πt + (1 -ρt)bts*/wt
Exemple 1 • At age a=60, Mr Martin owns a Paris apartment worth 500, 000€ (net of outstanding mortgage liabilities), 100, 000€ in equities, another 300, 000€ in mutual funds. • At age I=30, he inherited 400, 000€ in life insurance assets from his parents, which he does not own any more. • So wti=900, 000€ and bti 0=400, 000€. With I=30, a=60 and r=4%, then er(a-I)=332% and bti*=1, 328, 000€ = 400, 000€ (capital value) + 928, 000€ (cumulated return). • That is, bti*>wti, i. e. according to our definitions Mr Martin is an “inheritor” (or a “rentier”): during his lifetime he consumed more than his labor income (what his labor income flows and portfolios choices might have been)
Exemple 2 • At age a=60, Mr Smith owns a small house worth 60, 000€ (net of outstanding mortgage liabilities), and 20, 000€ in various savings accounts. He inherited 10, 000€ from his parents at age I=30, which he spent when he contracted a loan to purchase his house. So wti=80, 000€, bi=10, 000€, and bti*=33, 000€. So we have bti*<wti. Mr Smith is a “saver”: over his lifetime he consumed less than his labor income • Now consider a hypothetical economy where 20% (ρt) of the population are inheritors like Mr Martin and 80% are savers like Mr Smith. Then inheritors’ share of aggregate wealth πt is ρtwtr/wt =74%, and the total share of inherited wealth in aggregate wealth is φt=πt+(1 -ρt)bts*/wt =85%.
Difference with standard definitions • Both Kotlikoff-Summers adopt a representative-agent framework: • Kotlikoff-Summers: φt. KS = bt*/wt • Modigliani: φt. M = bt/wt → Modigliani definition is artificially low (returns to wealth are basically ignored…), while Kotlikoff-Summers definition is artificially high (it can easily be larger than 100%, even in an economy with a significant fraction of savers and self-made wealth) → One needs to distinguish between two groups
Applying the definitions to a new data base on inheritance & wealth • Continuation of Piketty-Postel-Vinay. Rosenthal AER 2006, « Wealth Concentration in a Developping Economy: Paris & France 1807 -1994 » • Novelty: for 1872 -1937 we collected extra data on matrimonial regimes (community vs separate assets) → this allows to measure directly the share of inherited wealth (without matching two generations!)
Table 4: Asset composition in Paris 1872 -1937 (% gross assets) Real estate assets Financial assets inc. Equity inc. Private bonds inc. Govt bonds inc. Total Other, foreign Furnitures cash, . . assets 1872 34% 64% 17% 21% 15% 10% 7% 3% 1882 35% 63% 18% 21% 16% 9% 8% 2% 1912 36% 62% 20% 18% 14% 9% 20% 3% 1922 27% 69% 25% 13% 19% 11% 15% 4% 1927 23% 71% 37% 10% 13% 11% 20% 6% 1932 27% 66% 30% 11% 14% 11% 7% 1937 25% 69% 35% 10% 11% 12% 22% 7% Note: Out-of-Paris real estate assets are missing in 1872 -1882; in 1912 -1937, they make about 1/3 of real estate assets
Table 5: Community asset composition in Paris 1872 -1937 (% gross assets) Real estate assets inc. Financial inc. Private assets Equity bonds inc. Govt bonds inc. Total Other, foreign Furnitures cash, . . assets 1872 34% 63% 20% 11% 12% 5% 3% 1882 31% 66% 24% 19% 12% 11% 6% 3% 1912 29% 68% 27% 14% 11% 21% 3% 1922 17% 78% 30% 14% 22% 13% 5% 1927 12% 81% 46% 10% 13% 12% 24% 7% 1932 16% 77% 35% 12% 15% 11% 8% 1937 15% 76% 42% 11% 12% 20% 9% Note: Out-of-Paris real estate assets are missing in 1872 -1882; in 1912 -1937, they make about 1/3 of real estate assets
Table 6: Inherited asset composition in Paris 1872 -1937 (% gross assets) Real estate assets Financial assets inc. Equity inc. Private bonds inc. Govt bonds inc. Total Other, foreign Furnitures cash, . . assets 1872 43% 56% 14% 18% 16% 8% 8% 1% 1882 43% 55% 18% 15% 8% 6% 2% 1912 45% 54% 17% 16% 10% 9% 11% 1% 1922 33% 63% 24% 11% 17% 11% 4% 1927 32% 63% 34% 8% 9% 13% 15% 4% 1932 39% 57% 29% 8% 11% 8% 12% 3% 1937 43% 53% 28% 9% 8% 8% 14% 4% Note: Out-of-Paris real estate assets are missing in 1872 -1882; in 1912 -1937, they make about 1/3 of real estate assets
What have we learned? • The wealth accumulation process always involves 2 very different kinds of people: inheritors vs savers • Our new definition of the share of inherited wealth in aggregate wealth is more appropriate than the standard representative-agent definition • In order to properly analyze capital accumulation, macroeconomics needs to go beyond representative agent models… • …& beyond infinite horizon models with idyosincratic shocks, which are inappropriate to study inherited vs self-made wealth → one needs to model explicitly the existence of different, unequal social groups with finite horizon