How sinusoidal wave form create 1 Waveform The


- Slides: 7
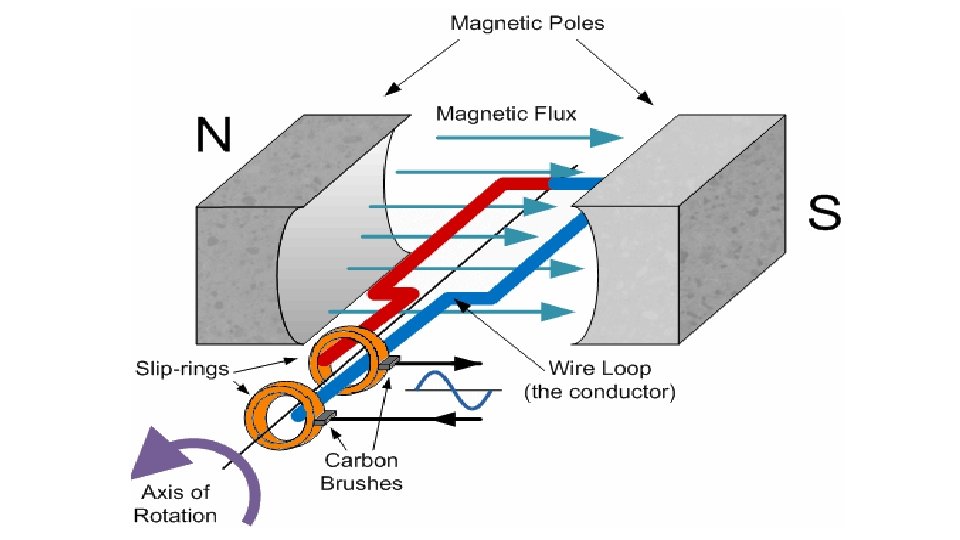
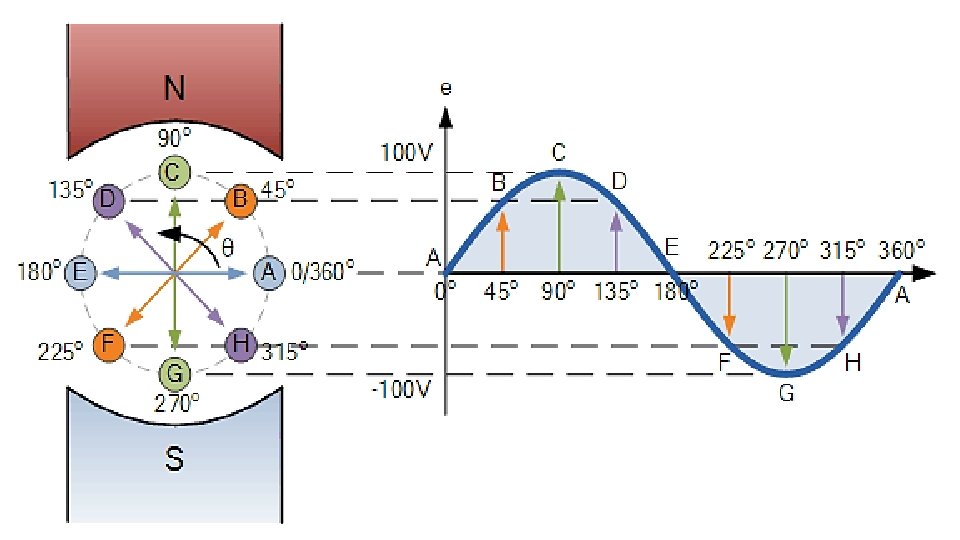
How sinusoidal wave form create
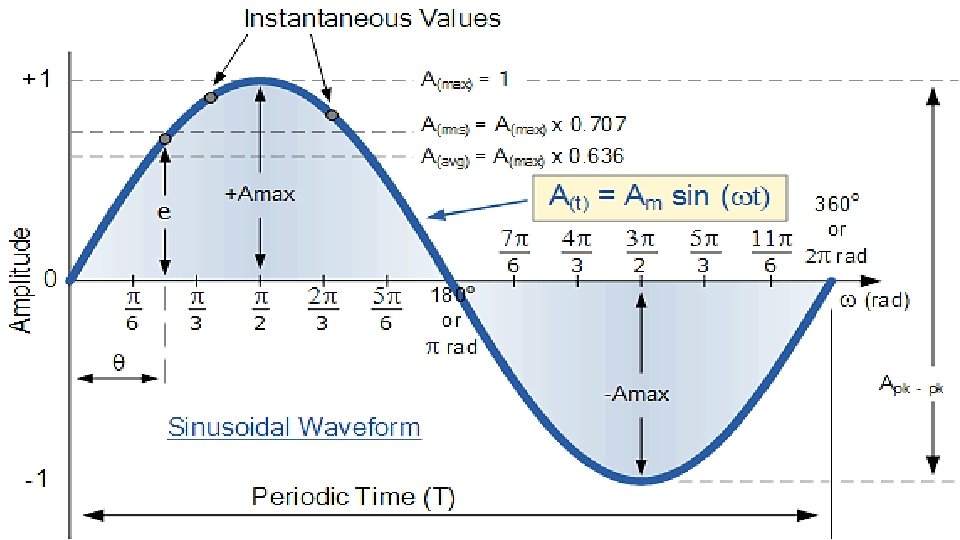
1. Waveform: The path traced by a quantity, such as the voltage in Fig. 13. 3, plotted as a function of some variable such as time (as above), position, degrees, radians, temperature, and so on 2. Instantaneous value: The magnitude of a waveform at any instant of time; denoted by lowercase letters (e 1, e 2). 3. Peak amplitude: The maximum value of a waveform as measured from its average, or mean, value, denoted by uppercase letters (such as Em for sources of voltage and Vm for the voltage drop across a load). For the waveform of Fig. 13. 3, the average value is zero volts and Em is as defined by the figure. 4. Peak value: The maximum instantaneous value of a function as measured from the zero-volt level. For the waveform of Fig. 13. 3, the peak amplitude and peak value are the same, since the average value of the function is zero volts. 5. Peak-to-peak value: Denoted by Ep-p or Vp-p, the full voltage between positive and negative peaks of the waveform, that is, the sum of the magnitude of the positive and negative peaks. 6. Periodic waveform: A waveform that continually repeats itself after the same time interval. The waveform of Fig. 13. 3 is a periodic waveform. 7. Period (T ): The time interval between successive repetitions of a periodic waveform (the period T 1 T 2 T 3 in Fig. 13. 3), as long as successive similar points of the periodic waveform are used in deter- mining T. 8. Cycle: The portion of a waveform contained in one period of time. The cycles within T 1, T 2, and T 3 of Fig. 13. 3 may appear different in Fig. 13. 4, but they are all bounded by one period of time and there- fore satisfy the definition of a cycle.