Historical Institutionalism Agendas and Crime an analysis of



- Slides: 28
Historical Institutionalism, Agendas and Crime: an analysis of the politics of crime since 1979 Stephen Farrall, Will Jennings, Emily Gray and Colin Hay BSC 2014
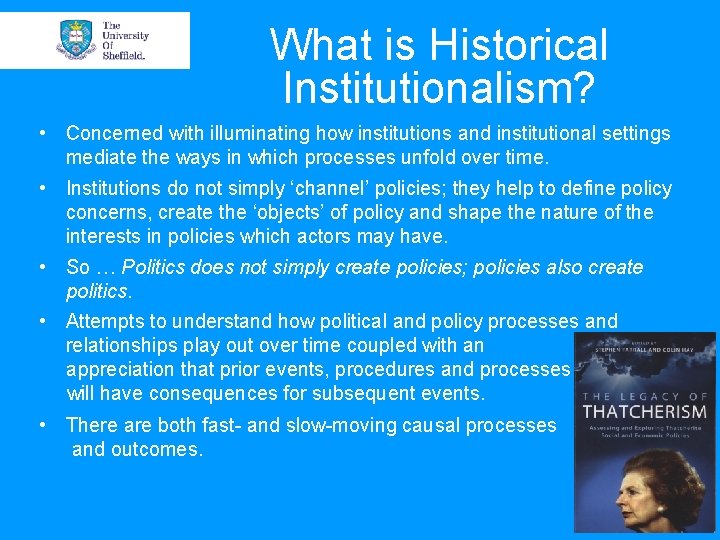
What is Historical Institutionalism? • Concerned with illuminating how institutions and institutional settings mediate the ways in which processes unfold over time. • Institutions do not simply ‘channel’ policies; they help to define policy concerns, create the ‘objects’ of policy and shape the nature of the interests in policies which actors may have. • So … Politics does not simply create policies; policies also create politics. • Attempts to understand how political and policy processes and relationships play out over time coupled with an appreciation that prior events, procedures and processes will have consequences for subsequent events. • There are both fast- and slow-moving causal processes and outcomes.
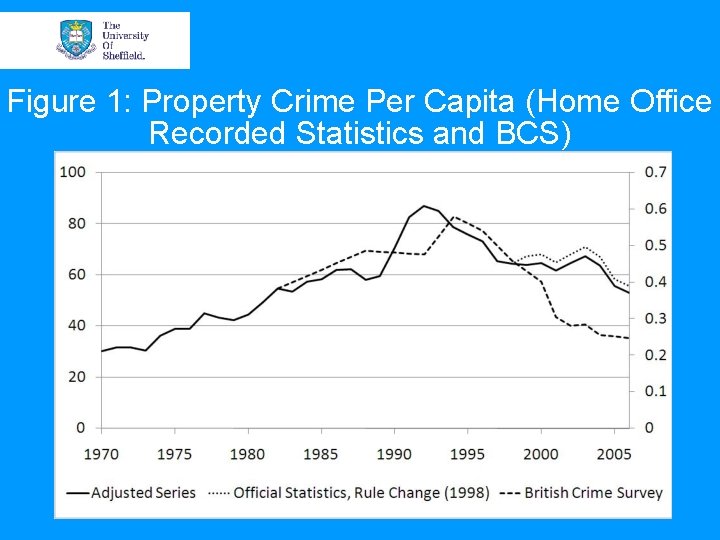
Figure 1: Property Crime Per Capita (Home Office Recorded Statistics and BCS)
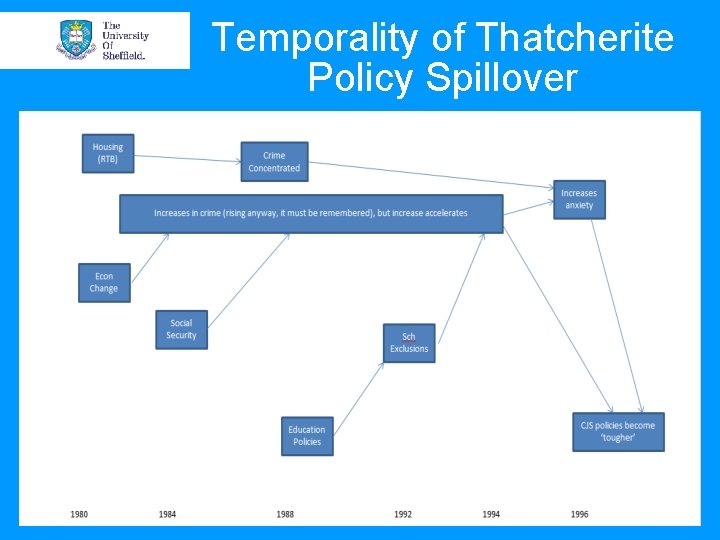
In which ways might this be a legacy of ‘Thatcherite’ policies? • Economic change • Changes in the housing market • Changes in social security provision • Changes in education policies (esp. after 1988)
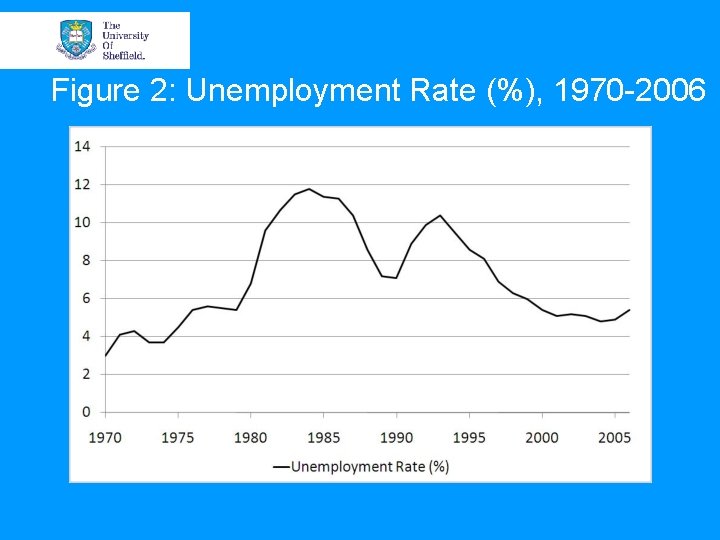
Economic Changes • During the 1970 s there was a move away from the commitment to Keynesian policies and full employment. • Dramatic economic restructuring overseen by Thatcher governments. • Consequently, levels of unemployment rose through the 1980 s (see Fig 2).
Figure 2: Unemployment Rate (%), 1970 -2006
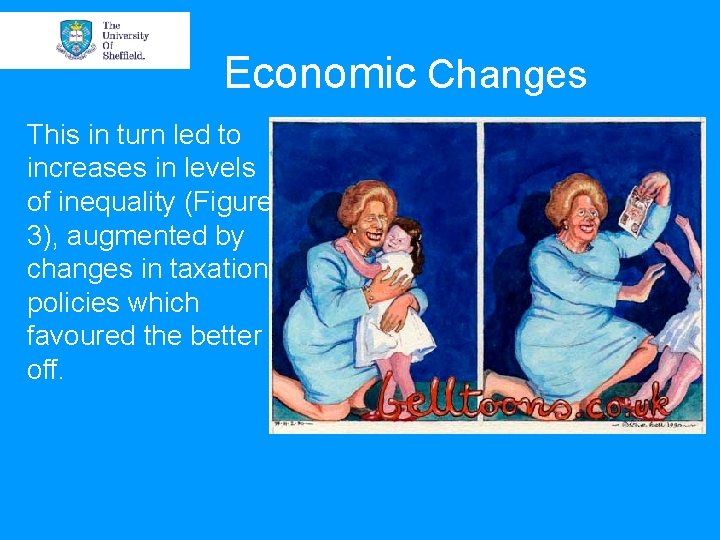
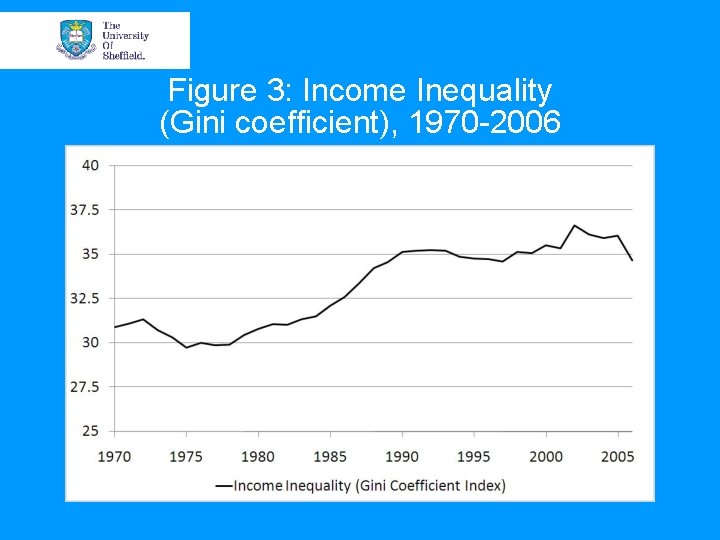
Economic Changes This in turn led to increases in levels of inequality (Figure 3), augmented by changes in taxation policies which favoured the better off.
Figure 3: Income Inequality (Gini coefficient), 1970 -2006
The Economy and Crime in Post -War Britain • Using time series analyses for 1961 -2006 Jennings et al (2012) find statistically significant relationships for: 1: the unemployment rate on the rate of property crime (consistent with other studies), 2: we also find that the crime-economy link strengthened during this period. 3: (economic inequality just outside bounds of significance).
Housing Policy • 1980 Housing Act (+ others): created RTB – saw a huge rise in owner-occupation. • Held to have created residualisation of council housing; transient/marginalised residents with low levels of employment. • Contributed to increases in inequality (Ginsberg, 1989) and concentration of crime (Murie, 1997).
Social Security • 1980 -1985: Some tinkering with the DHSS. • 1986 Social Security Act based on Fowler Review. • Following this payments reduced for many individual benefits claimants (whilst total spend increased due to unemployment).
Social Security • Evidence to suggest that reductions in government expenditure associated with rises in crime during the 1980 s (Reilly and Witt, 1992). • Jennings et al (2012) suggest that increases in welfare spending is associated with declines in the property crime rate.
Education • Changes in education policies encouraged schools to exclude children in order to improve place in league tables. • Exclusions rose during the 1990 s, reaching a peak of 12, 668 in 1996 -97.
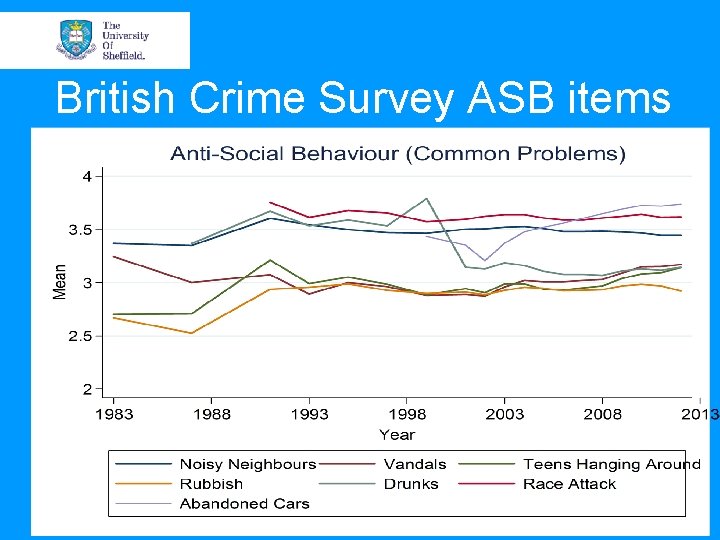
Education • Dumped on the streets this fuelled ASB (Home Office RDS Occ. Paper No. 71). • The BCS 1992 -2006 shows sudden jump of people reporting “teens hanging around” to be a problem from an average of 8% before 2001 to 30% after 2002. • School exclusions helped to create Labour’s discourse of ASB and need for C&DA 1998.
British Crime Survey ASB items
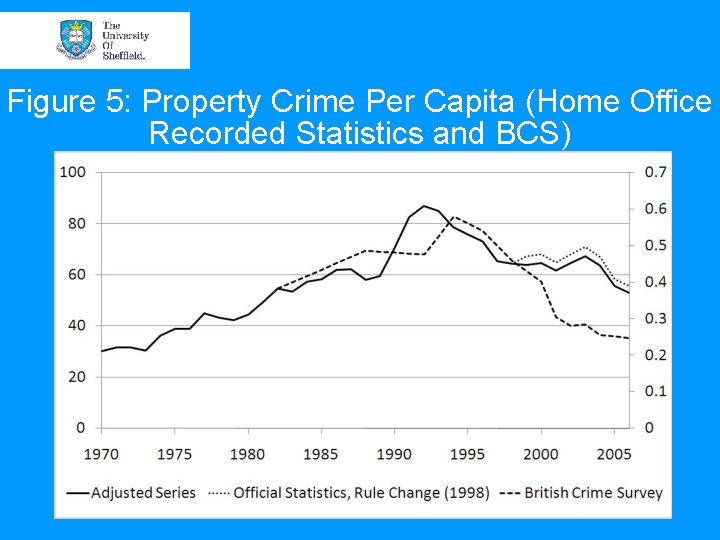
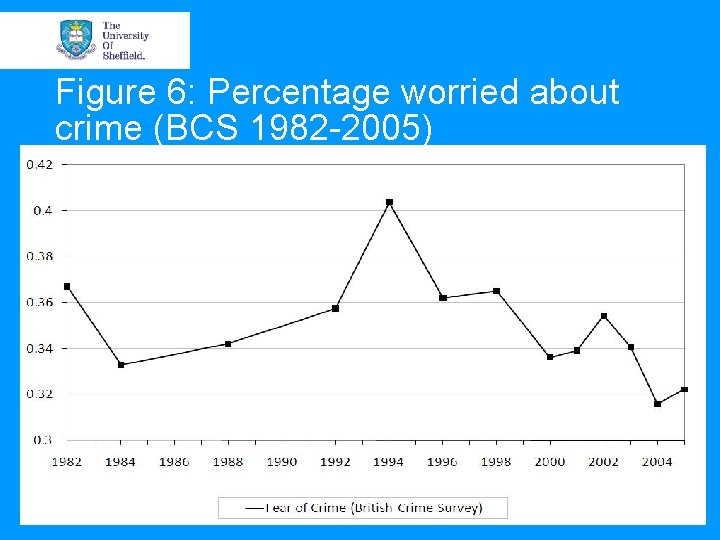
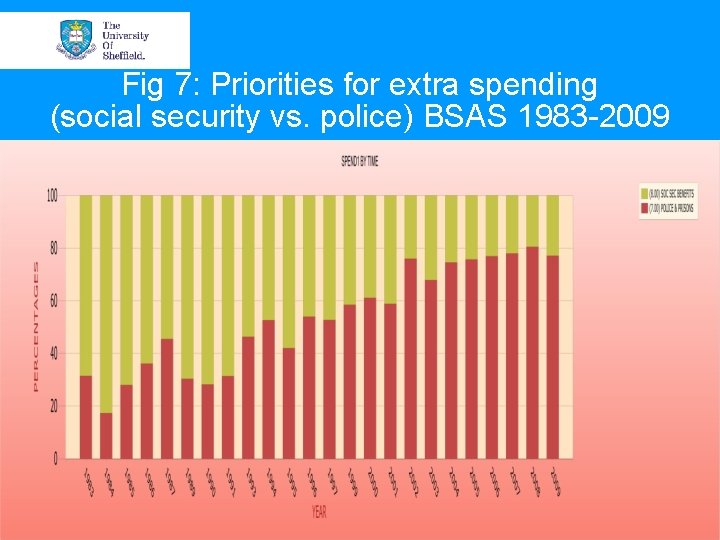
What happened to crime (etc)? • Rise in crime (Fig 5). This was generally rising before 1979, but the rate of increase picked up after early 1980 s and again in early 1990 s. • Fear of crime rises (tracks crime rates, Fig 6). • People want to see an increase in spending on the police/prisons (with decrease of spending on social security, Fig 7).
Figure 5: Property Crime Per Capita (Home Office Recorded Statistics and BCS)
Figure 6: Percentage worried about crime (BCS 1982 -2005)
Fig 7: Priorities for extra spending (social security vs. police) BSAS 1983 -2009
Temporality of Thatcherite Policy Spillover
Developments post-1993: • Howard (Home Sec 1993 -97) talks tough on crime. • Prison population rises immediately (Newburn 2007). • Rise in average sentences: Riddell 1989: 170; Newburn 2007: 442 -4. • Trend continued, appears due to tough sentences and stricter enforcement. Mo. J 2009: 2 -3 cites mandatory minimum sentences (aimed at burglars and drug traffickers) as a cause. • Prison population grew by 2. 5% p. a. from 1945 to 1995, but by 3. 8% p. a. 1995 -2009 (Mo. J, 2009: 4).
Labour Party’s Response • Move to the political right. • ‘Tough on crime, tough on the causes of crime’. • Focus on ‘young offenders’ (Sch Exclusions related to? ). • Did not oppose Crime (Sentences) Act 1997 despite it being quite draconian (‘ 3 strikes’, minimum mandatory sentences).
Labour In Government Needed to do something about crime because … a) it actually was a problem (peak was in 1994) but still a source of public concern b) they needed to be seen to be doing something to avoid being accused of having ‘gone soft on crime again’.
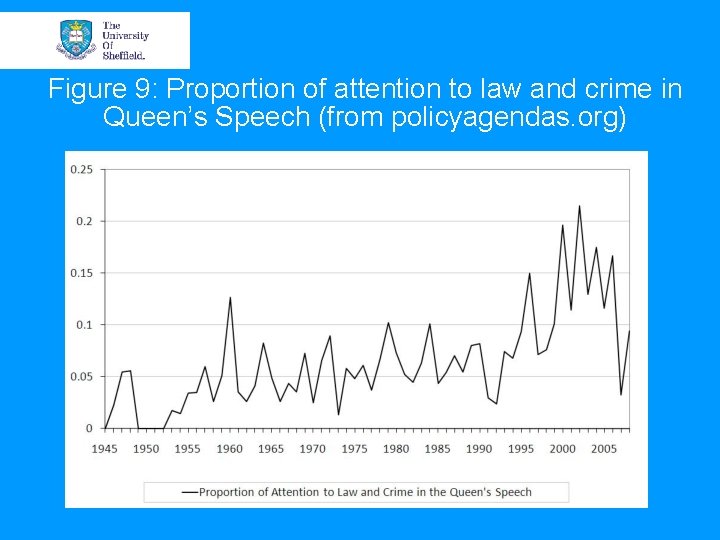
What have Govts done? • They devote more time to crime in it’s expressed policy agenda (Fig 9). • Little sustained interest in crime until 60 s (2%). • After 1979 GE rises to 8%. • Big jump again in 1996 (15%). • Thereafter runs at or near to 20%.
Figure 9: Proportion of attention to law and crime in Queen’s Speech (from policyagendas. org)
What have Govts done? • Farrall and Jennings report statistically significant relationships for: 1: national crime rate on Govt attention on crime in Queen’s Speeches, and, 2: effects of public opinion on Govt. attention on crime in Queen’s Speeches. • So the Govt responds to crime rates and expressions of public concern about crime.
Future Work • ESRC funded project using BCS, BSAS, GHS, LFS etc. to explore trends using selfreport data (and at the regional level). 201315. • Time series models the main approach. • Age-period-cohort analyses to explore ‘Thatcher’s Children’. • Shef. ac. uk/law/research/projects/crimetrajectories • Twitter. com/Thatcher_legacy
Further Info/Readings Farrall, S. and Hay, C. (2010) Not So Tough on Crime? Why Weren’t the Thatcher Governments More Radical In Reforming the Criminal Justice System? British Journal of Criminology, 50(3): 550 -69. Farrall, S. and Jennings, W. (2012) Policy Feedback and the Criminal Justice Agenda: an analysis of the economy, crime rates, politics and public opinion in post-war Britain, Contemporary British History, 26(4): 467 -488. Farrall, S. and Jennings, W. (2014) Thatcherism and Crime: The Beast that Never Roared? , in Farrall S. , and Hay, C. Thatcher’s Legacy: Exploring and Theorising the Long-term Consequencies of Thatcherite Social and Economic Policies, Oxford University Press, Oxford, pp 207 -233. Farrall, S. and Hay, C. (2014) Locating ‘Thatcherism’ In The ‘Here and Now’, in Farrall S. , and Hay, C. Thatcher’s Legacy: Exploring and Theorising the Long-term Consequencies of Thatcherite Social and Economic Policies, Oxford University Press, Oxford, pp 315 -339. Farrall, S. , Gray, E. , Jennings, W. Hay, C. (2014) Using Ideas Derived from Historical Institutionalism to Illuminate the Long-term Impacts on Crime of ‘Thatcherite’ Social and Economic Policies: A Working Paper. Hay, C. and Farrall, S. (2014) Interrogating and Conceptualising the Legacy of Thatcherism, in Farrall S. , and Hay, C. Thatcher’s Legacy: Exploring and Theorising the Long-term Consequencies of Thatcherite Social and Economic Policies, Oxford University Press, Oxford, pp 3 -30. Hay, C. and Farrall, S. (2011) Establishing the ontological status of Thatcherism by gauging its ‘periodisability’: towards a ‘cascade theory’ of public policy radicalism, British Journal of Politics and International Relations, 13(4): 439 -58. Jennings, W. , Farrall, S. and Bevan, S. (2012) The Economy, Crime and Time: an analysis of recorded property crime in England & Wales 1961 -2006, International Journal of Law, Crime and Justice, 40(3): 192210.