Health care decision making Dr Giampiero Favato presented

- Slides: 30
Health care decision making Dr. Giampiero Favato presented at the University Program in Health Economics Ragusa, 26 -28 June 2008
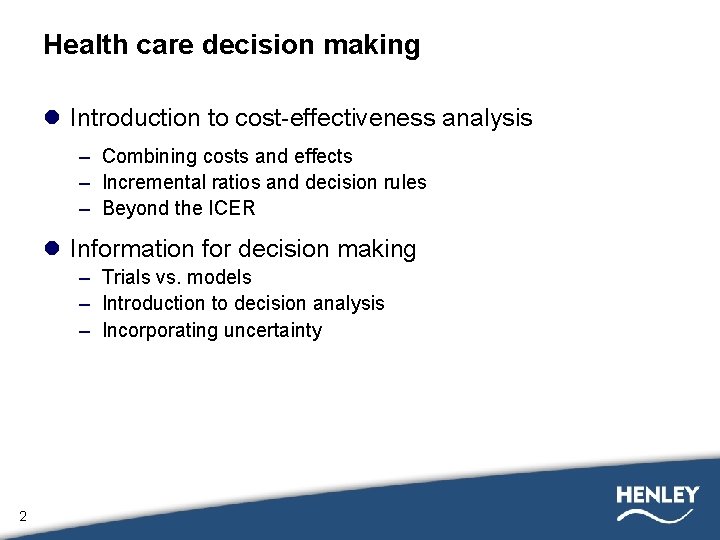
Health care decision making l Introduction to cost-effectiveness analysis – Combining costs and effects – Incremental ratios and decision rules – Beyond the ICER l Information for decision making – Trials vs. models – Introduction to decision analysis – Incorporating uncertainty 2
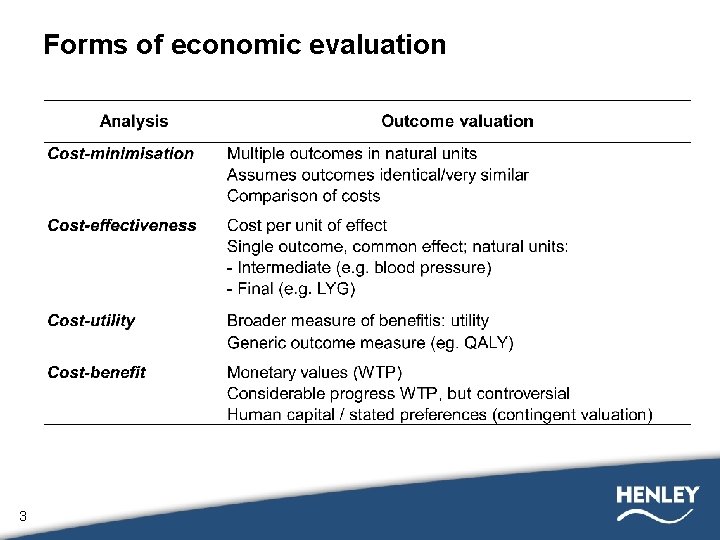
Forms of economic evaluation 3
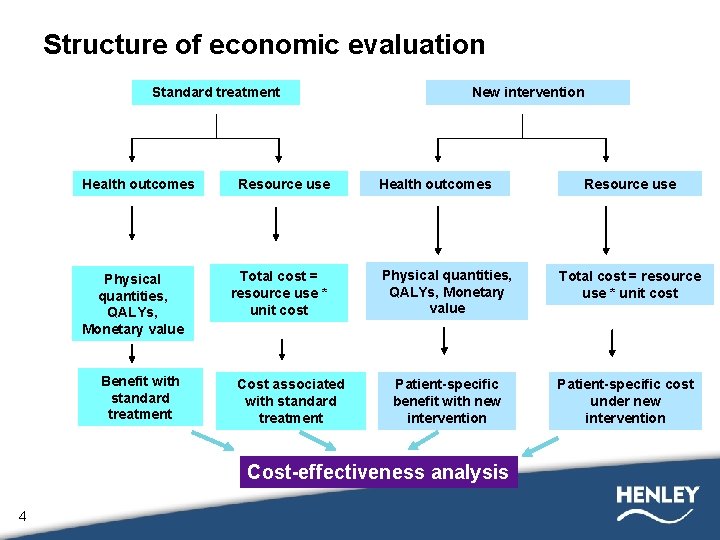
Structure of economic evaluation Standard treatment Health outcomes Physical quantities, QALYs, Monetary value Benefit with standard treatment Resource use Total cost = resource use * unit cost Cost associated with standard treatment New intervention Health outcomes Physical quantities, QALYs, Monetary value Patient-specific benefit with new intervention Cost-effectiveness analysis 4 Resource use Total cost = resource use * unit cost Patient-specific cost under new intervention
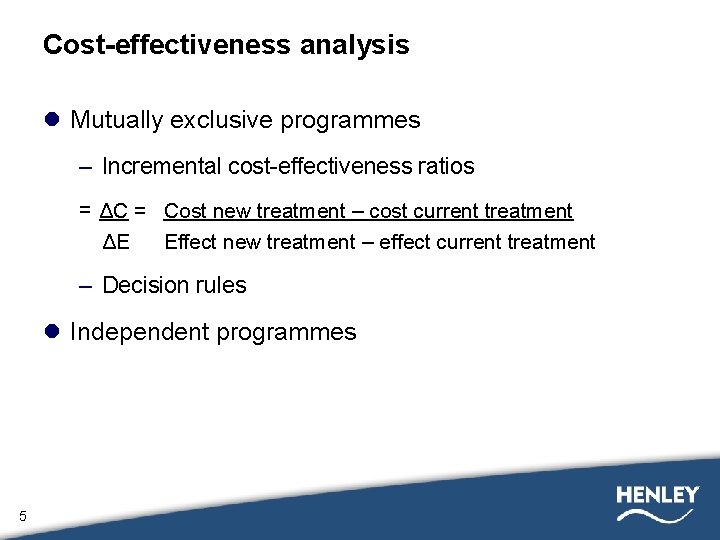
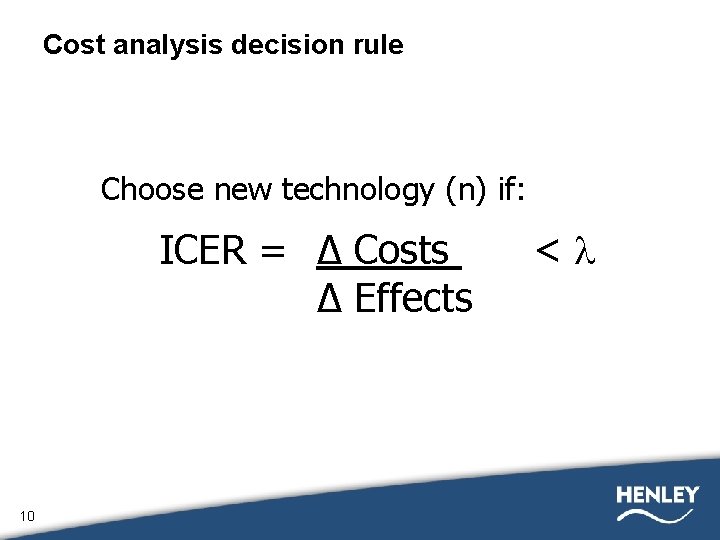
Cost-effectiveness analysis l Mutually exclusive programmes – Incremental cost-effectiveness ratios = ΔC = Cost new treatment – cost current treatment ΔE Effect new treatment – effect current treatment – Decision rules l Independent programmes 5
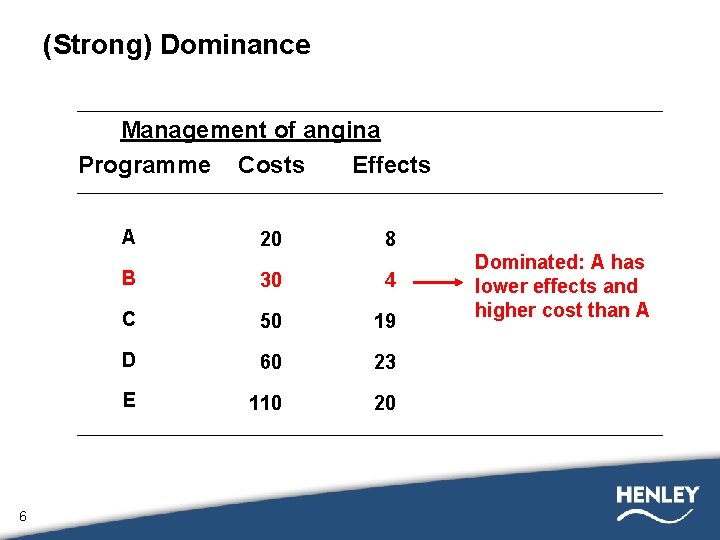
(Strong) Dominance Management of angina Programme Costs Effects A 6 20 8 B 30 4 C 50 19 D 60 23 E 110 20 Dominated: A has lower effects and higher cost than A
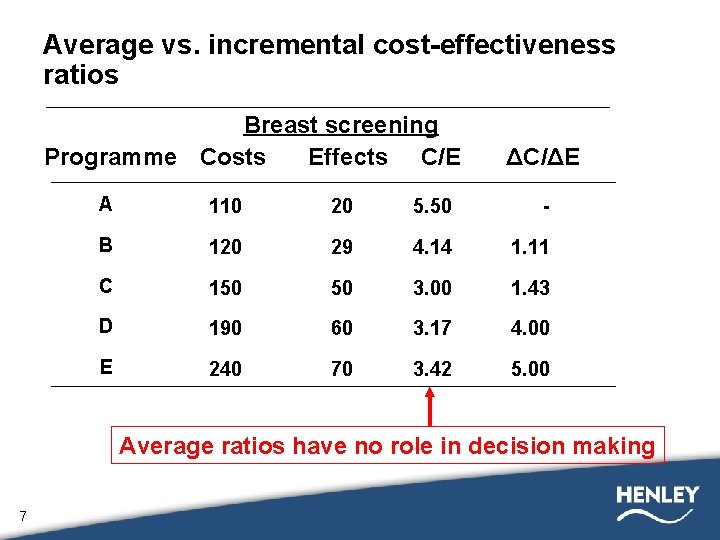
Average vs. incremental cost-effectiveness ratios Breast screening Programme Costs Effects C/E ΔC/ΔE A 110 20 5. 50 - B 120 29 4. 14 1. 11 C 150 50 3. 00 1. 43 D 190 60 3. 17 4. 00 E 240 70 3. 42 5. 00 Average ratios have no role in decision making 7
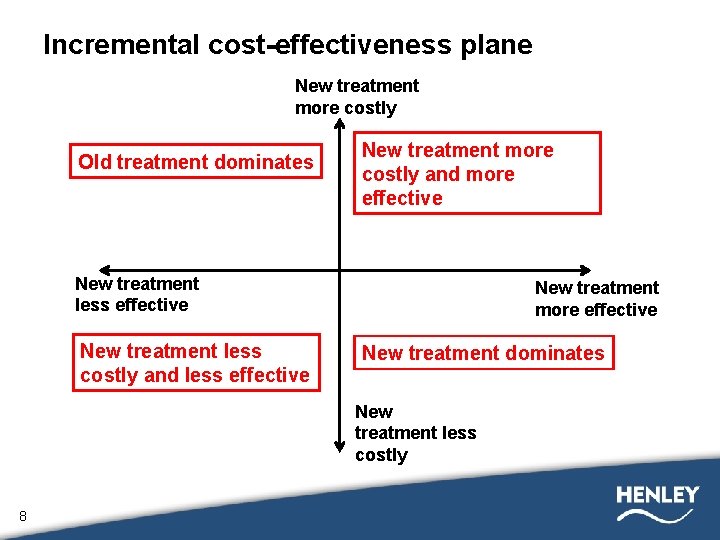
Incremental cost-effectiveness plane New treatment more costly Old treatment dominates New treatment more costly and more effective New treatment less costly and less effective New treatment more effective New treatment dominates New treatment less costly 8
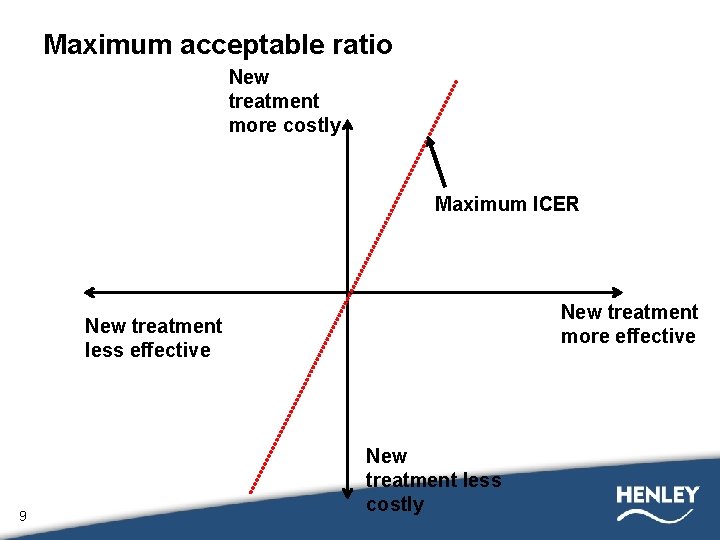
Maximum acceptable ratio New treatment more costly Maximum ICER New treatment more effective New treatment less effective 9 New treatment less costly
Cost analysis decision rule Choose new technology (n) if: ICER = Δ Costs Δ Effects 10 <l
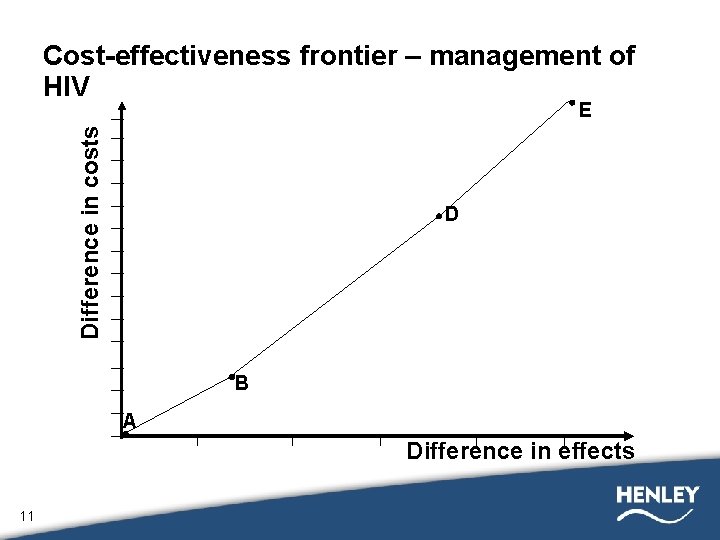
Cost-effectiveness frontier – management of HIV Difference in costs E D B A Difference in effects 11
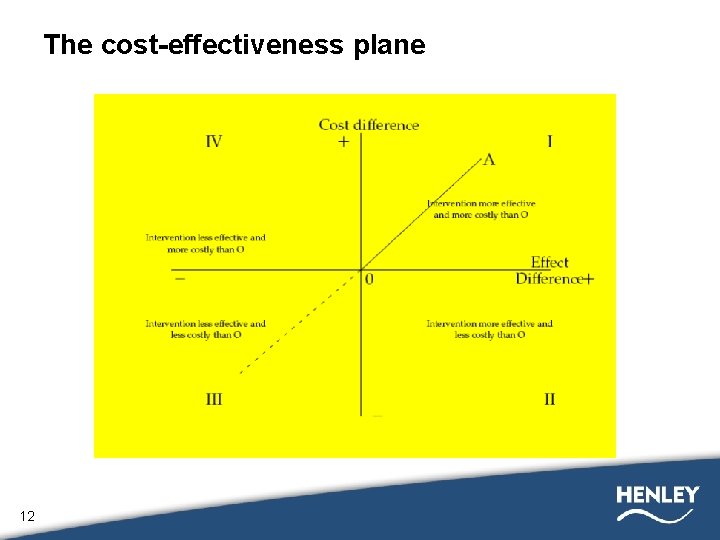
The cost-effectiveness plane 12
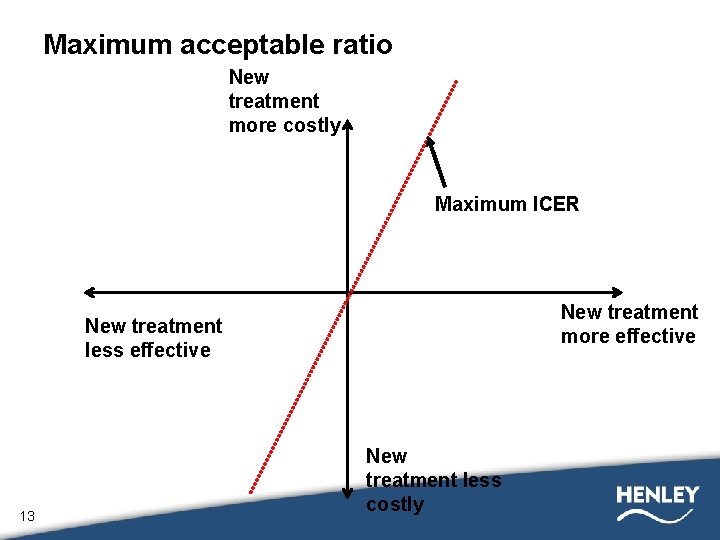
Maximum acceptable ratio New treatment more costly Maximum ICER New treatment more effective New treatment less effective 13 New treatment less costly
Maximum acceptable ratio l When intervention more/less costly and more/less effective than comparator, cannot determine whether cost-effective unless use data from outside study l maximum acceptable ratio – Set by budget constraint – Set by maximum willingness to pay per unit of effect • Administrative ‘rule of thumb’ • Empirically based 14
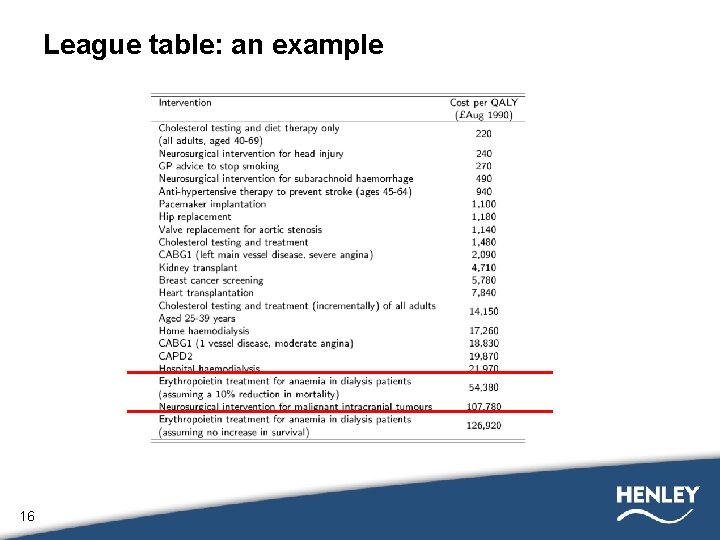
Cost effectiveness league tables l In recent years it has become fashionable to compare health care interventions in terms of their relative cost-effectiveness (incremental cost per life-year or cost per quality-adjusted lifeyear gained). l There are two, quite distinct, motivations behind the league table approach: 1. Analysts undertaking an evaluation of a particular health treatment or programme often seek, quite appropriately, to place their findings in a broader context. 2. Some analysts seek to inform decisions about the allocation of health care resources between alternative programmes. Most of the criticisms of league tables are directed at the second of these two potential motivations. 15
League table: an example 16
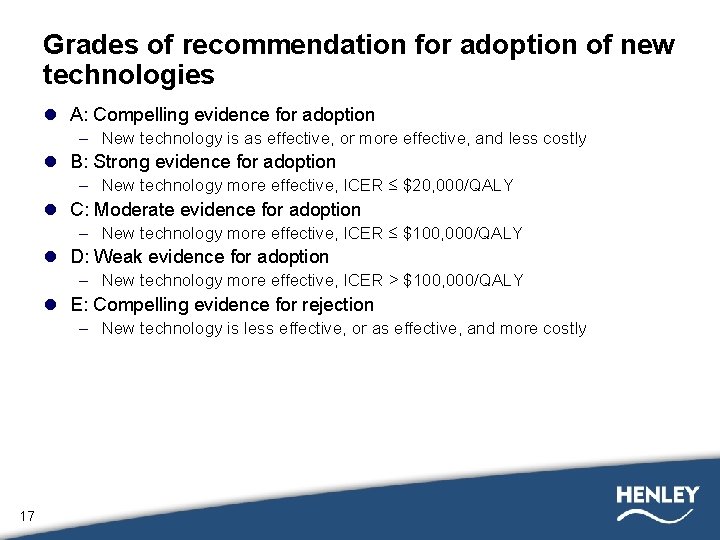
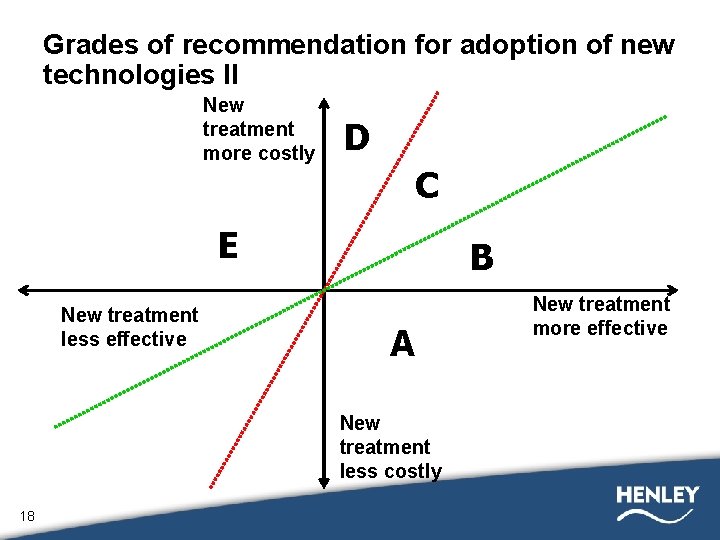
Grades of recommendation for adoption of new technologies l A: Compelling evidence for adoption – New technology is as effective, or more effective, and less costly l B: Strong evidence for adoption – New technology more effective, ICER ≤ $20, 000/QALY l C: Moderate evidence for adoption – New technology more effective, ICER ≤ $100, 000/QALY l D: Weak evidence for adoption – New technology more effective, ICER > $100, 000/QALY l E: Compelling evidence for rejection – New technology is less effective, or as effective, and more costly 17
Grades of recommendation for adoption of new technologies II New treatment more costly D C E New treatment less effective B A New treatment less costly 18 New treatment more effective
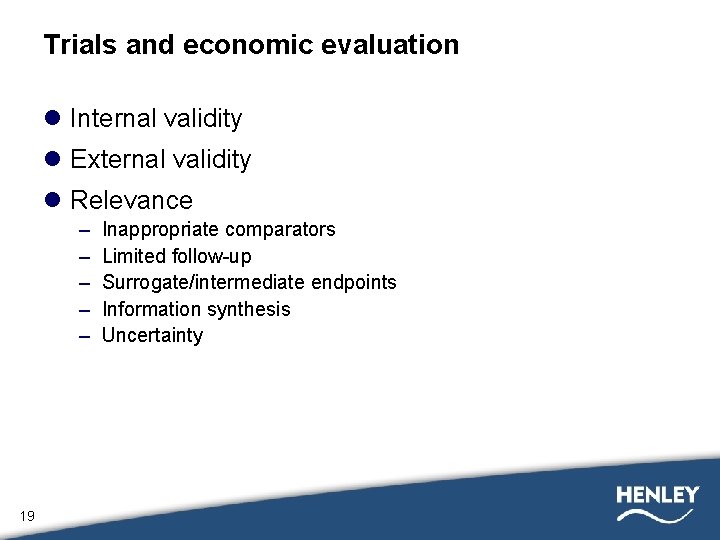
Trials and economic evaluation l Internal validity l External validity l Relevance – – – 19 Inappropriate comparators Limited follow-up Surrogate/intermediate endpoints Information synthesis Uncertainty
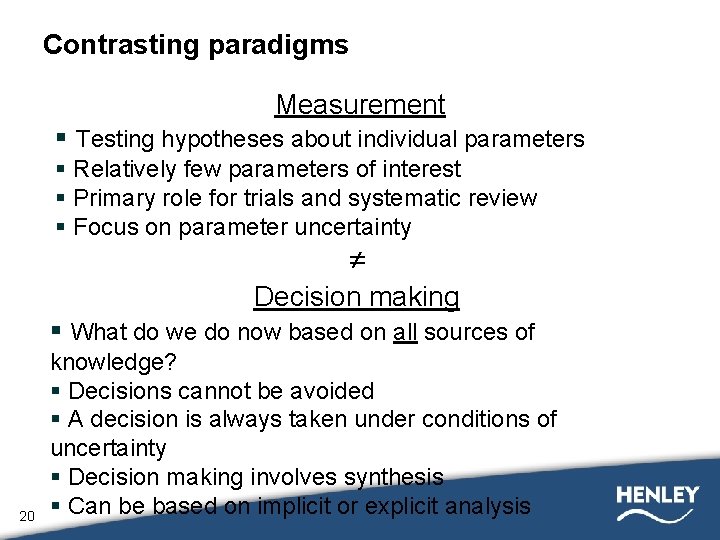
Contrasting paradigms Measurement § Testing hypotheses about individual parameters § Relatively few parameters of interest § Primary role for trials and systematic review § Focus on parameter uncertainty Decision making § What do we do now based on all sources of 20 knowledge? § Decisions cannot be avoided § A decision is always taken under conditions of uncertainty § Decision making involves synthesis § Can be based on implicit or explicit analysis
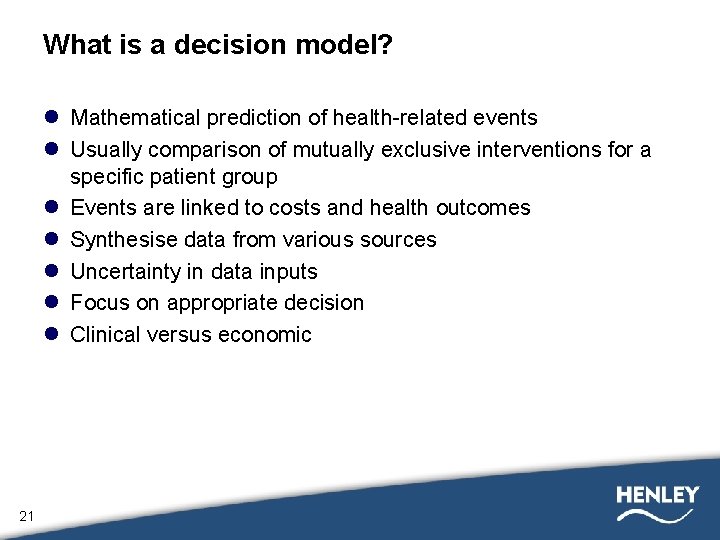
What is a decision model? l Mathematical prediction of health-related events l Usually comparison of mutually exclusive interventions for a specific patient group l Events are linked to costs and health outcomes l Synthesise data from various sources l Uncertainty in data inputs l Focus on appropriate decision l Clinical versus economic 21
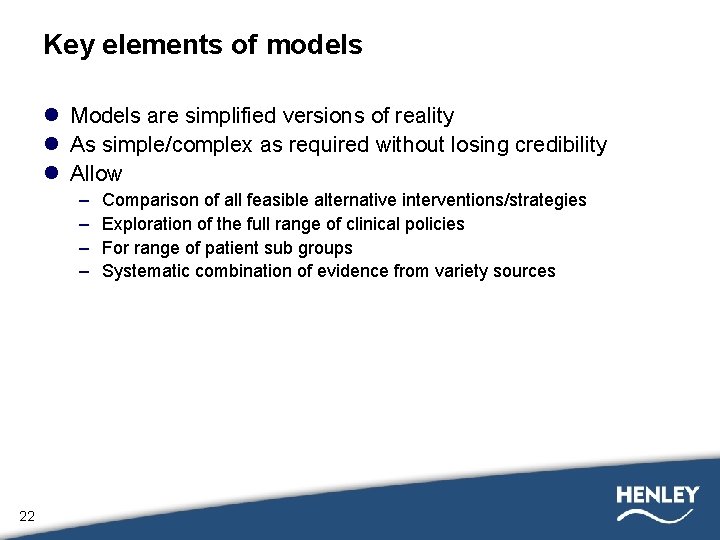
Key elements of models l Models are simplified versions of reality l As simple/complex as required without losing credibility l Allow – – 22 Comparison of all feasible alternative interventions/strategies Exploration of the full range of clinical policies For range of patient sub groups Systematic combination of evidence from variety sources
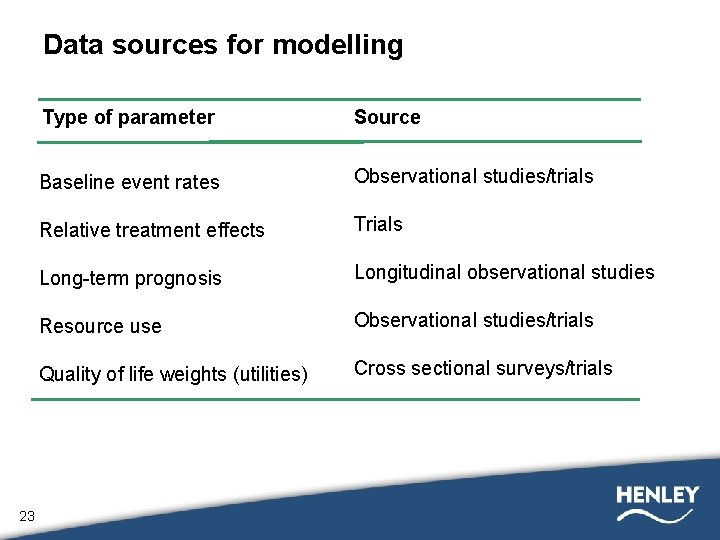
Data sources for modelling 23 Type of parameter Source Baseline event rates Observational studies/trials Relative treatment effects Trials Long-term prognosis Longitudinal observational studies Resource use Observational studies/trials Quality of life weights (utilities) Cross sectional surveys/trials
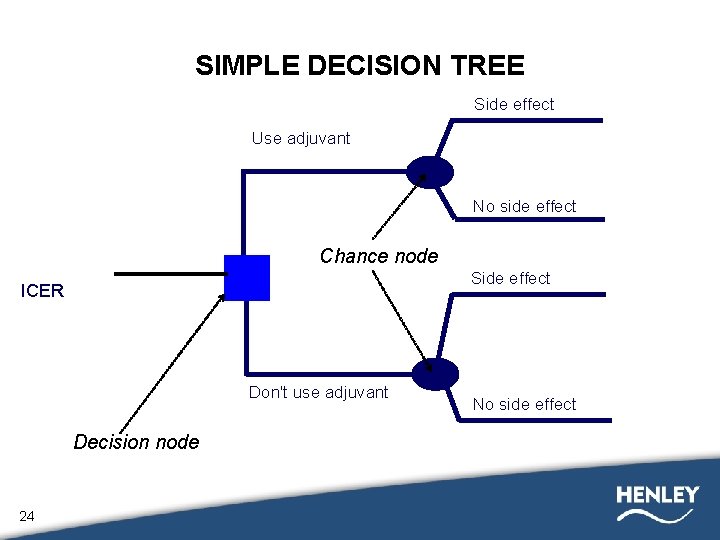
SIMPLE DECISION TREE Side effect Use adjuvant No side effect Chance node Side effect ICER Don't use adjuvant Decision node 24 No side effect
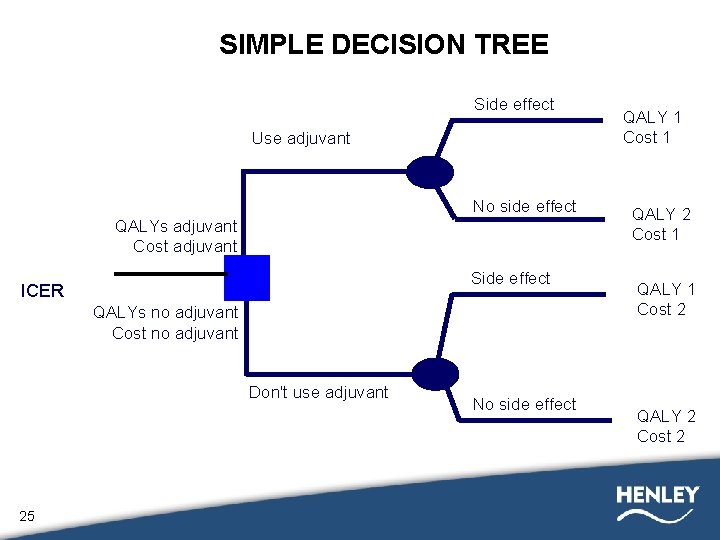
SIMPLE DECISION TREE Side effect Use adjuvant No side effect QALYs adjuvant Cost adjuvant Side effect ICER QALYs no adjuvant Cost no adjuvant Don't use adjuvant 25 No side effect QALY 1 Cost 1 QALY 2 Cost 1 QALY 1 Cost 2 QALY 2 Cost 2
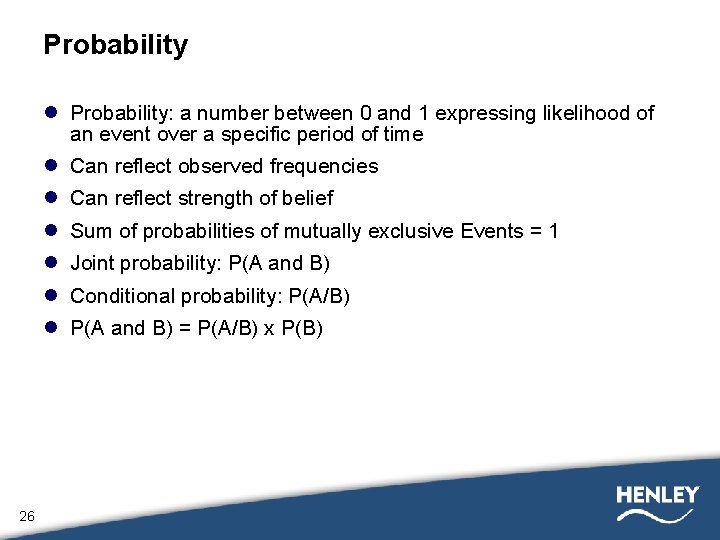
Probability l Probability: a number between 0 and 1 expressing likelihood of an event over a specific period of time l Can reflect observed frequencies l Can reflect strength of belief l Sum of probabilities of mutually exclusive Events = 1 l Joint probability: P(A and B) l Conditional probability: P(A/B) l P(A and B) = P(A/B) x P(B) 26
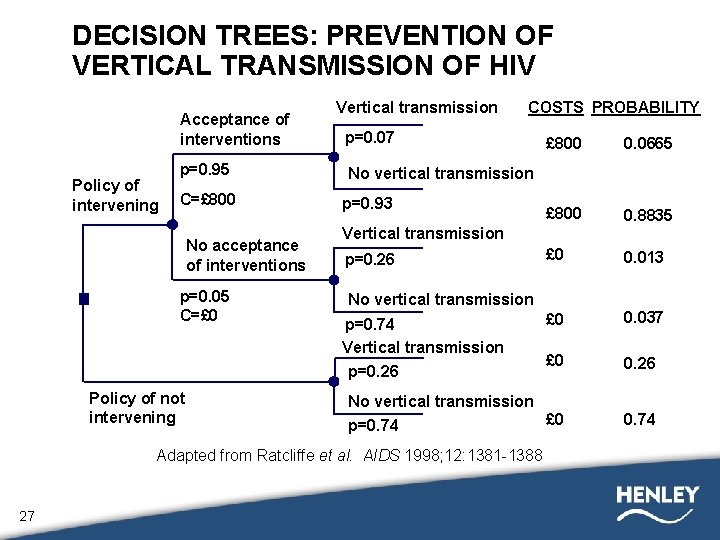
DECISION TREES: PREVENTION OF VERTICAL TRANSMISSION OF HIV Acceptance of interventions Policy of intervening p=0. 95 C=£ 800 No acceptance of interventions p=0. 05 C=£ 0 Policy of not intervening Vertical transmission COSTS PROBABILITY p=0. 07 £ 800 0. 0665 £ 800 0. 8835 £ 0 0. 013 £ 0 0. 037 £ 0 0. 26 No vertical transmission £ 0 p=0. 74 No vertical transmission p=0. 93 Vertical transmission p=0. 26 No vertical transmission p=0. 74 Vertical transmission p=0. 26 Adapted from Ratcliffe et al. AIDS 1998; 12: 1381 -1388 27
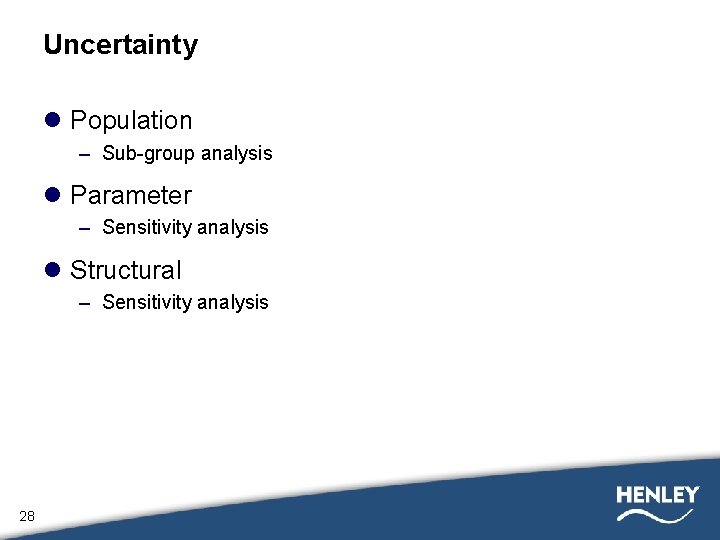
Uncertainty l Population – Sub-group analysis l Parameter – Sensitivity analysis l Structural – Sensitivity analysis 28
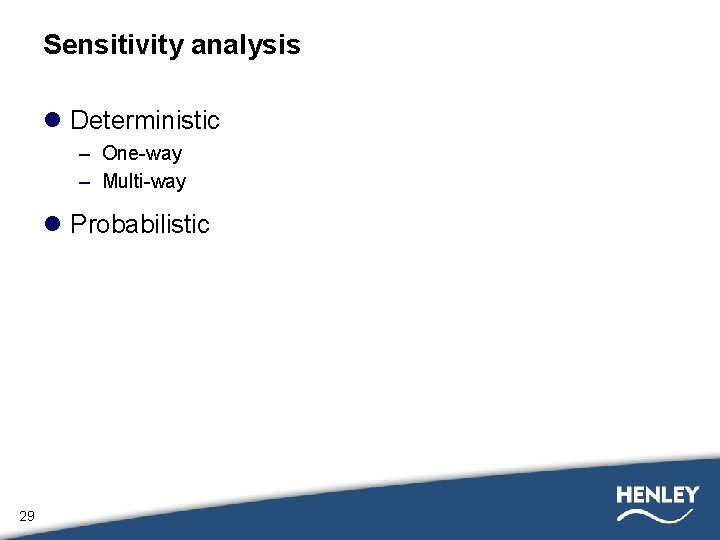
Sensitivity analysis l Deterministic – One-way – Multi-way l Probabilistic 29
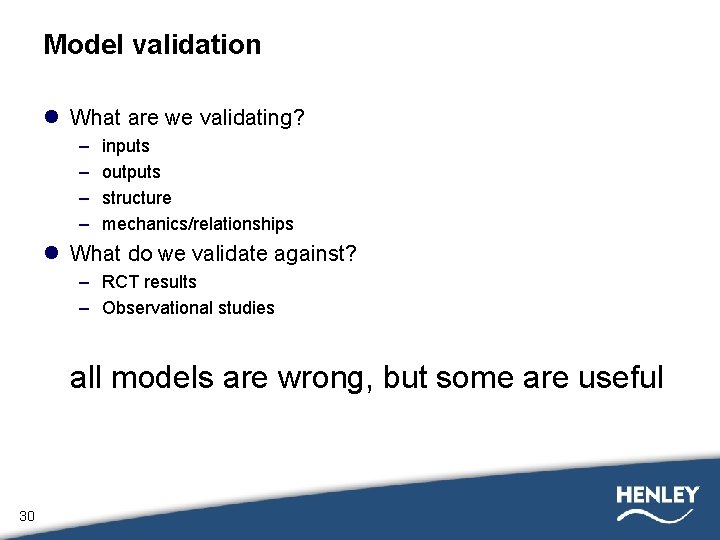
Model validation l What are we validating? – – inputs outputs structure mechanics/relationships l What do we validate against? – RCT results – Observational studies all models are wrong, but some are useful 30