Gender Analysis of Research Analysis Position at NIAR


- Slides: 10

Gender Analysis of Research Analysis Position at NIAR By Elizabeth Clarkson, Ph. D.

I was unhappy with my salary • Over the past 3 decades of working in a male dominated industry, I have found that when I compare my salary to survey data about my profession I am inevitably on the low side until I get to the breakdown by gender. • I recently discovered just how underpaid I was – the 3 rd percentile! • I requested and received data regarding NIAR employees in my job classification. • I wanted to find out how my salary compared with other men and women at NIAR.

NIAR Employees classified as RESEARCH ANALYST Average Base Pay by Job Title and Gender $120, 000 Women receive lower base pay in every category that has both male and female employees. An ANOVA analysis conducted on average salary over NIAR employment yields a p-value of 0. 0993 $100, 000 Average Salary was computed using all NIAR employees in that job category from 2008 to 2012. Base Salary was divided by FTE - Full Time Equivalent - to arrive at a comparable base salary for part time employees and eliminate noise due to overload paid. $80, 000 $60, 000 Male $40, 000 Female $20, 000 n tio ica un m m Co r to di Co or M & En gr rc h ea na ag an nt ie Sc er ist r In st ch ar se Re es Sr R gr En ch ar se DT /N En gin ee r ag er Re Se ni or Re bo se ra ar to ry ch M an an ag er t M La rc h An al ee in Re se a En g ch ar ys r r In AM se AD c. C so As ch ar se /C M ab t. L an sis t Re Re ni ci ch Te As st an ag er an h ec t. T ch ar se Re hn ol og y. S up p oo m fo r In or rd in at cia so l. C Te ch n ica ar se or te r la ch As Sc ho rc h Re Re se a IT Su pp or t. A ss t. M an ag er $0

NIAR Employees classified as RESEARCH ANALYST Average Base Pay by Job Title and Gender $120, 000 Women receive lower base pay in every category that has both male and female employees. A one-sided paired t-test on the 6 job categories that have employed both genders yields a p-value of 0. 045 $100, 000 Average Salary was computed using all NIAR employees in that job category from 2008 to 2012. Base Salary was divided by FTE - Full Time Equivalent - to arrive at a comparable base salary for part time employees and eliminate noise due to overload paid. FY = Female Years, MY = Male Years $80, 000 $60, 000 Female Male $40, 000 $20, 000 $0 Research Associate 21 FY 67 MY Female $42, 502 Male $43, 901 Research Technician Research Engineer 4 FY Research Analyst 26 FY Research Scientist 6 FY Manager 3 FY 5 MY 6 FY 10 MY 49 MY 167 MY 11 MY $47, 360 $44, 000 $60, 060 $64, 533 $76, 450 $50, 276 $62, 823 $63, 218 $65, 699 $99, 624

NIAR Employees classified as RESEARCH ANALYST Average Base Pay by Job Title and Gender limited to Job titles with multiple female employees $70, 000 $60, 000 Testing each job title separately, there are no statistically significant differences in salary between gender. $50, 000 $40, 000 $30, 000 Female Male $20, 000 $10, 000 $0 Female Male Research Associate 5 F 25 M $43, 532 $44, 360 Research Analyst 8 F 45 M $57, 579 $60, 273 Average are of Base Salary divided by FTE based on individuals during their tenure at NIAR without weighting for number of years.

Age and Base Salary FTE adjusted 140000 Research Associate Annual Salary adjusted for Full Time Equivalency 120000 Research Analyst There I Am Now 100000 Males Female 80000 60000 40000 20000 0 0 10 20 30 40 50 Average Age during NIAR Employment 60 70 80

The Graph Gives me HOPE! • I know, to the casual observer that graph might appear to be supportive of gender discrimination in pay. It’s not. • The t-test is the best measure of that and it indicates the small difference between genders on average within a job classification is not statistically significant. • Few older women are in the Research Analyst position. • Look at the distribution for women in the under 40 age group!

Age and Base Salary FTE adjusted 140000 Female Males Annual Salary adjusted for Full Time Equivalency 120000 Research Associate Research Analyst There I Am Now 100000 Linear(Female) Linear(Males) 80000 60000 40000 20000 0 20 25 30 35 40 45 50 Average Age during NIAR Employment 55 60 65 70

I see evidence of change! Base Salary FTE adjusted 140000 Annual Salary adjusted for Full Time Equivalency • I see two young women in the upper range of their age group • Look at them! No doubt they hold advanced degrees already. • I earned my Bachelors at 23, my Master’s at 31 and my Ph. D. at 51. • Combining family and career starting back in the 80’s has meant a slower approach to both for me. • My pay reflects the choices I’ve made and the ambient culture of my generation. 120000 100000 80000 60000 40000 20000 Female Males Research Associate Research Analyst There I Am Now 0 20 30 40 50 60 Average Age during NIAR Employment 70

Let me explain THINGS ARE BETTER NOW! Base Salary FTE adjusted 140000 Annual Salary adjusted for Full Time Equivalency • The females over 40 earn less than their male counterparts. • This is a likely result of the pervasive discrimination older women faced in our early careers and sacrifices made for the sake of our families. • The lack of discrimination in pay for younger women indicates that they are not experiencing gender discrimination in pay. 120000 100000 80000 60000 40000 20000 Female Males Research Associate Research Analyst There I Am Now 0 20 30 40 50 60 Average Age during NIAR Employment 70
 Second position ballet
 Strategic gender needs and practical gender needs
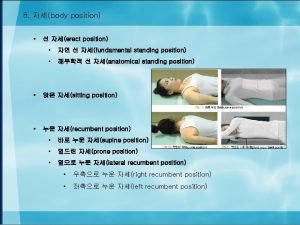
 Fundamental position vs anatomical position
 Fundamental position
 Parts of gender analysis framework
 Gender discourse analysis
 Harvard framework for gender analysis
 Moser framework tools
 Contoh gender analysis pathway (gap)
 Gender analysis example
 Gender punnett square

