Functions Graphing Worksheet A Worksheets increase in difficulty


 Complete the outputs for this machine. Plot each input")
 Use the table to plot the function: 1 2 7")
 Plot the function: 2 3 0 2 What input values")
 Complete the outputs for this machine. Plot each input")
 Use the table to plot the function: 1 2 3")
 Plot the function: 1 2 3 4 5 − 2")
 Complete the outputs for this machine. Plot each input")
 Use the table to plot the function: 1 2 7")
 Plot the function: 2 3 0 2 What input values")

- Slides: 15
Functions – Graphing – Worksheet A Worksheets increase in difficulty and are in 2 sizes.
Printing To print handouts from slides Select the slide from the left. Then click: File > Print > ‘Print Current Slide’ To print multiple slides Click on a section title to highlight all those slides, or press ‘Ctrl’ at the same time as selecting slides to highlight more than one. Then click: File > Print > ‘Print Selection’ To print double-sided handouts Highlight both slides before using ‘Print Selection’. Choose ‘Print on Both Sides’ and ‘Flip on Short Edge’.
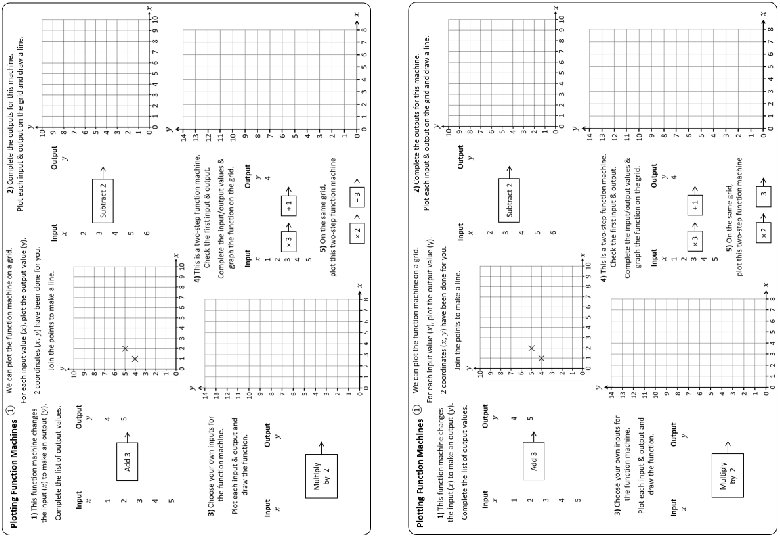
Plotting Function Machines ① 2) Complete the outputs for this machine. Plot each input & output on the grid and draw a line. Input Output 1 4 2 5 2 Add 3 3 Subtract 2 4 5 3 6 4 5 3) Choose your own inputs for the function machine. Plot each input & output and draw the function. Input Output Multiply by 2 4) This is a two-step function machine. Check the first input & output. Complete the input/output values & graph the function on the grid. Input Output 1 2 3 4 5 4 × 3 + 1 5) On the same grid, plot this two-step function machine × 2 − 3
Plotting Functions ② 2) Use the table to plot the function: 1 2 7 Coordinates 3 4 5 1 2 3 4 5 Coords 11 (2, 7) How are these two graphs similar, how are they different? c) Plot the coordinates on the gird & join the points to make a line. 3) Use the table to plot the function: 4) Use the table to plot the function: Coords 5) On the same grid, plot the function:
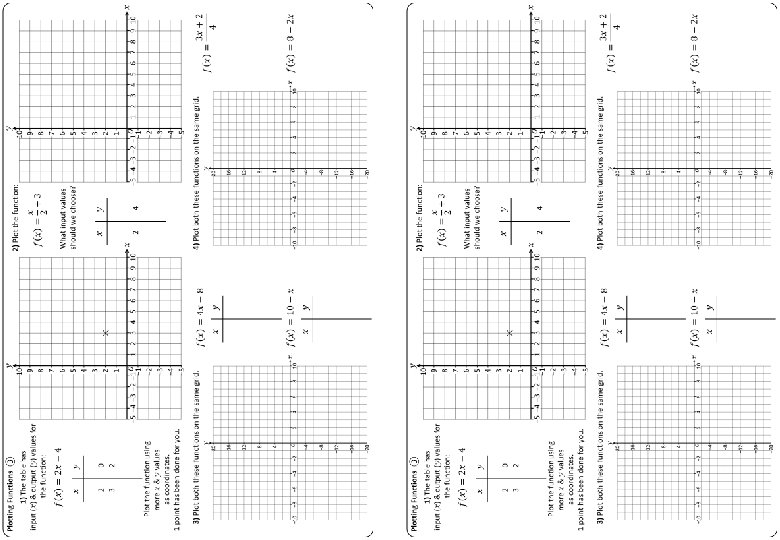
Plotting Functions ③ 2) Plot the function: 2 3 0 2 What input values should we choose? 2 4 3) Plot both these functions on the same grid. 4) Plot both these functions on the same grid.
Plotting Function Machines ① 2) Complete the outputs for this machine. Plot each input & output on the grid and draw a line. Input Output 2 0 Input Output 1 4 2 5 Add 3 3 6 4 7 5 8 3) Choose your own inputs for the function machine. Plot each input & output and draw the function. Input Output Multiply by 2 3 1 Subtract 2 4 2 5 3 6 4 4) This is a two-step function machine. Check the first input & output. Complete the input/output values & graph the function on the grid. Input Output 1 2 3 4 5 4 7 10 13 16 × 3 + 1 5) On the same grid, plot this two-step function machine × 2 − 3
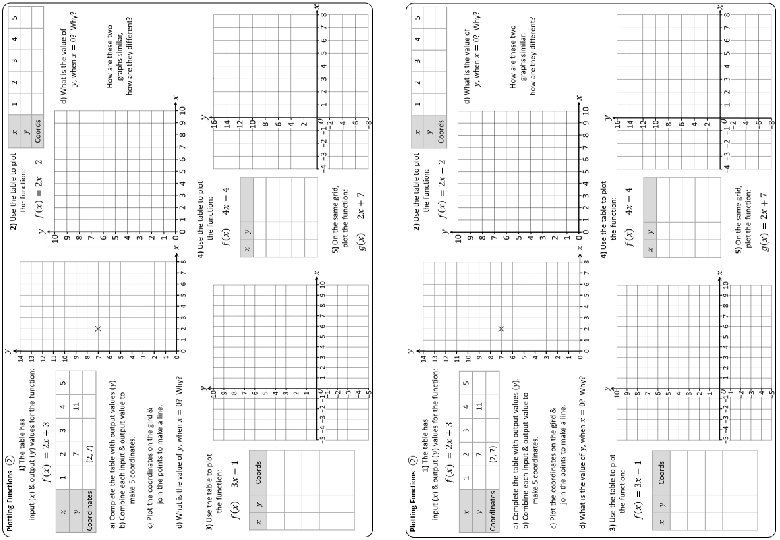
Plotting Functions ② 2) Use the table to plot the function: 1 2 3 4 5 5 7 9 11 13 1 2 3 4 5 0 2 4 6 8 Coords (1, 0) (2, 2) (3, 4) (4, 6) (5, 8) − 2 Coordinates (1, 5) (2, 7) (3, 9) (4, 11) (5, 13) How are these two graphs similar, how are they different? Same gradient 1 across up 2. c) Plot the coordinates on the gird & join the points to make a line. 3 3) Use the table to plot the function: Coords 0 − 4 (0, − 4) 1 0 (1, 0) 2 4 (2, 4) 3 8 (3, 8) 4 12 (4, 12) 0 − 1 (0, − 1) 1 2 (1, 2) 2 5 (2, 5) 3 8 (3, 8) 4 11 (4, 11) 4) Use the table to plot the function: 5) On the same grid, plot the function:
Plotting Functions ③ 2) Plot the function: 1 2 3 4 5 − 2 0 2 4 6 What input values should we choose? 2 4 3) Plot both these functions on the same grid. 4) Plot both these functions on the same grid.
Plotting Function Machines ① 2) Complete the outputs for this machine. Plot each input & output on the grid and draw a line. Input Output 1 4 2 5 2 Add 3 3 Subtract 2 4 5 3 6 4 5 3) Choose your own inputs for the function machine. Plot each input & output and draw the function. Input Output Multiply by 2 4) This is a two-step function machine. Check the first input & output. Complete the input/output values & graph the function on the grid. Input Output 1 2 3 4 5 4 × 3 + 1 5) On the same grid, plot this two-step function machine × 2 − 3
Plotting Functions ② 2) Use the table to plot the function: 1 2 7 Coordinates 3 4 5 1 2 3 4 5 Coords 11 (2, 7) How are these two graphs similar, how are they different? c) Plot the coordinates on the gird & join the points to make a line. 3) Use the table to plot the function: 4) Use the table to plot the function: Coords 5) On the same grid, plot the function:
Plotting Functions ③ 2) Plot the function: 2 3 0 2 What input values should we choose? 2 4 3) Plot both these functions on the same grid. 4) Plot both these functions on the same grid.
Questions? Comments? Suggestions? …or have you found a mistake!? Any feedback would be appreciated . Please feel free to email: tom@goteachmaths. co. uk