Inequalities Representing Worksheet A The worksheet is in


- Slides: 10
Inequalities – Representing – Worksheet A The worksheet is in 3 sizes.
Printing To print handouts from slides Select the slide from the left. Then click: File > Print > ‘Print Current Slide’ To print multiple slides Click on a section title to highlight all those slides, or press ‘Ctrl’ at the same time as selecting slides to highlight more than one. Then click: File > Print > ‘Print Selection’ To print double-sided handouts Highlight both slides before using ‘Print Selection’. Choose ‘Print on Both Sides’ and ‘Flip on Short Edge’.
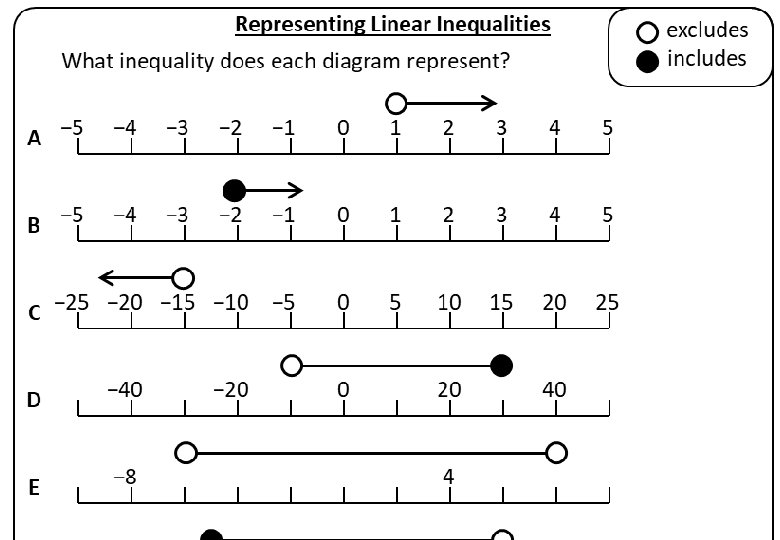
Representing Linear Inequalities excludes includes What inequality does each diagram represent? A − 5 − 4 − 3 − 2 − 1 0 1 2 3 4 5 B − 5 − 4 − 3 − 2 − 1 0 1 2 3 4 5 C − 25 − 20 − 15 − 10 − 5 0 5 10 15 20 25 D − 40 E − 8 − 20 0 20 40 4 F − 20 20 G H I J
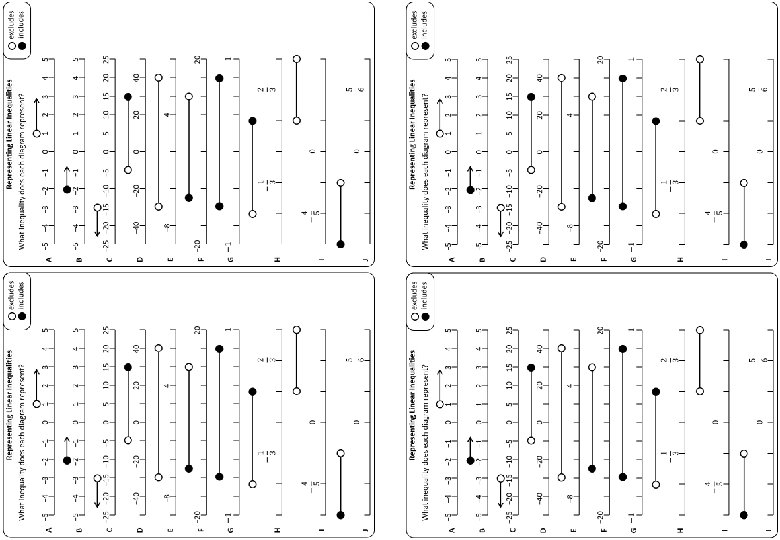
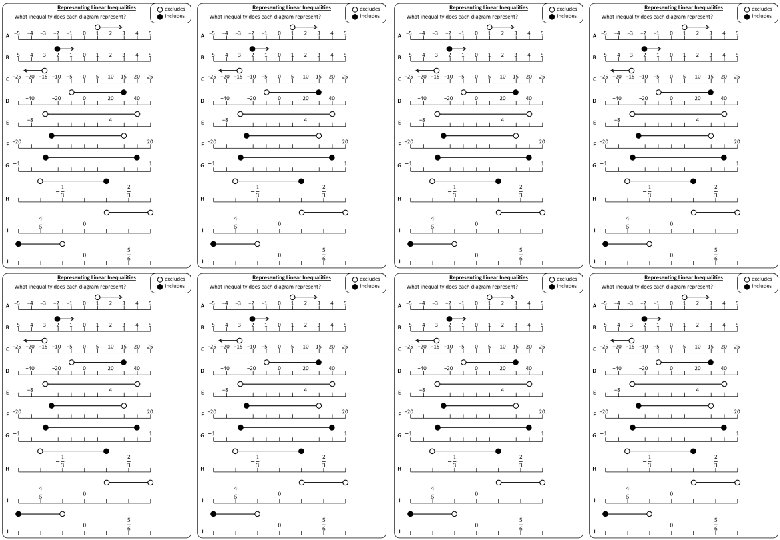
Representing Linear Inequalities excludes includes What inequality does each diagram represent? A − 5 − 4 − 3 − 2 − 1 0 1 2 3 4 5 B − 5 − 4 − 3 − 2 − 1 0 1 2 3 4 5 C − 25 − 20 − 15 − 10 − 5 0 5 10 15 20 25 D − 40 E − 8 − 20 0 20 20 H I J 4 40 F − 20 G Half Answers
Representing Linear Inequalities excludes includes What inequality does each diagram represent? A − 5 − 4 − 3 − 2 − 1 0 1 2 3 4 5 B − 5 − 4 − 3 − 2 − 1 0 1 2 3 4 5 C − 25 − 20 − 15 − 10 − 5 0 5 10 15 20 25 D − 40 E − 8 − 20 0 20 40 4 F − 20 20 G H I J Answers
Representing Linear Inequalities excludes includes What inequality does each diagram represent? A − 5 − 4 − 3 − 2 − 1 0 1 2 3 4 5 B − 5 − 4 − 3 − 2 − 1 0 1 2 3 4 5 C − 25 − 20 − 15 − 10 − 5 0 5 10 15 20 25 D − 40 E − 8 − 20 0 20 40 4 F − 20 20 G G H H I J
Questions? Comments? Suggestions? …or have you found a mistake!? Any feedback would be appreciated . Please feel free to email: tom@goteachmaths. co. uk