FCC Operation schedule luminosity goals Arto Niemi Contents


- Slides: 17


FCC Operation schedule & luminosity goals Arto Niemi

Contents • • • Collider availability for physics FCC Luminosity goals & ultimate parameters FCC Run schedule Comparison with LHC 20 ab-1 lifecycle goal Conclusions

Collider availability for physics Shutdown Operation Years HW Commissioning Beam Commissioning Luminosity Production Technical Stop Machine Studies Weeks Machine Cycle Stable Beams Failure Precycle Hours

FCC-hh operation & luminosity 5 year long operation periods • 3. 5 years operation periods with • • radiation damping: t~1 h 1 year HW comm. , MDs, short stops 2. 5 years lumi. run with 70% availability • 1. 5 year shutdown 2 periods at baseline parameters (10 yrs) • Peak luminosity 5 x 1034 cm-2 s-1 • Total of 2. 5 ab-1 (per detector) phase 1: b*=1. 1 m, DQtot=0. 01, tta=5 h, 250 fb-1 / year phase 2: b*=0. 3 m, DQtot=0. 03, tta=4 h, 1 ab-1 / year 3 periods at ultimate parameters (15 yrs) • Peak luminosity <=30 x 1034 cm-2 s-1 • 5 ab-1 period total of 15 ab-1 O(20) ab-1 integrated luminosity/experiment consistent with physics goal: 20 ab-1 in total Detectors must sustain a total of >20 ab-1 and >5 ab-1 between maintenance stops Machine design to support 3. 5 year operation periods w/o warm up or long stops Future Circular Collider Study Michael Benedikt 2 nd FCC Week, Rome, April 2016 5

Operational assumptions for 5 ab-1/run • • Assumption: if machine is available production = 8 fb-1/day Current parameters contains a small margin • turnaround time = 4 hours and 8 fb-1/day is achieved under 20 hours Source: DOI: 10. 1103/Phys. Rev. STAB. 18. 101002

Luminosity production with ultimate parameters Assumption operational efficiency (availability) = 70 % average 5. 6 fb-1/day • 5 years full production 10 ab-1 • 3. 5 years (1. 5 years LTS) 7 ab-1 • 2. 5 years (LTS + 12 months) 5 ab-1 Plot shows: Int. lumi. = days*average productions Integrated luminosity [ab-1] • 10 8 6 Int. Lumi. 1. 5 a LTS 4 LTS + 12 months 2 0 0 1 2 3 4 Operation time [years] 5

Run schedule • When the collider is not producing proton collisions (at full rate)? • Year end technical stops • Commissioning (with & without beam) • Short technical stops & machine studies • Ion physics (*assumption LHC like 1 month/year) • What does 12 months looks like? *A. Dainese & J. Jowett, Personal communication

Run X No proton physics for 12 months / Run • 6 months of commissioning (orange) • 3 months after LTS • 1 month after YETS • 3 months of YEATS (green) • 3 months of ion runs (yellow) Total sum = 12 months 1 2 3 4 5 6 7 8 9 10 11 12 1 2 3 4 5 6 7 8 9 10 11 12

Open questions • Can the annual maintenance performed in 1 month? • • How quickly is commissioning & intensity ramp up? • • What affects this machine protection, vacuum, beam dynamics… Ion physics and proton physics? • • Note: also the injector chain Here full execution of both programs is assumed How much time is required for tech. stops & MD’s during year?

1 month extra/year Jan Wk Feb 1 30 Mo • 10 days for TS + 4 days of commissioning after TS • 14 days for machine studies • Few days to prepare ion run 3 6 4 13 Mar 5 20 6 27 7 3 8 10 9 17 10 24 11 2 12 9 13 16 23 Tu We Th Fr Sa Su Apr Wk May 14 15 30 Mo 16 6 17 13 June 18 20 19 27 20 4 21 11 22 18 23 25 24 1 25 8 26 15 22 Tu We Th Fr Sa Su July Wk Aug 27 28 29 Mo = 1 month ≈ 4 weeks, 2 days 2 29 6 30 13 Sep 31 20 32 27 33 3 34 10 35 17 36 24 37 31 38 7 39 14 21 Tu We Th Fr Sa Su Oct Wk Nov 40 Mo 41 28 42 5 43 12 Dec 44 19 45 26 46 2 47 9 48 16 49 50 30 23 51 7 52 14 21 Tu We Th Fr Sa Su

HL-LHC vs. FCC (plan) HL-LHC Jan Wk Mo Tu We Th Fr Sa Su Feb 1 2 30 3 6 4 13 20 Wk Mo Tu We Th Fr Sa Su 7 3 8 10 Jan 9 17 10 24 15 30 16 6 July 27 13 28 29 9 13 16 23 Wk Mo Tu We Th Fr Sa Su 34 38 21 51 7 39 14 50 30 22 7 Dec 49 23 15 37 26 31 48 16 8 Sep 36 25 24 47 9 1 35 24 17 46 2 25 Feb 1 2 30 3 6 4 13 52 14 21 Wk Mo Tu We Th Fr Sa Su 20 6 27 7 3 8 10 9 17 10 24 15 30 16 6 July 27 13 28 29 HL-LHC based on: Chapter 16, DOI: 10. 5170/CERN-2015 -005 13 16 23 47 9 38 21 51 7 39 14 50 30 22 7 Dec 49 23 37 26 15 31 48 16 24 25 8 Sep 36 35 24 1 17 46 2 34 23 25 10 45 26 18 33 22 3 Nov 44 19 11 32 21 27 43 12 4 Aug 31 20 42 5 13 41 19 27 30 28 20 12 9 June 18 6 Oct 40 17 11 2 May 14 Mar 5 Apr 23 10 45 26 18 33 22 3 Nov 44 19 11 32 21 27 43 12 4 Aug 31 20 21 42 5 27 30 19 14 41 28 20 12 June 18 6 Oct 40 17 11 2 May 14 6 27 Apr Wk Mo Tu We Th Fr Sa Su Mar 5 52 14 21

Comparison with LHC Shutdown Operation Years Level 1 LHC FCC 2 a LTS, 4 a Run = 67 % HW Commissioning Beam Commissioning 1. 5 a LTS, 3. 5 a Run = 70 % Luminosity Production Technical Stop 2 160 days (HL-LHC) = 44 % ~9 months = 75 % 3 2016 (only downtime) 72 % 70 % TEEP* 21 % 37 % Machine Cycle Stable Beams *Total effective equipment performance Machine Studies Weeks Failure Precycle Hours

• • 10 ab-1 5 years full production 3. 5 years (1. 5 years LTS) 7 ab-1 2. 5 years (LTS + 12 months) 5 ab-1 2 years (LTS + 18 months) 4 ab-1 Integrated luminosity [ab-1] Luminosity production with ultimate parameters 10 8 6 Int. Lumi. 1. 5 a LTS 4 LTS + 12 months 2 0 0 1 2 3 4 Operation time [years] 5

If lifecycle goal is 20 ab-1 20 years life 25 years life Options: Current baseline 2. 5 ab-1 Flat 4 ab-1 (unrealistic) 4 ab-1 Flat 5 ab-1 (unrealistic) 7. 5 ab-1 ultimate 0 5 ab-1 20 ab-1 in 25 years maximum attainable production must be more than 4 ab-1/run 4 ab-1 5 ab-1 2. 5 ab-1 7. 5 ab-1 5 10 Years 15 4 ab-1 20 25

How to produce 5 ab-1/Run? 5 Two options: 1. Longer time to operate 2. Higher production/day • Two examples: 1. 6 months reduction to LTS 5. 6 fb-1/day 2. 7 fb-1/day 2 years of proton-physics time per run 4. 5 Operational time [years/run] • 4 3. 5 3 2. 5 2 1 5 ab-1/Run 2 2. 5 ab-1/Run 7. 5 ab-1/Run 1. 5 1 0. 5 0 0 1 2 3 4 5 6 7 8 9 101112131415 Daily average integrated luminosity [fb-1/day]

Conclusion • • For 20 ab-1 during lifecycle, 4 ab-1/run is too little Attainable production depends on: • • • Theoretically achievable production (Physics & Operations) Number of operational days (Schedule) Production efficiency (Availability, operational procedures, etc. ) Task: Understand what limits the production in different levels and define goals
 Arto niemi
 Arto niemi
 Strategic goals tactical goals operational goals
 Strategic goals tactical goals operational goals
 Justus rothlaender
 Onomatopoeia in poems
 Aki niemi
 Minna niemi-grundström
 Examples of generic goals and product-specific goals
 General goals and specific goals
 Contoh kertas kerja pemeriksaan audit
 Luminosity distance
 Luminosity
 What is solar luminosity
 Luminosity distance
 Luminosity lpi
 Luminosity class definition
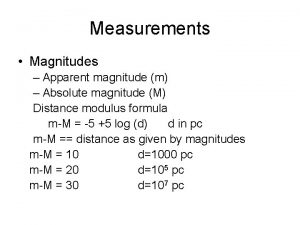
 Apparent vs absolute magnitude


