End to End Storage Performance Measurements R Voicu

- Slides: 19

End to End Storage Performance Measurements R. Voicu 1, I. Legrand 1, H. Newman 1 2 C. Grigoras 1 California Institute of Technology 2 CERN CHEP 2010 Taipei, October 21 st, 2010 1

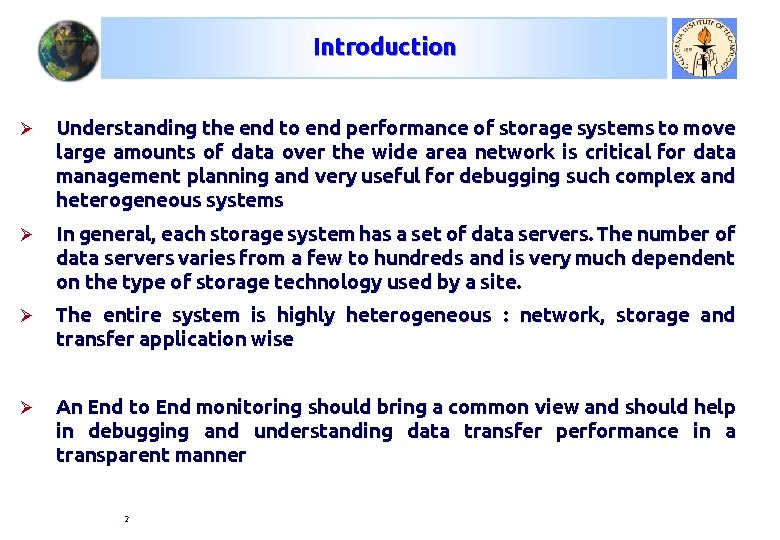
Introduction Ø Understanding the end to end performance of storage systems to move large amounts of data over the wide area network is critical for data management planning and very useful for debugging such complex and heterogeneous systems Ø In general, each storage system has a set of data servers. The number of data servers varies from a few to hundreds and is very much dependent on the type of storage technology used by a site. Ø The entire system is highly heterogeneous : network, storage and transfer application wise Ø An End to End monitoring should bring a common view and should help in debugging and understanding data transfer performance in a transparent manner 2

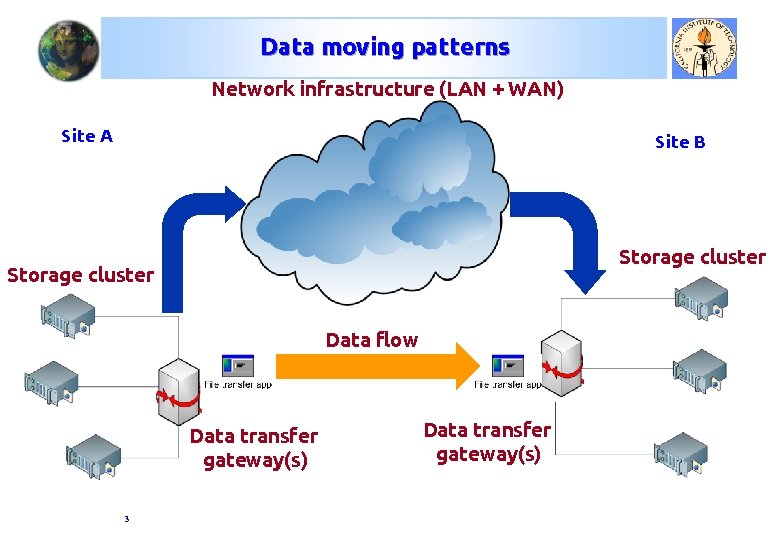
Data moving patterns Network infrastructure (LAN + WAN) Site A Site B Storage cluster Data flow Data transfer gateway(s) 3 Data transfer gateway(s)

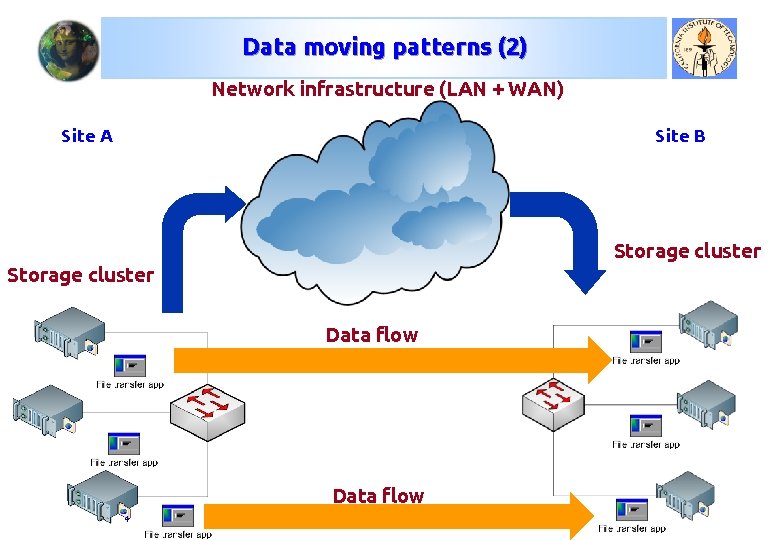
Data moving patterns (2) Network infrastructure (LAN + WAN) Site A Site B Storage cluster Data flow 4

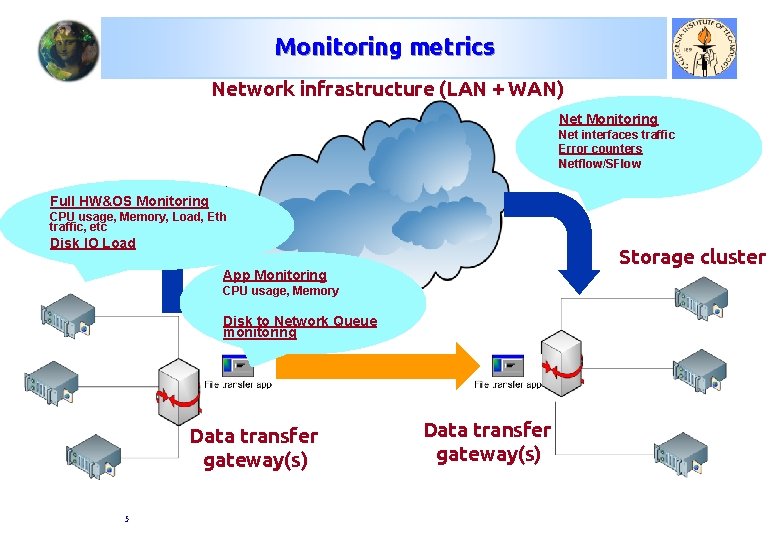
Monitoring metrics Network infrastructure (LAN + WAN) Net Monitoring Net interfaces traffic Error counters Site Netflow/SFlow B Full HW&OS Monitoring CPU usage, Memory, Load, Eth traffic, etc Disk IO Load Storage cluster App Monitoring CPU usage, Memory Disk to Network Queue monitoring Data transfer gateway(s) 5 Data transfer gateway(s)

Motivation Ø The Mon. ALISA monitoring system includes: Ø Local host monitoring (CPU, memory, network traffic , Disk I/O, processes and sockets in each state, LM sensors, APC UPSs), log files tailing Ø SNMP generic & specific modules Ø Condor, PBS, LSF and SGE (accounting & host monitoring), Ganglia Ø Ping, tracepath, traceroute, pathload and other network-related measurements Ø TL 1, Network devices, Ciena, Optical switches Ø Calling external applications/scripts that return as output the values Ø XDR-formatted UDP messages (such as Ap. Mon) 6

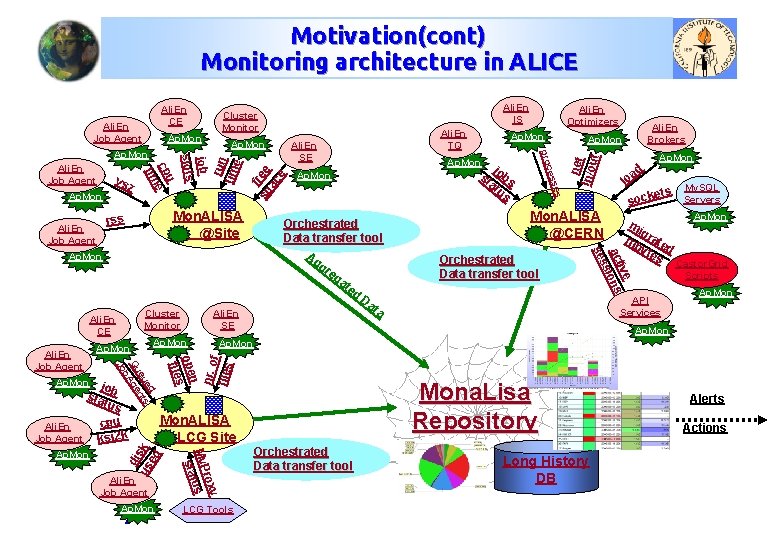
Motivation(cont) Monitoring architecture in ALICE Ap. Mon jo sta b tus Ali. En Job Agent Ap. Mon 7 run tim e b at s us st lo My. SQL ts Servers e sock Mon. ALISA @CERN Orchestrated Data transfer tool Ap. Mon ad mi g mb rate yte d s API Services Ap. Mon Castor. Grid Scripts Ap. Mona. Lisa Repository Mon. ALISA LCG Site y rox My. P tus sta Ap. Mon cpu ksi 2 k di us sk ed Ali. En Job Agent n ope files Ap. Mon ed eu nts Qu Age b Jo Ali. En Job Agent Ali. En SE nr. o f files Cluster Monitor Ali. En CE jo ive act ions s ses Ap. Mon Orchestrated Data transfer tool Ag gr eg at ed Da ta Ap. Mon Ali. En Brokers Ap. Mon ses Ali. En Job Agent Ap. Mon ces Mon. ALISA @Site rss Ali. En SE Ali. En TQ Ali. En Optimizers pro Ap. Mon vs z u cp e tim Ali. En Job Agent Ap. Mon job slots Ap. Mon f sp ree ac e Ali. En Job Agent Ali. En IS Cluster Monitor net In/o ut Ali. En CE LCG Tools 7 Orchestrated Data transfer tool Long History DB Alerts Actions

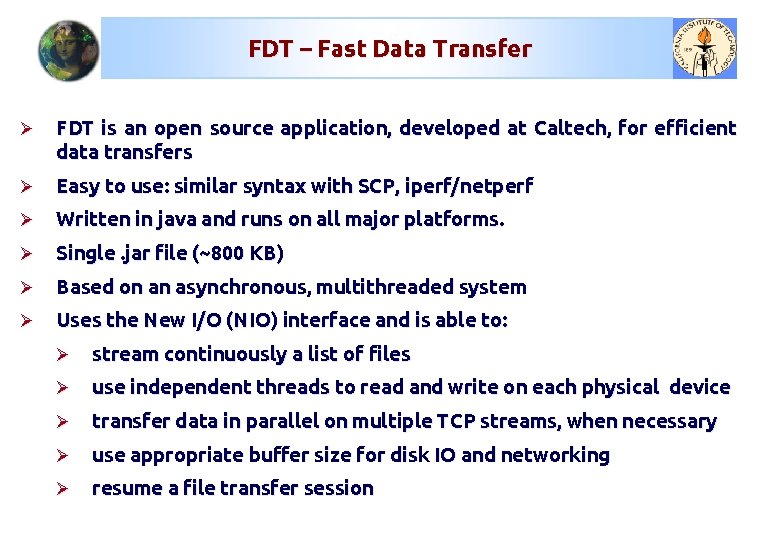
FDT – Fast Data Transfer Ø FDT is an open source application, developed at Caltech, for efficient data transfers Ø Easy to use: similar syntax with SCP, iperf/netperf Ø Written in java and runs on all major platforms. Ø Single. jar file (~800 KB) Ø Based on an asynchronous, multithreaded system Ø Uses the New I/O (NIO) interface and is able to: Ø stream continuously a list of files Ø use independent threads to read and write on each physical device Ø transfer data in parallel on multiple TCP streams, when necessary Ø use appropriate buffer size for disk IO and networking Ø resume a file transfer session

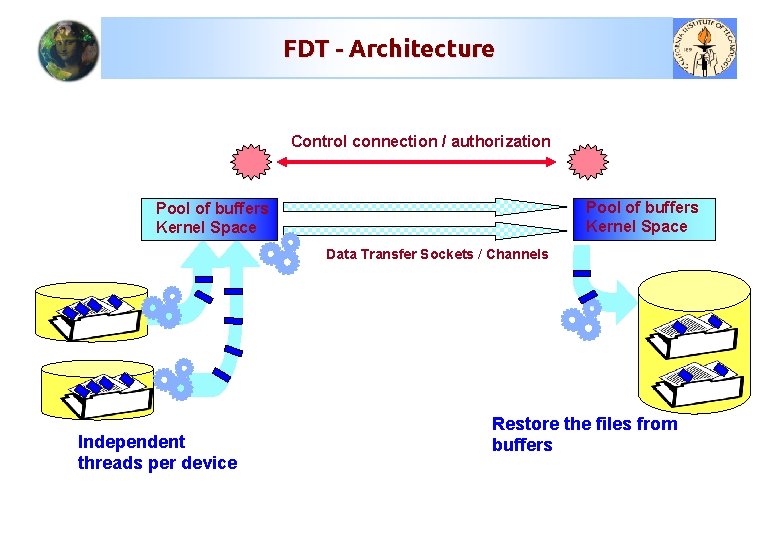
FDT - Architecture Control connection / authorization Pool of buffers Kernel Space Data Transfer Sockets / Channels Independent threads per device Restore the files from buffers

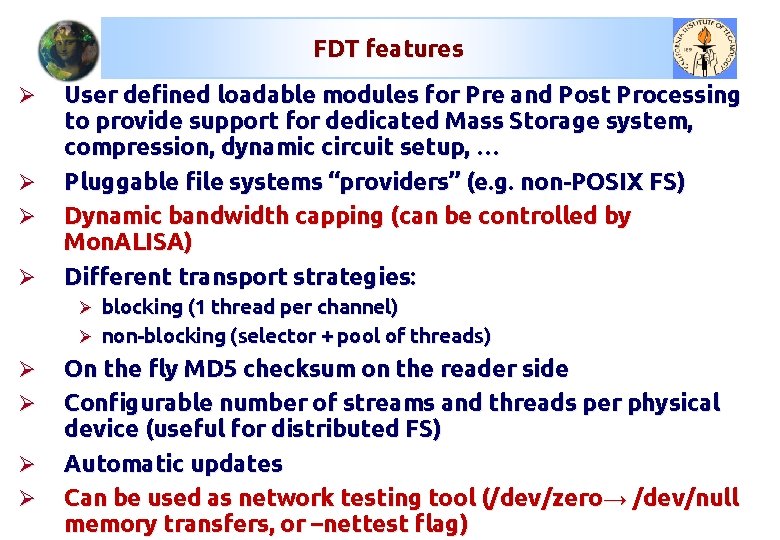
FDT features Ø Ø User defined loadable modules for Pre and Post Processing to provide support for dedicated Mass Storage system, compression, dynamic circuit setup, … Pluggable file systems “providers” (e. g. non-POSIX FS) Dynamic bandwidth capping (can be controlled by Mon. ALISA) Different transport strategies: Ø blocking (1 thread per channel) Ø non-blocking (selector + pool of threads) Ø Ø On the fly MD 5 checksum on the reader side Configurable number of streams and threads per physical device (useful for distributed FS) Automatic updates Can be used as network testing tool (/dev/zero→ /dev/null memory transfers, or –nettest flag)

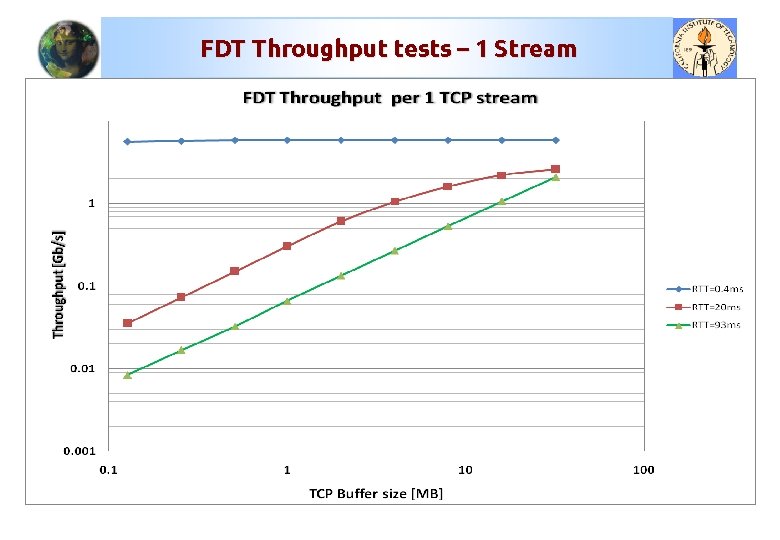
FDT Throughput tests – 1 Stream

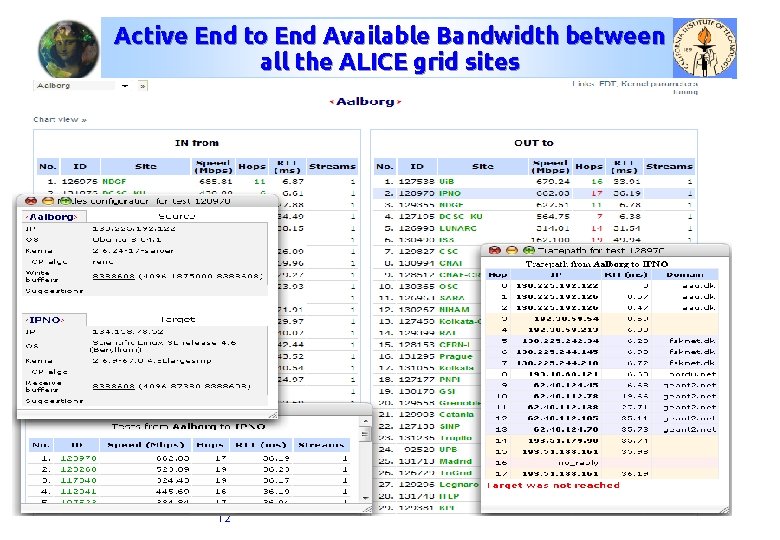
Active End to End Available Bandwidth between all the ALICE grid sites 12

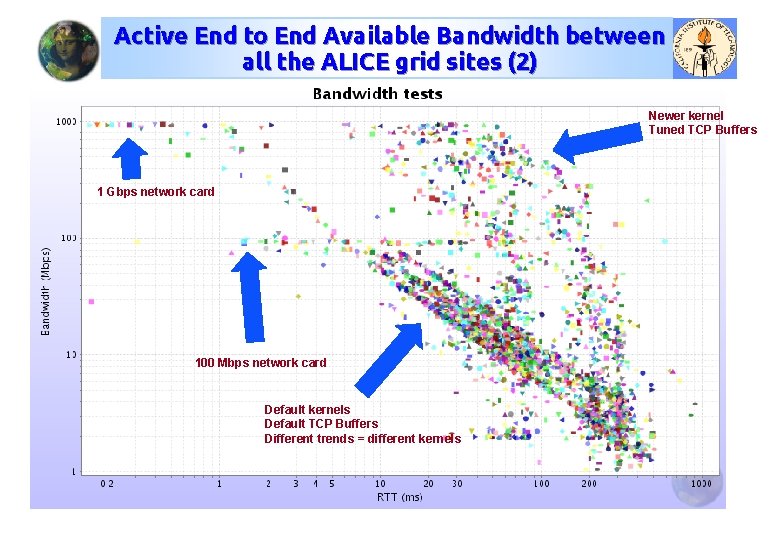
Active End to End Available Bandwidth between all the ALICE grid sites (2) Newer kernel Tuned TCP Buffers 1 Gbps network card 100 Mbps network card Default kernels Default TCP Buffers Different trends = different kernels

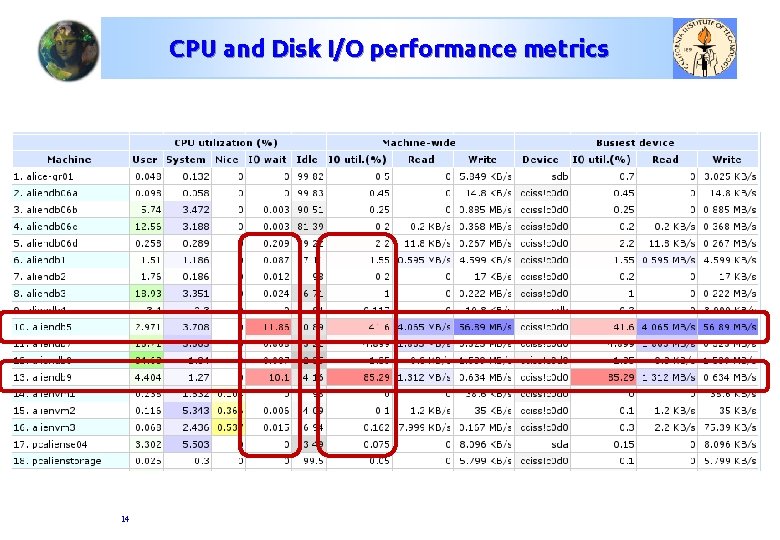
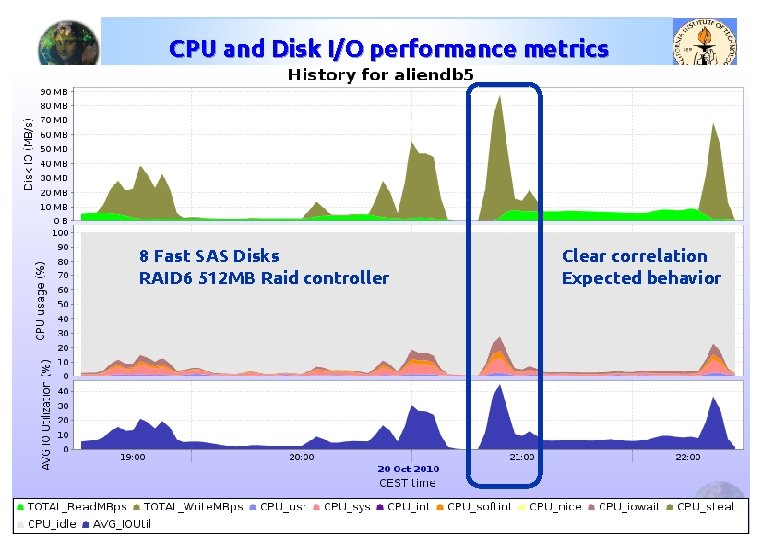
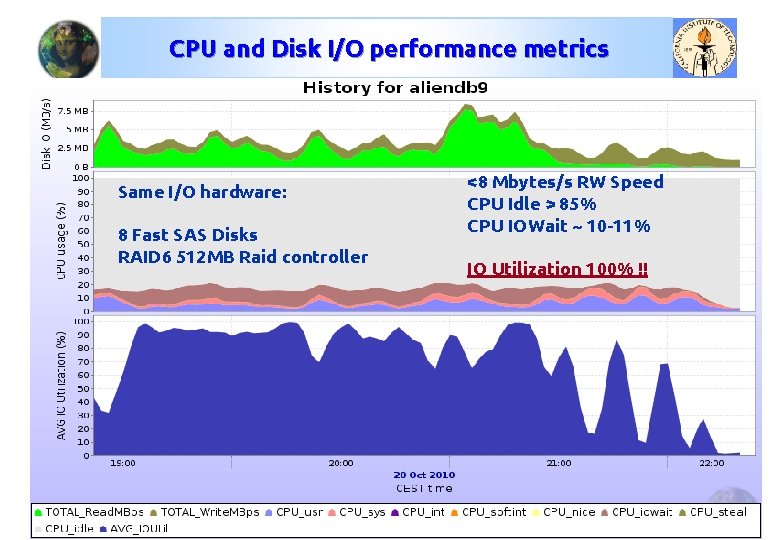
CPU and Disk I/O performance metrics 14

CPU and Disk I/O performance metrics 8 Fast SAS Disks RAID 6 512 MB Raid controller 15 Clear correlation Expected behavior

CPU and Disk I/O performance metrics Same I/O hardware: 8 Fast SAS Disks RAID 6 512 MB Raid controller 16 <8 Mbytes/s RW Speed CPU Idle > 85% CPU IOWait ~ 10 -11% IO Utilization 100% !!

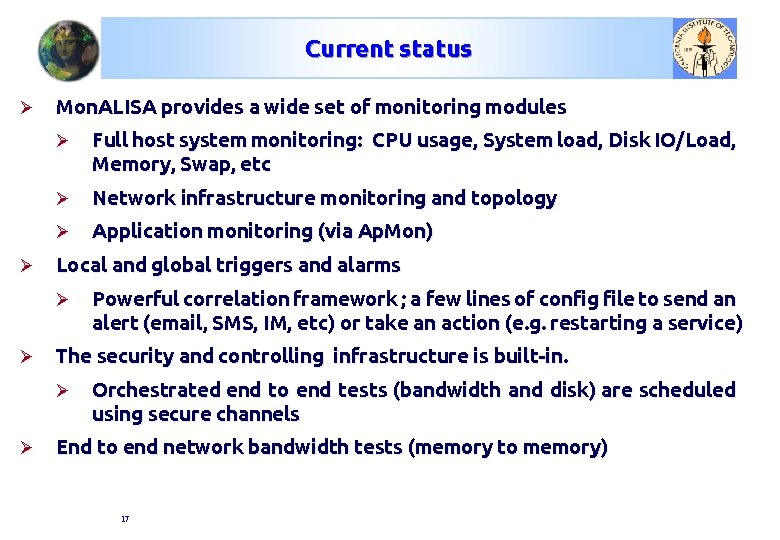
Current status Ø Ø Mon. ALISA provides a wide set of monitoring modules Ø Full host system monitoring: CPU usage, System load, Disk IO/Load, Memory, Swap, etc Ø Network infrastructure monitoring and topology Ø Application monitoring (via Ap. Mon) Local and global triggers and alarms Ø Ø The security and controlling infrastructure is built-in. Ø Ø Powerful correlation framework ; a few lines of config file to send an alert (email, SMS, IM, etc) or take an action (e. g. restarting a service) Orchestrated end to end tests (bandwidth and disk) are scheduled using secure channels End to end network bandwidth tests (memory to memory) 17

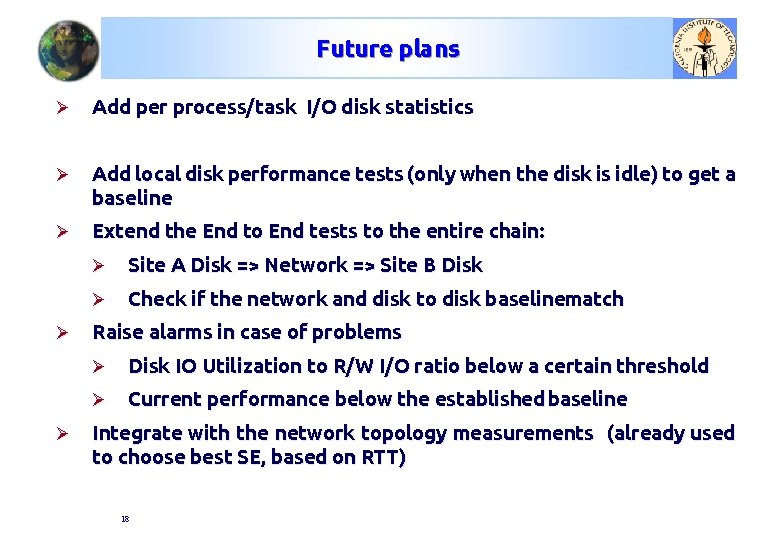
Future plans Ø Add per process/task I/O disk statistics Ø Add local disk performance tests (only when the disk is idle) to get a baseline Ø Extend the End to End tests to the entire chain: Ø Ø Ø Site A Disk => Network => Site B Disk Ø Check if the network and disk to disk baselinematch Raise alarms in case of problems Ø Disk IO Utilization to R/W I/O ratio below a certain threshold Ø Current performance below the established baseline Integrate with the network topology measurements (already used to choose best SE, based on RTT) 18

Q&A http: //monalisa. caltech. edu http: //monalisa. cern. ch/FDT http: //alimonitor. cern. ch 19