Economic Perspectives DEMAND SUPPLY DEMAND The amount of


- Slides: 41
Economic Perspectives DEMAND & SUPPLY
» DEMAND: The amount of goods/services consumers are willing & able to buy at various prices during a specified time period. » SUPPLY: The amount of goods/services producers are willing & able to sell at various prices during a specified time period. » How many sodas/beverages do you buy per week? SECTION 1
» MARKET: Process of freely exchanging goods/services between buyers & sellers. ˃ Stores, Services, Entertainment, Internet » VOLUNTARY EXCHANGE: Transaction in which a buyer & seller exercise their economic freedom by working out their own terms of exchange SECTION 1
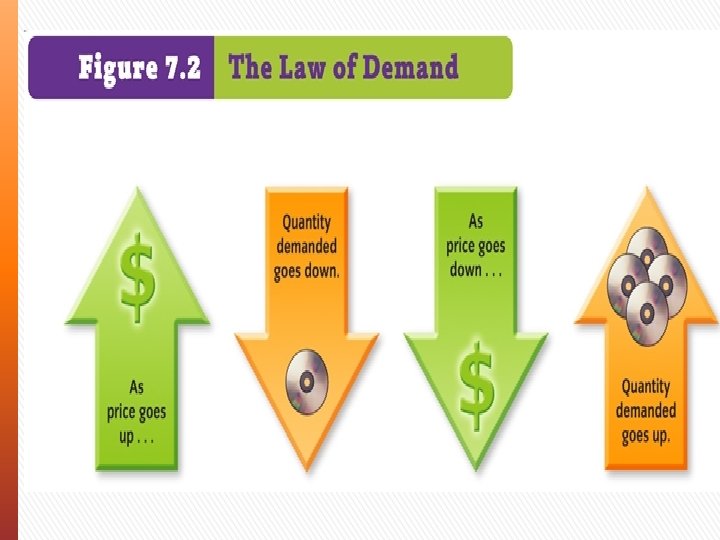
» LAW OF DEMAND: Economic rule stating quantity demanded & price move in opposite directions ˃ Price has an inverse affect on demand » QUANTITY DEMANDED: Amount of a good or service that a consumer is willing and able to purchase at a specific price SECTION 1
» REAL INCOME EFFECT: Economic rule stating individuals cannot keep buying the same quantity of a product if its price rises while their income stays the same » SUBSTITUTION EFFECT: Rule stating if two items satisfy the same need and one has a higher price, people will buy more of the lower priced item SECTION 1
» UTILITY: Ability of any good/service to satisfy a customer’s wants » LAW OF DIMINISIHNG MARGINAL UTILITY: States that the additional satisfaction received from purchasing one more unit of a product will lessen with each additional unit purchased ˃ Lemonade Example SECTION 1
» DEMAND CURVE: A line showing the quantity demanded of a good/service at each possible price. Slopes downward… ˃ PRETTY QUICK – PRICE QUANTITY ˃ Price is always on the left (vertical axis) ˃ Quantity is on the bottom (horizontal axis) SECTION 2
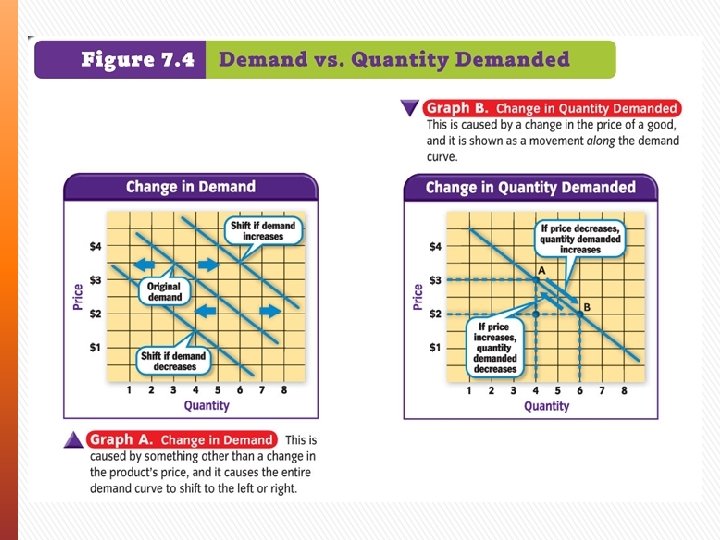
» Moving Along the Demand Line… ˃ CHANGE IN QUANTITY DEMANDED + Caused by a change in Price – Shift ALONG the Demand Curve » PRICE + /DEMAND - = Moves Left » PRICE - /DEMAND + = Moves Right » Moving the Demand Line… ˃ CHANGE IN DEMAND + Caused by something other than a change in price – Shift of the WHOLE Demand Curve » DEMAND INCREASE line shifts RIGHT » DEMAND DECREASE line shifts LEFT SECTION 2
» DETERMINANTS of DEMAND ˃ A. K. A. Factors of Change + + + + Change in Population Change in Income Change in Tastes/Preferences Substitutes Complimentary Goods Change in # of Buyers Change of Expectations SECTION 2
1. Population » D 1 – represents the original demand for TV’s » D 2 – represents the demand after the population increased » If population decreased, demand would also decrease
If Income decreases, demand also decreases. 2. Income
3. Tastes & Preferences *This refers to what people like and prefer to choose. This Beanie Baby graph represents the demand in the early 1990’s. As the popularity soared the graph moved right. Eventually demand died down, and the curve shifted back to the left.
4. Substitutes Determined by availability & price of substitute Think it through! If the price of the substitute decreases, then you’ll buy that instead of the original item. Vice versa: If the price of the substitute increases, you’ll be more of the original item.
5. Compliments *Things that are bought and sold together If the price of one decreases, the demand of BOTH complimentary items increases. This examples shows: If the price of a digital camera decreases, the demand of the camera AND the flash memory increases.
» DETERMINANTS of DEMAND ˃ A. K. A. Factors of Change + + + + Change in Population Change in Income Change in Tastes/Preferences Substitutes Complimentary Goods Change in # of Buyers Change of Expectations SECTION 2
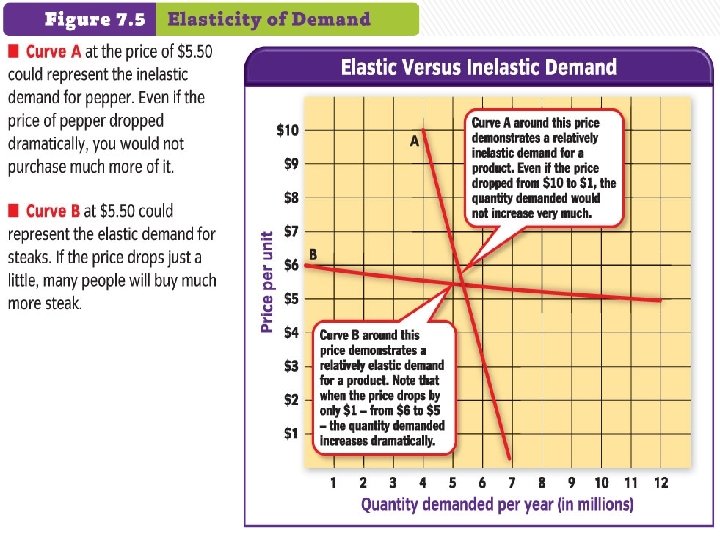
» PRICE ELASTICITY OF DEMAND: How much consumers respond to a given change in price. ˃ ELASTIC DEMAND + Rise/Fall in Price GREATLY affects demand + Consumers are flexible about buying items that have ELASTIC DEMAND. – They can get by without them if price gets too high ˃ INELASTIC DEMAND + Rise/Fall in Price has LITTLE TO NO affect + Items are “must have” for the consumer SECTION 2
Examples Elastic Demand Inelastic Demand » Luxury items, vacations, high-end electronics, even coffee are examples of elastic goods/services and have a very elastic demand. » Staple foods, medicine, spices have an inelastic demand. A price change has little impact on the quantity demanded by consumers.
Figure 11
DFS Trans 2
» SUPPLY CURVE: A line showing the quantity supplied of a good/service at each possible price. Slopes upward… SECTION 3
» LAW OF SUPPLY: Economic rule stating quantity supplied & price move in the same direction ˃ Price has an direct affect on supply ˃ PROFIT INCENTIVE is directly related to Supply SECTION 3
Profits and the Law of Supply • To understand pricing, you must look at both demand supply. • The law of supply states that as the price of a good rises, the quantity supplied also rises. As the price falls, the quantity supplied also falls. • The higher the price of a good, the greater the incentive is for a producer to produce more. Supplied
» DETERMINANTS OF SUPPLY: ˃ ˃ Price of Inputs Number of Firms in the Industry Taxes Technology Any time the COST to the business INCREASES, then the COST of production INCREASES, and supplies will SUPPLY FEWER goods Any time the COST to the business DECREASES, then the COST of production DECREASES, and supplies will SUPPLY MORE goods SECTION 3
1. The price of inputs Examples of Inputs (Anything that goes in to making a product): raw materials wages (labor) land Price of Inputs increases Supply Decreases Price of Inputs decreases Supply increases
2. The number of firms in the industry Examples: Businesses opening & closing # of Businesses increases Supply Increases # of Businesses decreases Supply decreases In a free-market economy, sellers enter and leave all the time
3. Taxes increase Supply decreases
4. Technology Any increase in technology with increase supply
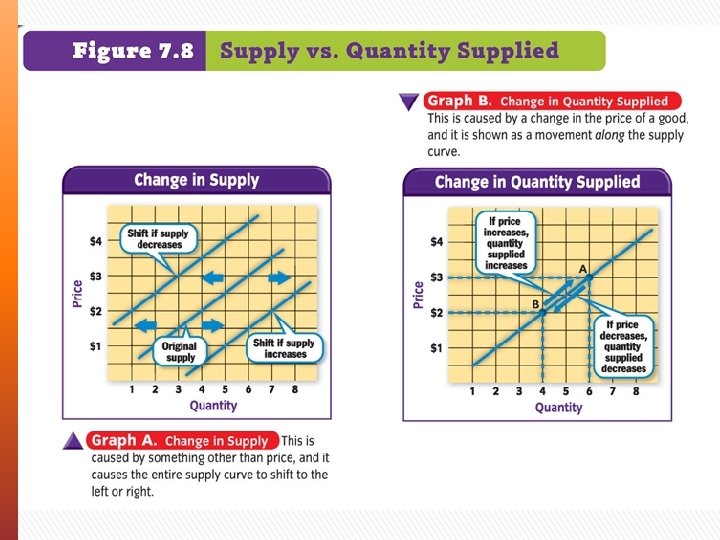
» MOVING THE SUPPLY LINE ˃ CHANGE IN SUPPLY + Caused by something other than a change in price + Shift of the WHOLE Supply Curve – SUPPLY INCREASE line shifts RIGHT – SUPPLY DECREASE line shifts LEFT » MOVING ALONG THE SUPPLY LINE ˃ CHANGE IN QUANTITY SUPPLIED + Caused by a change in Price + Shift ALONG the Supply Curve – PRICE + /SUPPLY + = Moves Right – PRICE - /SUPPLY = Moves Left SECTION 3
» LAW OF DIMINISHING RETURNS: ˃ Adding units of ONE factor of production INCREASES total output ˃ After a certain point, the extra output will continue to increase but the rate will diminish
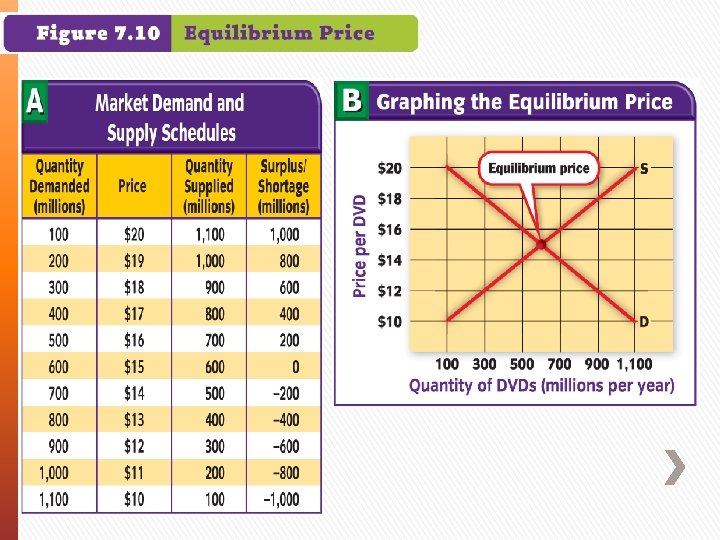
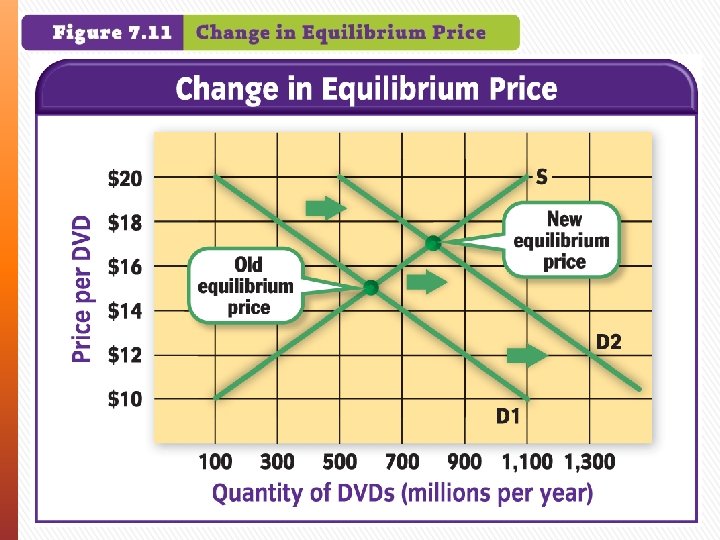
» EQUILIBRIUM PRICE: Price at which the amount producers are willing to supply is equal to the amount consumers are willing to buy ˃ Increase in Equilibrium Price + When Demand increases & Supply stays the same + When Supply decreases & Demand stays the same ˃ Decrease in Equilibrium Price + When Demand decreases & Supply stays the same + When Supply increases & Demand stays the same SECTION 4
» SHORTAGE: Quantity demanded is greater than quantity supplied at the current price » SURPLUS: Quantity supplied is greater than quantity demanded at the current price » An unrestricted market economy will eliminate shortages/surpluses on its own SECTION 4
Surplus S 1 Price Equilibrium Price Supply = Demand D 1 Quantity Shortage Graph of Equilibrium Price
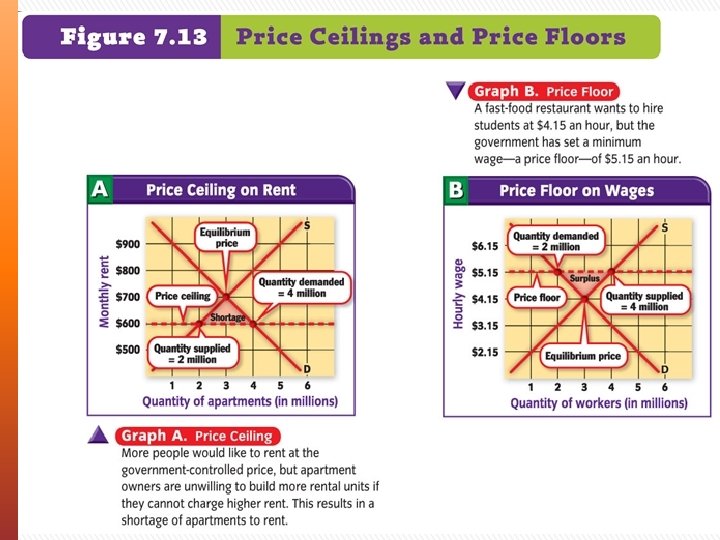
» PRICE CEILING: Legal maximum price that may be charged for a good/service ˃ RATIONING + Government limits how much of an item we can receive ˃ BLACK MARKET + Illegally high prices charged for items in short supply » PRICE FLOOR: Legal minimum price below which a good/service may not be sold ˃ More common than price ceilings + MINIMUM WAGE PRICE CONTROLS
Concept Trans 1