Demand Supply Demand Supply What is a Market


- Slides: 58
Demand Supply
Demand Supply • What is a Market? – The process of freely exchanging goods and services between buyers and sellers. • Where does the market exist? – Local Market – National Market – International Market
Demand Supply • Voluntary Exchange – A transaction in which a buyer and a seller exercise their economic freedom by working out their own terms of exchange.
Demand Supply • Demand – The amount of a good or service that consumers are able and willing to buy at various prices during a specified time period. • Quantity Demanded – The amount of a good or service that a consumer is willing and able to purchase at a specific price.
Demand Supply • Law of Demand – Economic rule stating that the quantity demanded and price move in opposite directions. Price Quantity demanded
Demand Supply • Real Income Effect – Economic rule stating that individuals cannot keep buying the same quantity of a product if its price rises while their income stays the same.
Demand Supply • Substitution Effect – Economic rule stating that if two items satisfy the same need and the price of one rises, people will buy the other.
Demand Supply • Utility – The ability of any good or service to satisfy consumer wants. • Marginal Utility – An additional amount of satisfaction.
Demand Supply • Law of Diminishing Marginal Utility – Rule stating that the additional satisfaction a consumer gets from purchasing one more unit of a product will lessen with each additional unit purchased.
Law of Diminishing Marginal Utility Double Cheeseburgers Satisfaction w/ ketchup and pickle only 1 2 3 4 5 6 7 10 10 9 7 6 3 0
Demand Supply • Demand Schedule – Table showing quantities demanded at different possible prices. • Demand Curve – Downward sloping line that shows in graph form the quantities demanded at each possible price.
Demand Schedule Price Quantity Demanded $5 10 $4 20 $3 30 $2 40 $1 50
Demand Curve Price 6 5 4 3 2 1 0 0 10 20 30 40 50 60 Quantity
Demand Supply • A change in quantity demanded is caused by a change in price and is shown as movement along the demand curve.
Demand Curve Price Change in quantity demanded 6 5 4 3 2 1 0 0 10 20 30 40 50 60 Quantity
Demand Supply • A change in demand is caused by something other than price and is shown as a shift of the entire demand curve. – A shift to the right is an increase in demand – A shift to the left is a decrease in demand
Demand Shift Price A Change in demand 6 5 4 3 2 1 0 0 10 20 30 40 50 60 Quantity
Determinants of Demand • • • Changes in Population Changes in Income Changes in Tastes and Preferences Substitutes Complementary Goods
Demand Supply • Complementary Good – A product often used with another product • Camera and Memory Cards • Peanut Butter and Jelly • Golf Balls and Golf Clubs
Demand Supply • Elasticity – Consumers’ responsiveness to an increase or decrease in price of a product. • Price elasticity of demand – Economic concept that deals with how much demand varies according to changes in price.
Demand Supply • We can determine price elasticity of demand with the following formula: Price elasticity of demand = (Q 2 – Q 1) / [ (Q 1 + Q 2) / 2] (P 2 – P 1) / [ (P 1 + P 2 ) / 2] • If the answer is less than one it is said to be inelastic, and if it is greater than one it is elastic.
Demand Supply • Examples: Insulin Orange Juice • • Q 1 = 12 injections per week Q 2 = 14 injections per week P 1 = $20. 00 per injection P 2 = $10. 00 per injection Q 1 = 1 quart per week Q 2 = 3 quarts per week P 1 = $2. 50 per quart P 2 = $2. 25 per quart
Demand Supply • Elastic Demand – Situation in which the rise or fall in a product’s price greatly affect the amount that people are willing to buy.
Elastic Demand
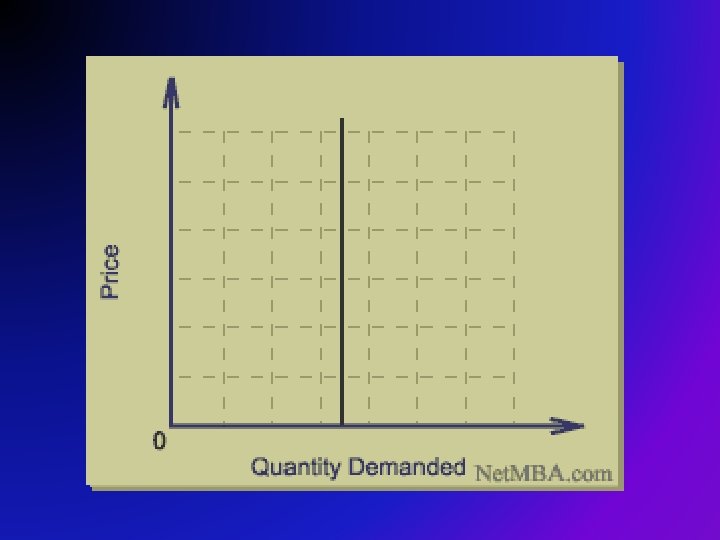
Demand Supply • Inelastic Demand – Situation in which a product’s price change has little impact on the quantity demanded by consumers.
• Demand is a consumer based analogy of how market interactions take place. • Supply, on the other hand, is a producer based analogy of market interacitons.
Demand Supply • Supply – The amount of a good or service that producers are able and willing to sell at various prices during a specified time period. • Quantity Supplied – The amount of a good or service that a producer is willing and able to supply at a specific price.
Demand Supply • Law of Supply – Economic rule stating that price and quantity supplied move in the same direction. Price Quantity supplied
Demand Supply • Supply Schedule – Table showing quantities supplied at different possible prices. • Supply Curve – Upward-sloping line that shows in graph form the quantities supplied at each possible price.
Supply Schedule Price Quantity Supplied $1 10 $2 20 $3 30 $4 40 $5 50
Supply Curve Price 6 5 4 3 2 1 0 0 10 20 30 40 50 60 Quantity
Demand Supply • A change in quantity supplied is caused by a change in price and is shown as movement along the supply curve.
Supply Curve Price 6 5 4 3 2 1 A change in quantity supplied 0 0 10 20 30 40 50 60 Quantity
Demand Supply • A change in supply is caused by something other than price and is shown as a shift of the entire supply curve. – A shift to the right is an increase in supply – A shift to the left is a decrease in supply
Supply Curve Price 6 5 4 3 2 1 0 0 10 20 30 40 50 60 Quantity
Determinants of Supply • • Price of Inputs Number of Firms in the Industry Taxes Technology
Law of Diminishing Returns • Economic rule that says as more units of a factor of production are added to other factors of production, after some point total output continues to increase but at a diminishing rate.
Workers Total output 1 2 3 2 5 9 4 5 6 7 8 9 10 11 14 20 25 29 33 36 38 40 • Change in Output • 3 • 4 • 5 • 6 • 5 • 4 • 3 • 2
Demand Supply • In the real world, demand supply operate together. As the price of a good goes down, the quantity demanded rises and the quantity supplied falls. As the price goes up, the quantity demanded falls and the quantity supplied rises.
Demand Supply • Equilibrium price – The price at which the amount producers are willing to supply is equal to the amount consumers are willing to buy.
Quantity Demanded Price Quantity Supplied 10 20 30 40 50 $5 $4 $3 $2 $1 50 40 30 20 10
Price 6 5 4 3 2 1 0 0 10 20 30 40 50 60 Quantity
Price 6 5 4 3 2 1 0 0 10 20 30 40 50 60 Quantity
Demand Supply • Shortage – Situation in which the quantity demanded is greater than the quantity supplied at the current price. • Surplus – Situation in which the quantity supplied is greater than the quantity demanded at the current price.
Price 6 5 Surplus 4 3 Shortage 2 1 0 0 10 20 30 40 50 60 Quantity
Demand Supply • Price ceiling – A legal maximum price that may be charged for a particular good or service.
Government Set Prices P $1, 200 P 0 S ceiling 800 PC D Shortage Qs LO 5 Q 0 Qd Q 3 -49
Demand Supply • Price floor – A legal minimum price below which a good or service may not be sold.
Government Set Prices P S Surplus floor $7. 25 Pf 5. 00 P 0 D Q Qd LO 5 Q 0 Qs 3 -51
Demand Supply • Rationing – The distribution of goods and services based on something other than price. • Black market – “underground” or illegal market in which goods are traded at prices above their legal maximum prices or in which illegal goods are sold.
• Draw a demand schedule and demand curve for Books. The price range is $10 $20 and your price change is $1 each time. Quantity Demanded is 100 – 1100 units, change by 100 each time. • Draw a supply schedule and supply curve for Books. The price range is $10 - $20 and your price change is $1 each time. Quantity supplied is 100 – 1100 units, change by 100 each time.
• Draw a Demand & Supply Schedule and draw a Demand & Supply Curve for each of the following: • Digital Cameras – Price range $50 to $250 (increase by 25) – Quantity 100, 000 to 500, 000 (increase by 50, 000) • Pizza slices – Price $1 - $7 (increase by $1) – Quantity 1 – 7 (increase by 1) • Candy bars – Price. 50 to $3. 00 (increase by. 25) – Quantity 5 – 55 (increase by 5)