Development of NGA networks in Montenegro MORE CONNECTED

- Slides: 19
Development of NGA networks in Montenegro MORE CONNECTED FOR BETTER LIFE IRC, Ohrid 21 – 22 May 2019 Vitomir Dragaš
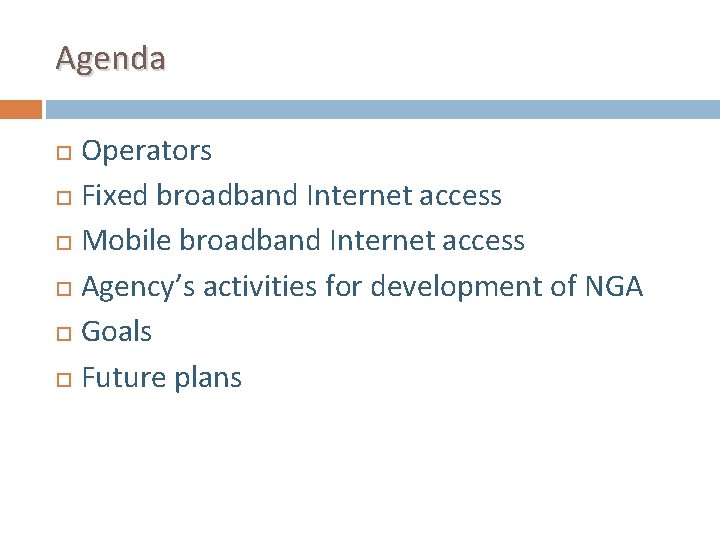
Agenda Operators Fixed broadband Internet access Mobile broadband Internet access Agency’s activities for development of NGA Goals Future plans
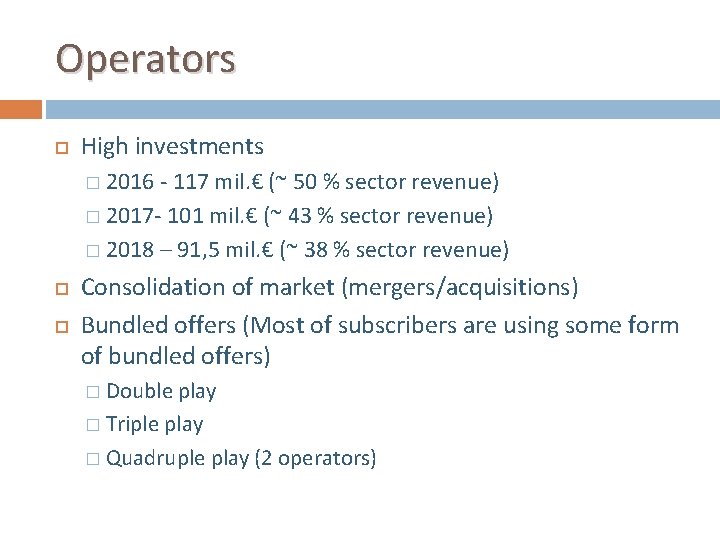
Operators High investments � 2016 - 117 mil. € (~ 50 % sector revenue) � 2017 - 101 mil. € (~ 43 % sector revenue) � 2018 – 91, 5 mil. € (~ 38 % sector revenue) Consolidation of market (mergers/acquisitions) Bundled offers (Most of subscribers are using some form of bundled offers) Double play � Triple play � Quadruple play (2 operators) �
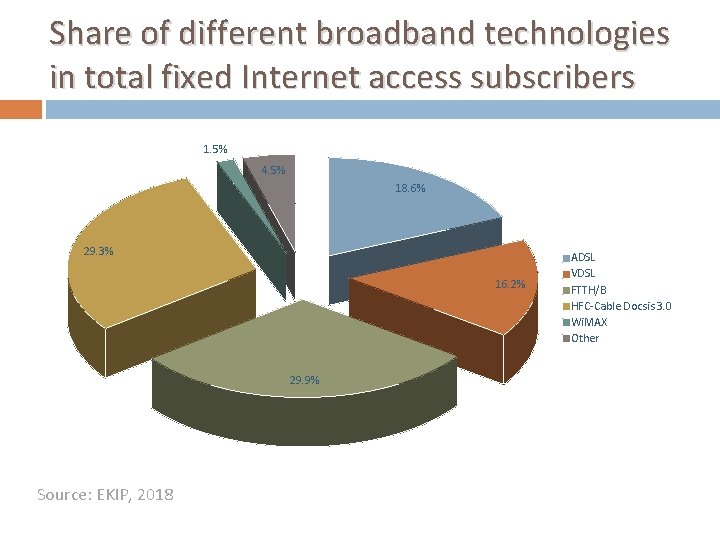
Share of different broadband technologies in total fixed Internet access subscribers 1. 5% 4. 5% 18. 6% 29. 3% 16. 2% 29. 9% Source: EKIP, 2018 ADSL VDSL FTTH/B HFC-Cable Docsis 3. 0 Wi. MAX Other
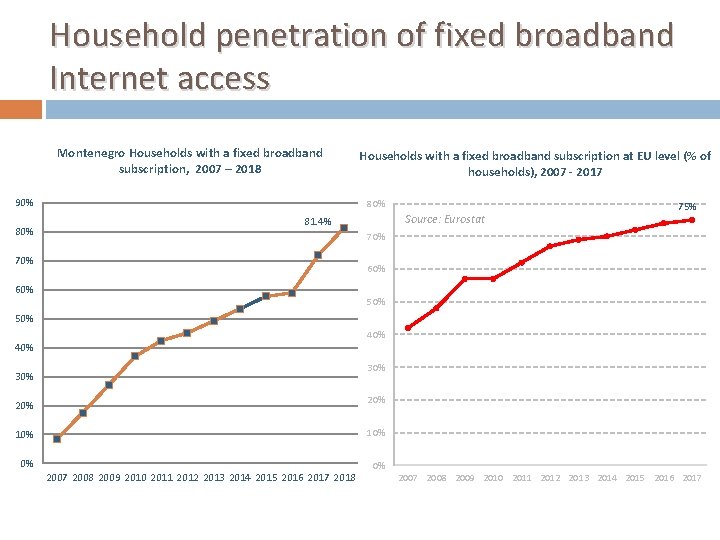
Household penetration of fixed broadband Internet access Montenegro Households with a fixed broadband subscription, 2007 – 2018 90% 80% Households with a fixed broadband subscription at EU level (% of households), 2007 - 2017 80% Source: Eurostat 81. 4% 75% 70% 60% 50% 40% 30% 20% 10% 0% 2007 2008 2009 2010 2011 2012 2013 2014 2015 2016 2017 2018 0% 2007 2008 2009 2010 2011 2012 2013 2014 2015 2016 2017
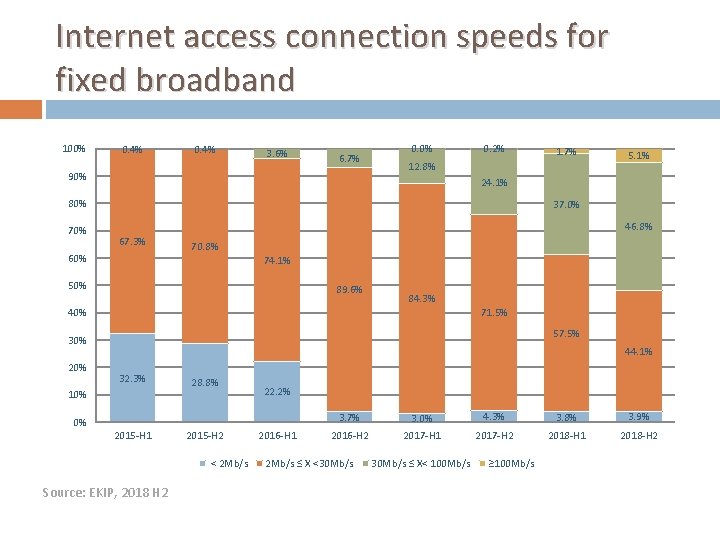
Internet access connection speeds for fixed broadband 100% 0. 4% 3. 6% 6. 7% 90% 0. 2% 12. 8% 37. 0% 46. 8% 67. 3% 60% 70. 8% 74. 1% 50% 89. 6% 84. 3% 71. 5% 40% 57. 5% 30% 20% 5. 1% 24. 1% 80% 70% 1. 7% 44. 1% 32. 3% 10% 28. 8% 22. 2% 0% 2015 -H 1 2015 -H 2 < 2 Mb/s Source: EKIP, 2018 H 2 2016 -H 1 3. 7% 3. 0% 4. 3% 3. 8% 3. 9% 2016 -H 2 2017 -H 1 2017 -H 2 2018 -H 1 2018 -H 2 2 Mb/s ≤ X <30 Mb/s ≤ X< 100 Mb/s ≥ 100 Mb/s
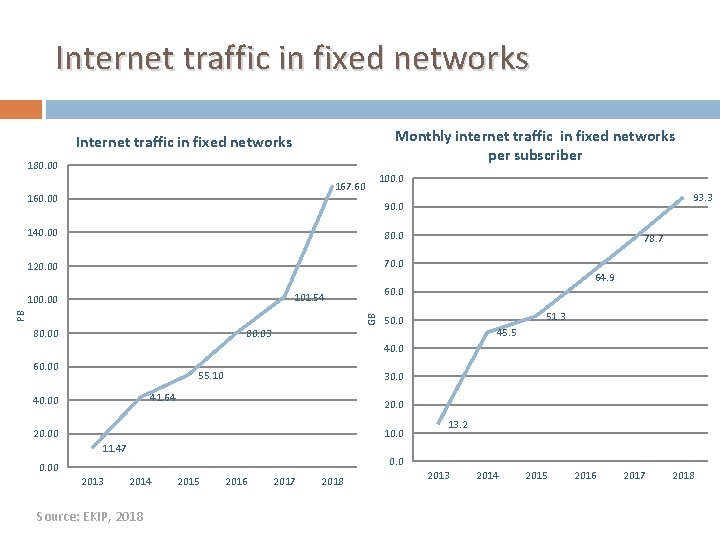
Internet traffic in fixed networks Monthly internet traffic in fixed networks per subscriber Internet traffic in fixed networks 180. 00 167. 60 160. 00 100. 0 93. 3 90. 0 140. 00 80. 0 120. 00 70. 0 78. 7 64. 9 60. 0 101. 54 GB PB 100. 00 80. 03 80. 00 51. 3 50. 0 45. 5 40. 0 60. 00 55. 10 30. 0 41. 64 40. 00 20. 0 10. 0 20. 00 11. 47 0. 00 2013 13. 2 2014 Source: EKIP, 2018 2015 2016 2017 2018 2013 2014 2015 2016 2017 2018
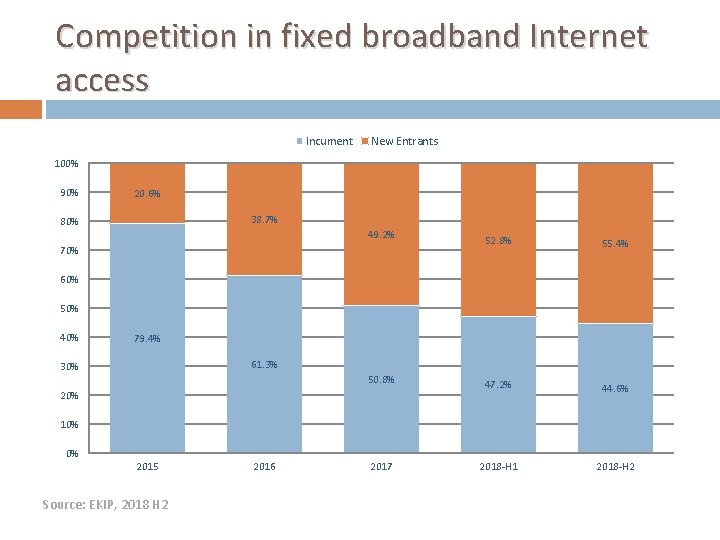
Competition in fixed broadband Internet access Incument New Entrants 100% 90% 20. 6% 38. 7% 80% 49. 2% 52. 8% 55. 4% 50. 8% 47. 2% 44. 6% 2017 2018 -H 1 2018 -H 2 70% 60% 50% 40% 79. 4% 61. 3% 30% 20% 10% 0% 2015 Source: EKIP, 2018 H 2 2016
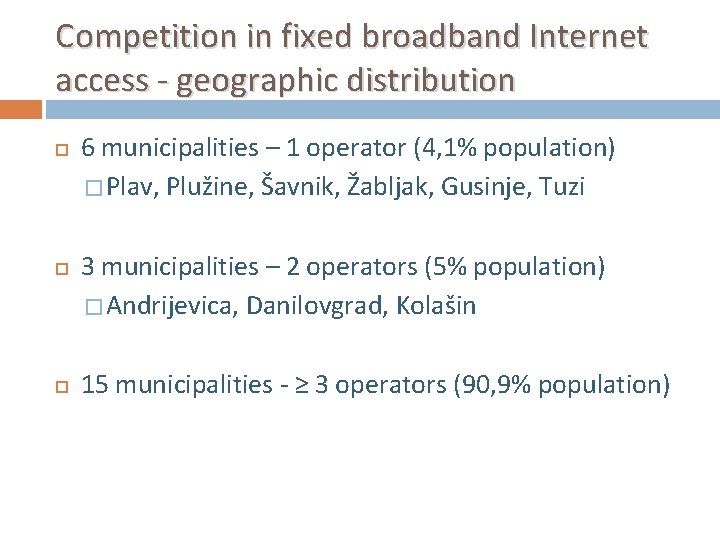
Competition in fixed broadband Internet access - geographic distribution 6 municipalities – 1 operator (4, 1% population) � Plav, Plužine, Šavnik, Žabljak, Gusinje, Tuzi 3 municipalities – 2 operators (5% population) � Andrijevica, Danilovgrad, Kolašin 15 municipalities - ≥ 3 operators (90, 9% population)
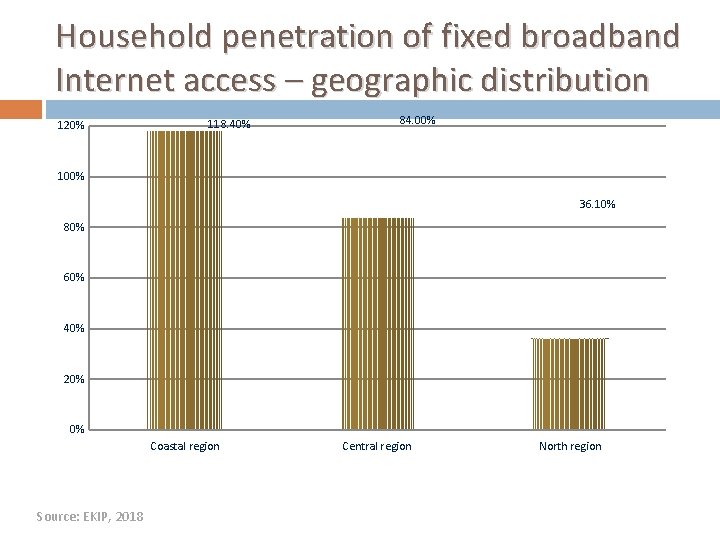
Household penetration of fixed broadband Internet access – geographic distribution 120% 118. 40% 84. 00% 100% 36. 10% 80% 60% 40% 20% 0% Coastal region Source: EKIP, 2018 Central region North region
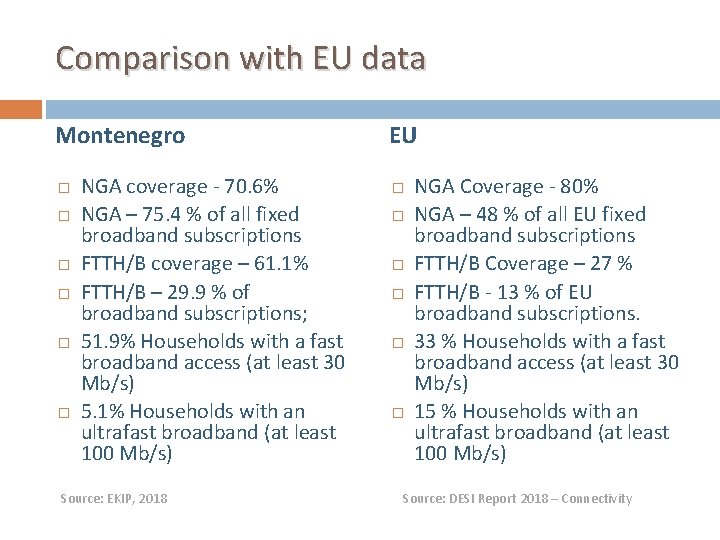
Comparison with EU data Montenegro NGA coverage - 70. 6% NGA – 75. 4 % of all fixed broadband subscriptions FTTH/B coverage – 61. 1% FTTH/B – 29. 9 % of broadband subscriptions; 51. 9% Households with a fast broadband access (at least 30 Mb/s) 5. 1% Households with an ultrafast broadband (at least 100 Mb/s) Source: EKIP, 2018 EU NGA Coverage - 80% NGA – 48 % of all EU fixed broadband subscriptions FTTH/B Coverage – 27 % FTTH/B - 13 % of EU broadband subscriptions. 33 % Households with a fast broadband access (at least 30 Mb/s) 15 % Households with an ultrafast broadband (at least 100 Mb/s) Source: DESI Report 2018 – Connectivity
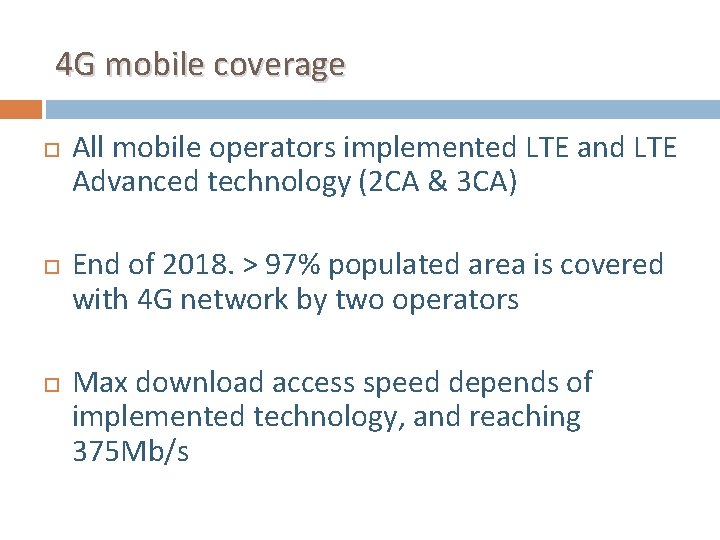
4 G mobile coverage All mobile operators implemented LTE and LTE Advanced technology (2 CA & 3 CA) End of 2018. > 97% populated area is covered with 4 G network by two operators Max download access speed depends of implemented technology, and reaching 375 Mb/s
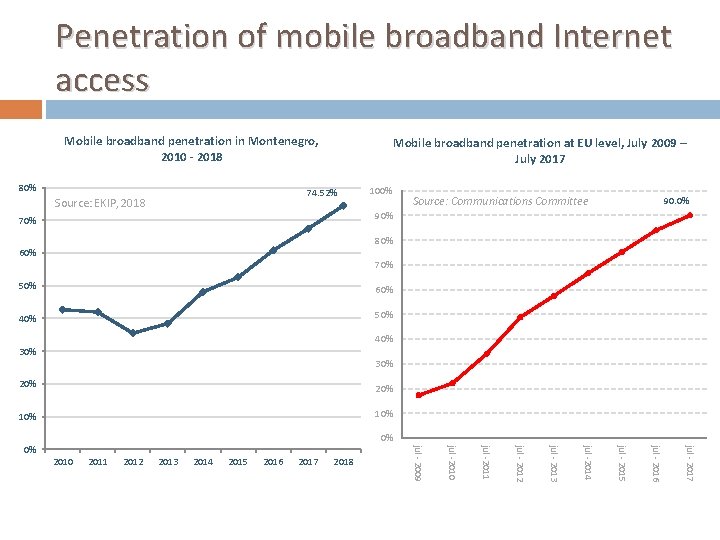
Penetration of mobile broadband Internet access Mobile broadband penetration in Montenegro, 2010 - 2018 80% Mobile broadband penetration at EU level, July 2009 – July 2017 74. 52% Source: EKIP, 2018 100% Source: Communications Committee 90. 0% 90% 70% 80% 60% 70% 50% 60% 40% 50% 40% 30% 20% 10% 0% 2018 jul - 2017 jul - 2016 jul - 2015 jul -2014 jul - 2013 jul - 2012 jul -2011 jul -2010 jul - 2009 0%
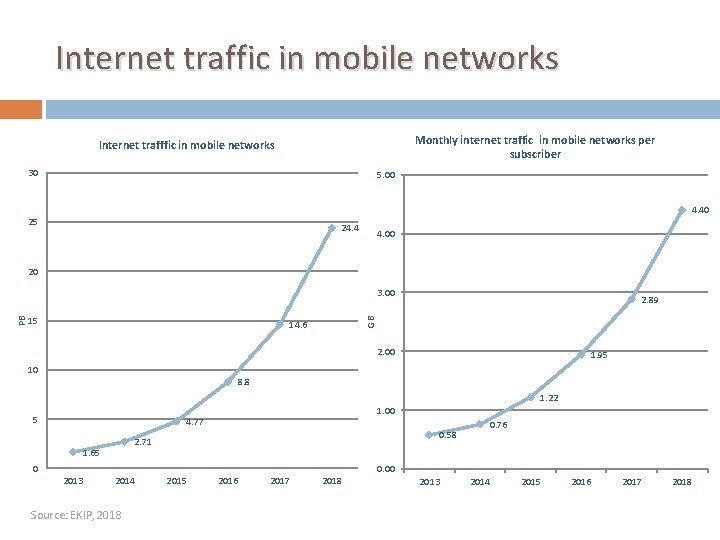
Internet traffic in mobile networks Monthly internet traffic in mobile networks per subscriber Internet trafffic in mobile networks 30 5. 00 4. 40 25 24. 4 4. 00 20 15 2. 89 GB PB 3. 00 14. 6 2. 00 10 1. 95 8. 8 1. 22 5 1. 00 4. 77 0. 58 2. 71 1. 65 0 2013 2014 Source: EKIP, 2018 2015 2016 2017 2018 0. 76 0. 00 2013 2014 2015 2016 2017 2018
Agency’s activities for development of NGA Shared use of electronic communications infrastructure (regulatory control of condition for use) Conditions for building electronic communications networks and infrastructures (Rulebooks and Recommendations on spatial planning documents) Establishing MIXP Mapping of electronic communications infrastructure Monitor of Qo. S for Internet access service Strengthening competition
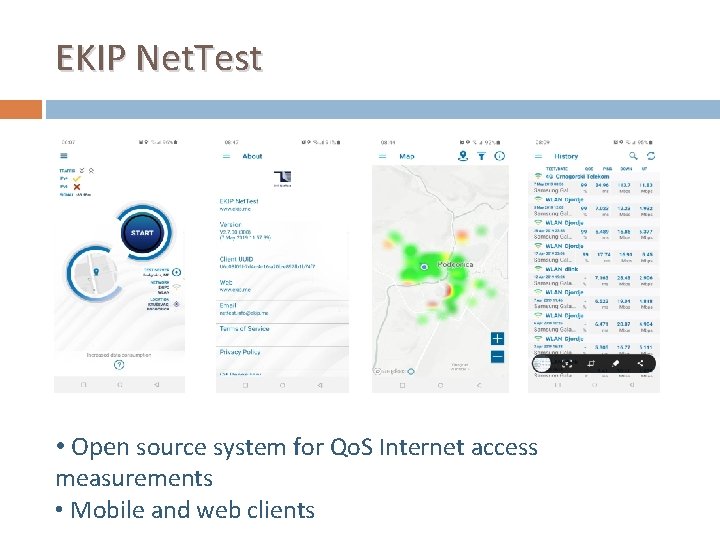
EKIP Net. Test • Open source system for Qo. S Internet access measurements • Mobile and web clients
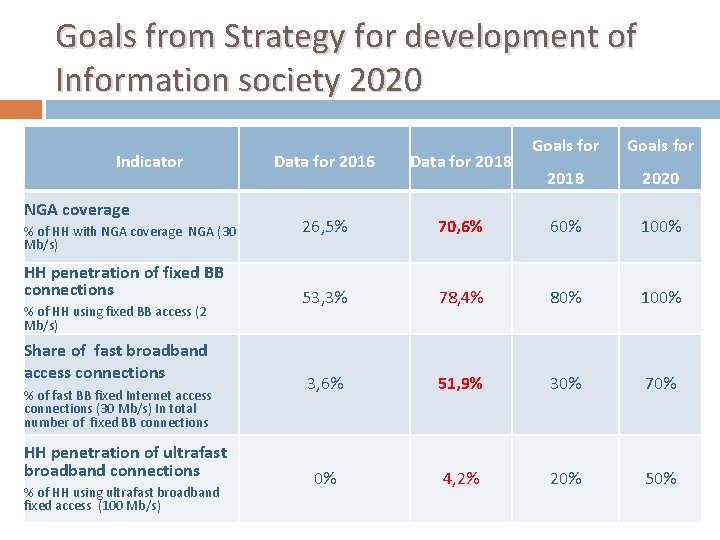
Goals from Strategy for development of Information society 2020 Indicator NGA coverage % of HH with NGA coverage NGA (30 Mb/s) HH penetration of fixed BB connections % of HH using fixed BB access (2 Mb/s) Share of fast broadband access connections % of fast BB fixed Internet access connections (30 Mb/s) In total number of fixed BB connections HH penetration of ultrafast broadband connections % of HH using ultrafast broadband fixed access (100 Mb/s) Goals for 2018 2020 Data for 2016 Data for 2018 26, 5% 70, 6% 60% 100% 53, 3% 78, 4% 80% 100% 3, 6% 51, 9% 30% 70% 0% 4, 2% 20% 50%
Future plans Strategy for development of information society 2020. Coverage of fast broadband access >30 Mb/s - 100% population 2020. � 50% of households should be subscribed to ultrafast broadband access >100 Mb/s - 2020. � Mapping of broadband access Ministry of economy prepared draft Law on measures to reduce the cost of deploying highspeed electronic communications networks - Directive 2014/61/EU
Thank you! www. ekip. me vitomir. dragas@ekip. me