Determining the Sharp Longitudinal Gradients in Equatorial Ex


 tides are thought to originate in the troposphere")


")


 satellite is in a 13 degree inclination orbit")
![Ex. B Drift Velocity [m/sec] 70 PHILIPPI NES INDONES IA The steep longitude gradient](https://slidetodoc.com/presentation_image_h2/c8829d17f06cccc2558a72ac1f116ade/image-12.jpg "Ex. B Drift Velocity [m/sec] 70 PHILIPPI NES INDONES IA The steep longitude gradient")
![Ex. B Drift Velocity [m/sec] 50 PHILIPPI NES INDONES IA All 3 days have](https://slidetodoc.com/presentation_image_h2/c8829d17f06cccc2558a72ac1f116ade/image-13.jpg "Ex. B Drift Velocity [m/sec] 50 PHILIPPI NES INDONES IA All 3 days have")


 theoretical, time-dependent ionospheric model has been used to calculate")


![Ex. B Drift [m/s] Ion Density [cm-3] Ion Density Ex. B Drift](https://slidetodoc.com/presentation_image_h2/c8829d17f06cccc2558a72ac1f116ade/image-25.jpg "Ex. B Drift [m/s] Ion Density [cm-3] Ion Density Ex. B Drift")
- Slides: 26
Determining the Sharp, Longitudinal Gradients in Equatorial Ex. B Drift Velocities Associated with the 4 -cell, Non-migrating Structures David Anderson and Eduardo A. Araujo-Pradere ( Univ. of Colorado/CIRES and NOAA/SWPC) Acknowledgements: Endawoke Yizengaw and Cesar Valladares (Institute for Scientific Research, Boston College)
Outline • Observations of the 4 -cell, non-migrating, longitude structures • TOPEX/TEC observations of the 4 -cell pattern and magnetometer-inferred Ex. B drift velocities at one of the boundaries • Quantifying the sharp longitude gradients in Ex. B drift velocities at the cell boundaries using C/NOFS satellite observations • Modeling the daytime, equatorial ion densities associated with the sharp longitude gradients in Ex. B drift • LISN magnetometer-inferred Ex. B drift velocities observed in the Jicamarca and Alta Floresta longitude sectors • Summary and future work
Diurnal, eastward propagating, non-migrating (DE 3) tides are thought to originate in the troposphere through latent heat release and to be responsible for the 4 -cell, non-migrating structures observed in the equatorial ionosphere… Observations of the 4 -cell structures Nighttime IMAGE 135. 6 nm radiances from O+ radiative recombination (Immel et al. , 2006) IMAGE = Imager for Magnetopause-to. Aurora Global Exploration. Noontime, magnetometer-observed equatorial electrojet current density vs longitude from CHAMP, SAC-C and Oersted satellites (England et al. , 2006)
Upward Ex. B Drift Velocity vs Geographic Longitude from ROCSAT-1 Satellite Between 1000 and 1100 LT (Kil et al. , 2007)
Theoretically-calculated Vertical Ex. B Drift Velocity vs Longitude and Local Time from TIMEGCM Model (England et al. , 2010)
Solar Energy Budget (from Kerri Cahoy’s ISEA talk)
Possible Mechanism that Accounts for the 4 -cell Structure – Tropical Latent Heat Release in the Troposphere from Kerri Cahoy’s ISEA talk
Ground-based, Magnetometer-Inferred Daytime Vertical Ex. B Drift Velocities Peruvian sector Philippine sector
Location of the Magnetometers Peruvian Sector Jicamarca (Geog. 11. 92 o S; 283. 13 o E Geomag. 0. 8 o N) Piura (Geog. 5. 18 o S; 279. 36° E Geomag. 6. 8 o N) Philippine and Indonesian Sectors Davao (Geog. 7 o N; 125. 4 o E Geomag. 1. 32 o S) Yap (Geog. 9. 3 o N; 138. 5 o E Geomag. 0. 5 o N) Muntinlupa (Geog. 14. 37 o N; 121. 02 o E Geomag. 6. 39 o N) Biak (Geog. 1. 08 o S; 136. 0 o E Geomag. 9. 74 o S) Indian Sector THIRUNELVELI (Geog. 8. 70 o N; 76. 95 o E Geomag. 0. 46 o S) ALIBAG (Geog. 18. 62 o N; 72. 87 o E Geomag. 10 o N)
Quantifying the Daytime, Equatorial Ex. B Drift Velocities Associated with the 4 -cell, Non-migrating Tidal Structures E x B drift [m/s] C/NOFS VEFI and IVM sensors will determine the longitude gradients in Ex. B drift velocities at each of the 4 cell boundaries INDONESIA Sharp longitude gradients in Ex. B drift velocity are responsible for sharp gradients in TOPEX/TEC between the Philippine and Indonesian sectors PHILIPPINES Local Time
The Communication/Navigation Outage Forecast System (C/NOFS) satellite is in a 13 degree inclination orbit and the Ion Velocity Meter (IVM) has been used to obtain the sharp longitude gradients in Ex. B drift velocities at the boundaries of the 4 cell structures, on a day-to-day basis C/NOFS Ion Velocity Meter (IVM) Constraints • IVM observations between 1000 and 1300 LT • Approximate LT window for maximum Ex. B drift velocity • IVM observations below 500 km • Low enough altitude so that O+ is the major ion • Observations are averaged over each degree of longitude • Due to this averaging, sharp “spikes” in Ex. B drift may be introduced. These will be analyzed at a later time, on a case by case basis • IVM observations for 2009 • Primarily the months of October, March and December Satellite and Payload
Ex. B Drift Velocity [m/sec] 70 PHILIPPI NES INDONES IA The steep longitude gradient in Ex. B drift velocity at the cell boundary in the Peruvian sector IVM March 23 -25, 2009 (10: 00 - 13: 00 LT) Peruvian Sector 60 March 23 (82) March 24 (83) March 25 (84) 50 40 Longitude gradient in Ex. B drift ~ - 4 m/sec/degree 30 20 10 0 -10 -20 260 270 280 290 300 Geographic Longitude 310 320
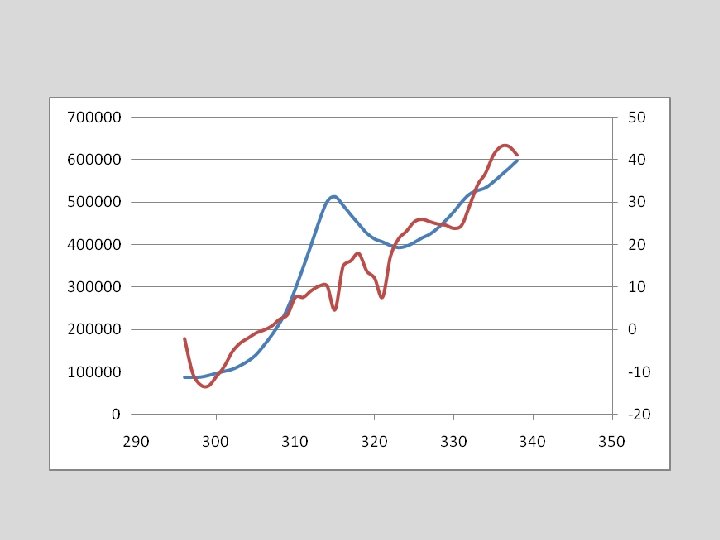
Ex. B Drift Velocity [m/sec] 50 PHILIPPI NES INDONES IA All 3 days have equivalent slopes and they delineate the increase in Ex. B drift velocity across the Atlantic sector IVM October 5 -7, 2009 (10: 00 - 13: 00 LT) Atlantic Sector 40 30 Longitude gradient in Ex. B drift ~ 1 m/sec/degree Oct 5 (278) Oct 6 (279) Oct 7 (280) 20 10 0 290 -10 300 310 320 330 Geographic Longitude 340 350
The combination of upward, daytime Ex. B drift velocity perpendicular to B and downward diffusion parallel to B by gravity and pressure gradient forces create crests in ionization at +/- 15 to 18 degrees magnetic latitude known as the equatorial anomaly. If the daytime, Ex. B drift velocities are significantly lower or are absent, then the crests in ionization are significantly closer to the magnetic equator or are absent Low Latitude Transport Mechanisms
IVM-observed Ex. B Drift Velocity and Ion Density vs Geographic Longitude on March 23, 2009 in the Peruvian Longitude Sector EQUINOX Ion Density Ex. B Drift Ion Density [cm-3] Ex. B Drift [m/s] Geographic Longitude
IVM-observed Ex. B Drift Velocity and Ion Density vs Geographic Longitude on Oct. 7, 2009 in the Atlantic Longitude Sector EQUINOX Ion Density [cm-3] Ex. B Drift [m/s] Ion Density Ex. B Drift Geographic Longitude
The Global Ionosphere Plasmasphere (GIP) theoretical, time-dependent ionospheric model has been used to calculate ion densities as a function of altitude, latitude, longitude and local time in the Peruvian and Atlantic longitude sectors to demonstrate the effects of sharp longitude gradients in Ex. B drift velocities on calculated ion density distributions GIP-calculated Ion Densities vs Geographic Latitude and Longitude at 400 km, 1400 LT Incorporating the Scherliess-Fejer Climatological Ex. B Drift Velocities x 1. 5 (Control run)
GIP-calculated Ion Densities vs Geographic Latitude and Geographic Longitude at 400 km and 1400 LT Incorporating the IVM-observed Ex. B Drift Velocities between 280 o and 340 o Geog. Long, beginning at 10: 00 LT
Comparing Magnetometer-inferred, Vertical Ex. B Drift Velocities Between Jicamarca and Alta Floresta Longitude Sectors • Critical to determine Alta Floresta’s dip latitude • We are making the assumption that it is within a degree of the dip equator • We assume a linear relationship between delta H values and Ex. B drift velocities • Choose JULIA 150 km echo observations of vertical Ex. B drift velocity vs local time for April 9, 2011 • Compared the JULIA Ex. B drifts with the Jicamarca-Piura delta H values for April 9, 2011 • Assuming a linear relationship, we determined that a linear slope of 0. 31 m/sec/n. T gave the best agreement between magnetometer-inferred Ex. B drift velocities and the JULIA observed Ex. B drift velocities • We applied this slope to the September, 2011 Jicamarca-Piura and the Alta Floresta-Cuiaba delta H values to determine Ex. B drifts
Delta H Comparisons Between Jicamarca and Alta Floresta Longitude Sectors for September 2 and 16 Assuming an Ex. B vs delta H linear slope of 0. 31 m/sec/n. T, the peak Ex. B drift velocity for Jicamarca-Piura is ~ 28 m/sec and for Alta Floresta-Cuiaba is ~6. 5 m/sec. On September 16, the peak Ex. B drift velocity is ~ 31 m/sec in the Jicamarca longitude sector and ~ 13 m/sec in the Alta Floresta longitude sector.
Delta H Comparison for a Geomagnetically Disturbed Day on September 17
Summary and Future Work • Very sharp longitude gradients in daytime, vertical Ex. B drift velocities are observed by the C/NOFS IVM sensor at the boundaries of the 4 -cell, non-migrating ionospheric structures • These sharp gradients occur on a day-to-day basis • Incorporating these Ex. B drift velocities into a theoretical, timedependent ionospheric model produces sharp longitude gradients in calculated ion densities and TEC values • Sharp longitude gradients in Ex. B drifts are also observed from groundbased magnetometer measurements between the Jicamarca longitude sector (284 E. geog. long. ) and the Alta Floresta longitude sector ( 304 E. geog. long. ) • Do the LISN chains of GPS receivers observe sharp longitude gradients in observed TEC values? • Related to the 4 -cell boundary between the Peruvian and Brazilian sectors, the major advantage of LISN is the ability to obtain continuous, day-to-day observations of TEC and Ex. B drifts to determine seasonal changes and whether these occur gradually or abruptly
Q&A
Ex. B Drift [m/s] Ion Density [cm-3] Ion Density Ex. B Drift