Demand Supply and Price Analysis Meanings and Definition


 Willingness and ability to pay. Demand is the amount")


 � � Changes in population: If the population of a country increase")
 � � Changes in tastes: Demand for a commodity may change due")
 � � Changes in income: When the income of consumers increases generally")
 Changes in the distributions of wealth: � If an equal distribution of")
 � The total quantity of goods demanded is also affected by the")


 Changes in Factor Price. � � � The rise of fall in supply")
 � � Changes in Technique. The supply of a commodity may also")
 Improvement in the Means of Transport. �The supply of the commodity may also")
 Climatic Changes in case of Agricultural Products. � � The supply of")
 � � � Political Changes. The increase or decrease in supply may")
 � � � Taxation Policy. If a government levies heavy taxes on")
 Goals of firms. If the firms expect higher profits in the future, they")


- Slides: 29
Demand, Supply and Price Analysis � Meanings and Definition of Demand: word 'demand' is so common and familiar with every one of us that it seems superfluous to define it. � The need for precise definition arises simply because it is sometimes confused with other words such as desire, wish, want, etc.
� Demand in economics means a desire to possess a good supported by willingness and ability to pay for it. � � If you have a desire to buy a certain commodity, say a car, but you do not have the adequate means to pay for it, it will simply be a wish, a desire or a want and not demand. Demand is an effective desire, i. e. , a desire which is backed by willingness and ability to pay for a commodity in order to obtain it.
In the words of Prof. Hibdon: �"Demand means the various quantities of goods that would be purchased per time period at different prices in a given market".
Characteristics of Demand: � (i) Willingness and ability to pay. Demand is the amount of a commodity for which a consumer has the willingness and also the ability to buy. � (ii) Demand is always at a price. If we talk of demand without reference to price, it will be meaningless. The consumer must know both the price and the commodity. He will then be able to tell the quantity demanded by him. � (iii) Demand is always per unit of time. The time may be a day, a week, a month, or a year.
� Example: � For instance, when the milk is selling at the rate of Tk 60 per liter, the demand of a buyer for milk is 1 liter a day. � If we do not mention the period nobody can guess as to how much consume? It is just possible we consuming ten liters of milk a week, or a year. of time, milk we may be a month
Factors of Changes in Demand: Or Determinants of Demand: � While explaining the law of demand, we have stated that, other things remaining the same (cetris paribus), the demand for a commodity inversely with price per unit of time. � The other things have an important bearing on the demand for a commodity. � They bring about changes in demand independently of changes in price. These non- price factors shift factors or determinants which influence demand are as follow:
� (i) � � Changes in population: If the population of a country increase account of immigration or through high birth rate or on account of these factors, The demand for various kinds of goods will increase even the prices remains the same. The demand curve will shift upward to the right. � The nature of the commodities demanded will depend up to taste of the consumers. If due to high net production rate, the percentages of children to the total population increases in a country, there will greater demand for toys, children food, etc. � Similarly, if the percent aged people to the total population increases, the demand for walking sticks, artificial teeth, invalid chairs, etc. will increase.
� (ii) � � Changes in tastes: Demand for a commodity may change due to changes in tastes and fashions. For example, people develop a taste for coffee. There is then a decrease in the demand for tea. The demand curve for tea shifts to the left of the original demand curve. � Similarly women's fashions are usually ever changing. Sometime they keep hair long and sometime short. So, whenever there is a change in their hair style, the demand for hairpins, hair nets, etc. is greatly affected.
� (iii) � � Changes in income: When the income of consumers increases generally leads to an increase in the demand for some commodities and a decrease in the demand for other commodities. For example, when income of people increases, they begin to spend money on those which were previously regarded by them as luxuries, or semi -luxuries and reduce the expenditure on inferior goods. � Take the case of a man whose income has increased from Tk 10, 000 to Tk 20, 000 per month. His consumption of wheat will go down because he now spends more money on the superior food such as cake, fish, daily products, fruits, etc.
� (iv) Changes in the distributions of wealth: � If an equal distribution of wealth is brought about in a country, then there will be less demand for expensive luxuries goods. There will be more demand for necessaries and comfort items. � (v) � Changes in the price of substitutes: if the price of a particular commodity rises, people may stop further purchase of that commodity and spend money on its substitute which is available at a lower price. Thus we find, a change in demand can also be brought about by a change in the price of the substitute.
� (vi) � The total quantity of goods demanded is also affected by the cyclical fluctuations in economic activities. If the trade is prosperous, the demand for raw material, machinery, etc. , increases. If on the other hand, the trade period is dull, the demand for, producer's goods will fail sharply as compared to the demand for consumer goods. � (vii) � Changes in the state of trade: Climate and weather conditions: The climate and weather conditions have an important bearing on the demand of a commodity. For instance, the consumer's demand for woolen clothes increases in winter and decreases in summer.
Definition of Supply: � Supply is of the scarce goods. It is the amount of a commodity that sellers are able and willing to offer for sale at different price per unit of time. � In the words of Meyer: � “Supply is a schedule of the amount of a good that would be offered for sale at all possible price at any period of time; e. g. , a day, a week, and so on”.
Definition of Law of Supply: � There is direct relationship between the price of a commodity and its quantity offered for sale over a specified period of time. � When the price of a goods rises, other things remaining the same, its quantity which is offered for sale increases as and price falls, the amount available for sale decreases. This relationship between price and the quantities which suppliers are prepared to offer for sale is called the law of supply
Factor of Changes in Supply: � When the supply of the commodity rises or falls due to non-price determinants, the supply is said to have increased supply or decreased supply. � The increases or decrease or the rise or fall in supply may take place on account of various factors.
i) Changes in Factor Price. � � � The rise of fall in supply may take place due to changes in the cost of production of a commodity. If the prices of various factor of production used in the production of a particular commodity increase of it total cost of production. There will be reduction in the supply of that commodity at each price because the amount demanded decreases with a rise in price. Conversely, if the prices of the various factors of production fall down, it will result in lowering the cost of production and so an increase in the supply on varying prices.
� (ii) � � Changes in Technique. The supply of a commodity may also be affected by progress in technique. If an improvement in technique takes place in a particular industry, it will help in reducing its cost of production. This will result in greater production and so an increase in the supply of the commodity. The supply curve will shifts to the right of the original supply curve.
�(iii) Improvement in the Means of Transport. �The supply of the commodity may also increase due to improvement in the means of communication and transport. If the means of transport are cheap and fast, then supply of the commodity can be increased at a short notice at lower price. �
� (iv) Climatic Changes in case of Agricultural Products. � � The supply of agricultural products is directly affected by the weather conditions and the use of the better methods of production. If rain is timely plentiful well-distributed; and improve methods of cultivation are employed then other things remaining the same, there will be bumper crops. It would then be possible to increase the supply of the agriculture products
� (v) � � � Political Changes. The increase or decrease in supply may also place due to political disturbances in a country. If country wages wars against another country or some kind of political disturbances take place just as we had at the time of partition, then the channels of production are disorganized. It results in the decrease of certain goods the supply curve shifts to the left of originals curve.
� (vi) � � � Taxation Policy. If a government levies heavy taxes on the import of particular commodities, then the supply of these commodities is reduced at each price. The supply curve shifts to the left, conversely if the taxes on output in the country are low and government encourages the import of foreign commodities, then the supply can be increased easily. The supply curve shifts to the right of originals supply curve.
�(vii) Goals of firms. If the firms expect higher profits in the future, they will take the risk and produce goods on large scale resulting in larger supply of the commodities. The supply curve shifts to the right. �
Price movement due to seasonal and cyclic variations �Seasonal price variation � As with all agricultural markets, livestock markets are susceptible to seasonal variation. Fresh milk prices fluctuate in the same way as food crop prices moving inversely with supply on the market as supply diminishes in the dry season. � Meat prices move in a slightly different manner with natural shocks. While food prices are likely to rise during bad years when crop production falls, meat prices will fall during the same years as producers attempt to sell livestock they can no longer maintain for lack of feed or water.
� The bad year price rise in food causes supply to fall and sellers to hoard supplies, contributing to reduced consumption. � � This lengthens the period during which food supplies will last. The consequences of a bad year on the livestock market, however, are the opposite. The perishability of livestock during such a year causes supplies to be consumed more quickly than normal. The effects may be felt for years as producers attempt to rebuild their herds.
Cyclical price variation � It is not due to natural shocks, but is based on the reactions of supply to changing market conditions. � Because sustained increases in livestock production, in response to some increase in demand, may take some years to bring about, during the lag prices may be sustained at a high level, and fall later.
The Cobweb Model or Cobweb Theory � The cobweb model or cobweb theory is an economic model that explains why prices might be subject to periodic fluctuations in certain types of markets. � It describes cyclical supply and demand in a market where the amount produced must be chosen before prices are observed. Producers' expectations about prices are assumed to be based on observations of previous prices. Nicholas Kaldor analyzed the model in 1934, coining the term ‘cobweb theorem’.
The model � The cobweb model is based on a time lag between supply and demand decisions. � � � Agricultural markets are a context where the cobweb model might apply, since there is a lag between planting and harvesting. Suppose for example that as a result of unexpectedly bad weather, farmers go to market with an unusually small crop of strawberries. This shortage, equivalent to a leftward shift in the market's supply curve, results in high prices.
� � � If farmers expect these high price conditions to continue, then in the following year, they will raise their production of strawberries relative to other crops. Therefore when they go to market the supply will be high, resulting in low prices. If they then expect low prices to continue, they will decrease their production of strawberries for the next year, resulting in high prices again.
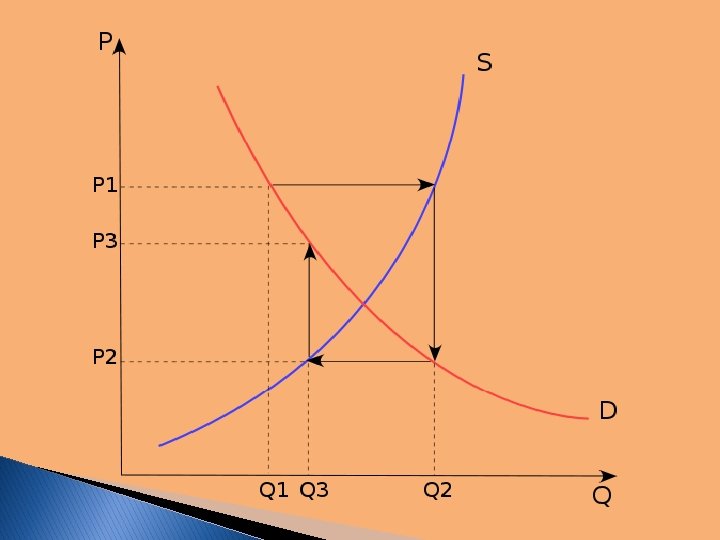
� This � � � process is illustrated by the diagrams. The equilibrium price is at the intersection of the supply and demand curves. A poor harvest in period 1 means supply falls to Q 1, so that prices rise to P 1. If producers plan their period 2 production under the expectation that this high price will continue, then the period 2 supply will be higher, at Q 2. Prices therefore fall to P 2 when they try to sell all their output. As this process repeats itself, oscillating between periods of low supply with high prices and then high supply with low prices, the price and quantity trace out a spiral. � In either of the first two scenarios, the combination of the spiral and the supply and demand curves often looks like a cobweb, hence the name of theory �