Cornerstone Research Nashville Apartment Market Analysis Dags Chen

- Slides: 25
Cornerstone Research Nashville Apartment Market Analysis Dags Chen Cornerstone Real Estate Advisers LLC 0
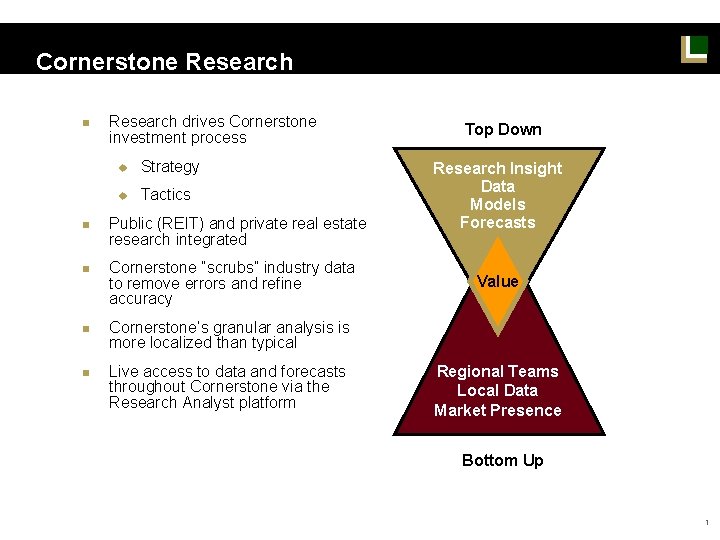
Cornerstone Research n n n Research drives Cornerstone investment process u Strategy u Tactics Public (REIT) and private real estate research integrated Cornerstone “scrubs” industry data to remove errors and refine accuracy Top Down Research Insight Data Models Forecasts Value Cornerstone’s granular analysis is more localized than typical Live access to data and forecasts throughout Cornerstone via the Research Analyst platform Regional Teams Local Data Market Presence Bottom Up 1
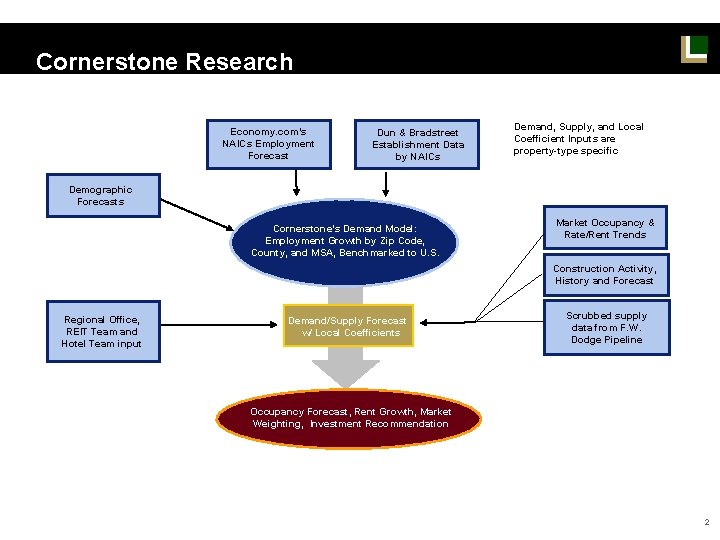
Cornerstone Research Economy. com’s NAICs Employment Forecast Dun & Bradstreet Establishment Data by NAICs Demand, Supply, and Local Coefficient Inputs are property-type specific Demographic Forecasts Cornerstone’s Demand Model: Employment Growth by Zip Code, County, and MSA, Benchmarked to U. S. Market Occupancy & Rate/Rent Trends Construction Activity, History and Forecast Regional Office, REIT Team and Hotel Team input Demand/Supply Forecast w/ Local Coefficients Scrubbed supply data from F. W. Dodge Pipeline Occupancy Forecast, Rent Growth, Market Weighting, Investment Recommendation 2
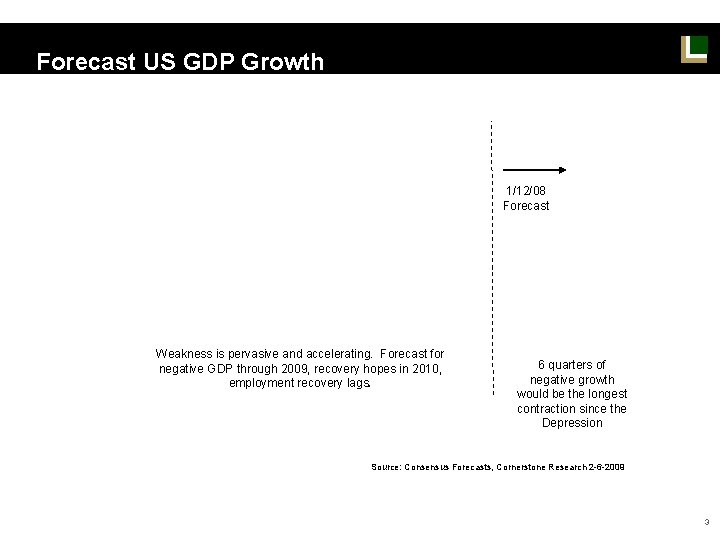
Forecast US GDP Growth 1/12/08 Forecast Weakness is pervasive and accelerating. Forecast for negative GDP through 2009, recovery hopes in 2010, employment recovery lags. 6 quarters of negative growth would be the longest contraction since the Depression Source: Consensus Forecasts, Cornerstone Research 2 -6 -2009 3
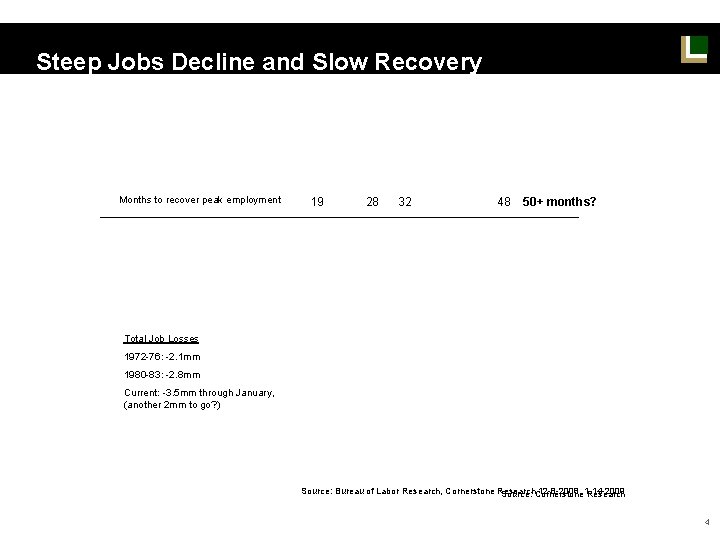
Steep Jobs Decline and Slow Recovery Months to recover peak employment 19 28 32 48 50+ months? Total Job Losses 1972 -76: -2. 1 mm 1980 -83: -2. 8 mm Current: -3. 5 mm through January, (another 2 mm to go? ) Source: Bureau of Labor Research, Cornerstone Research 12 -8 -2008, 1 -14 -2009 Source: Cornerstone Research 4
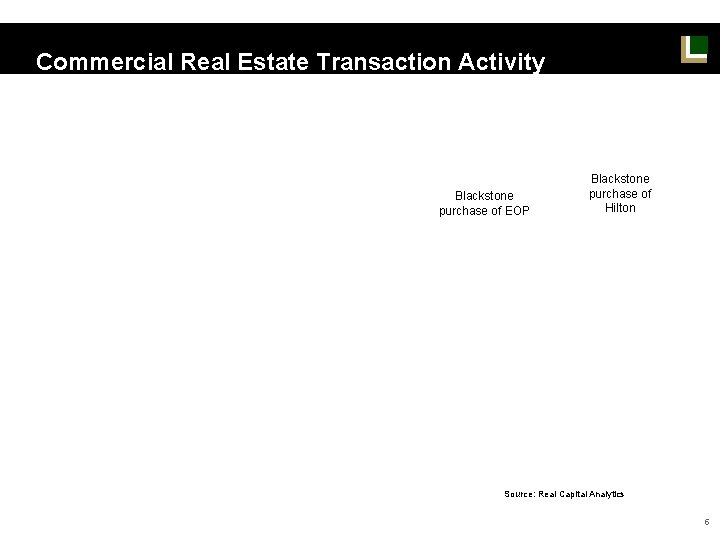
Commercial Real Estate Transaction Activity Blackstone purchase of EOP Blackstone purchase of Hilton Source: Real Capital Analytics 5
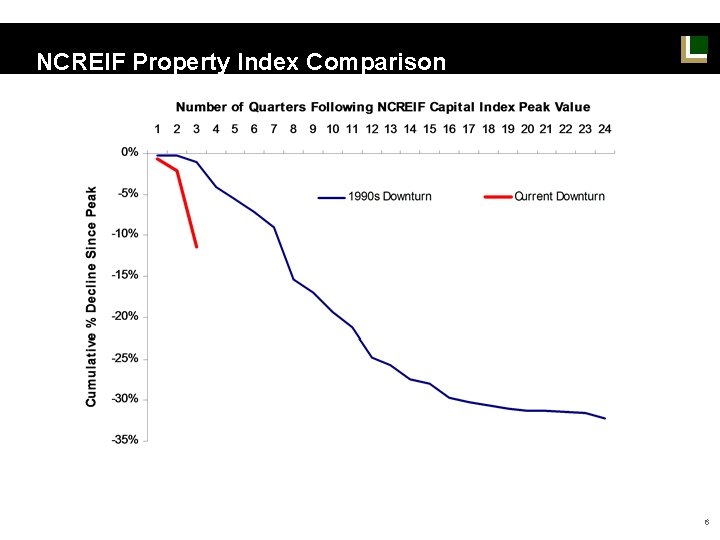
NCREIF Property Index Comparison 6
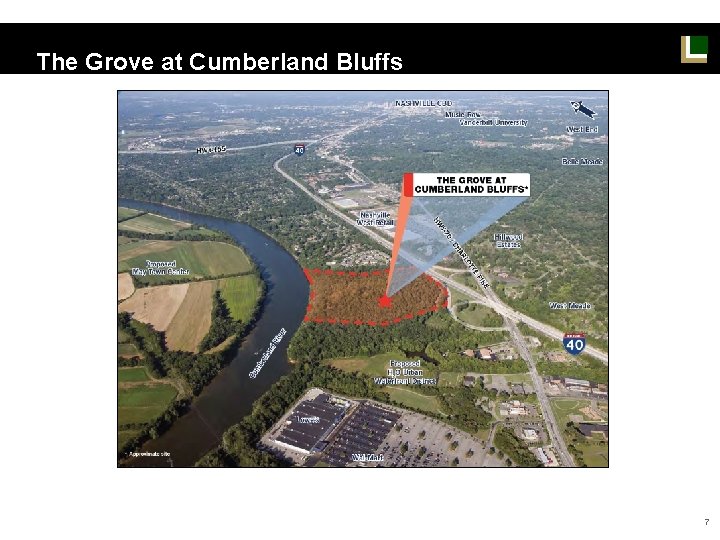
The Grove at Cumberland Bluffs 7
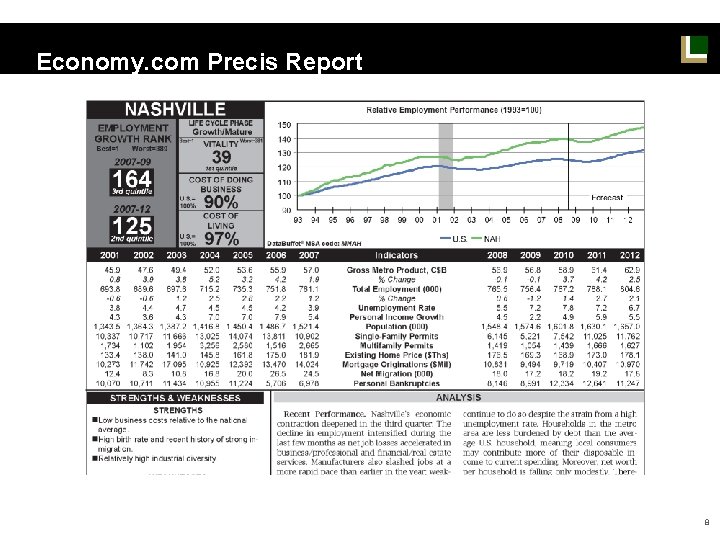
Economy. com Precis Report 8
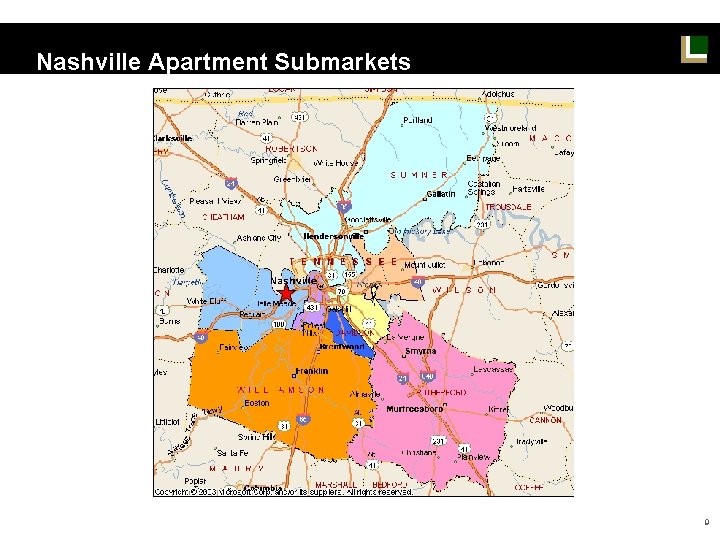
Nashville Apartment Submarkets 9
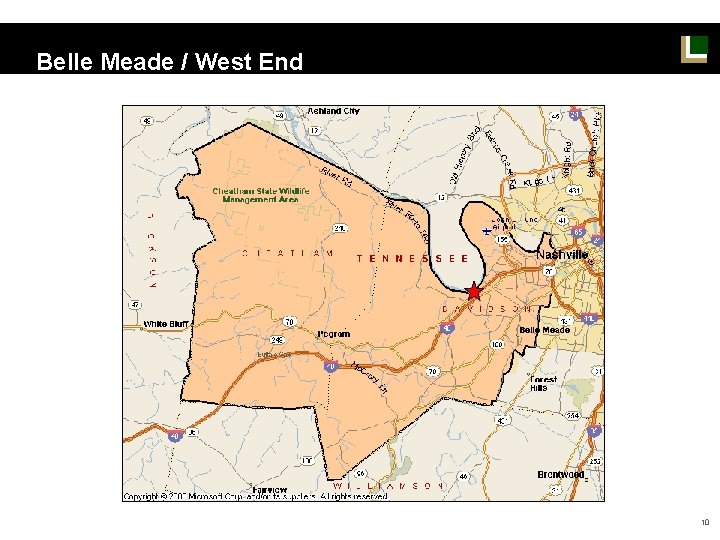
Belle Meade / West End 10
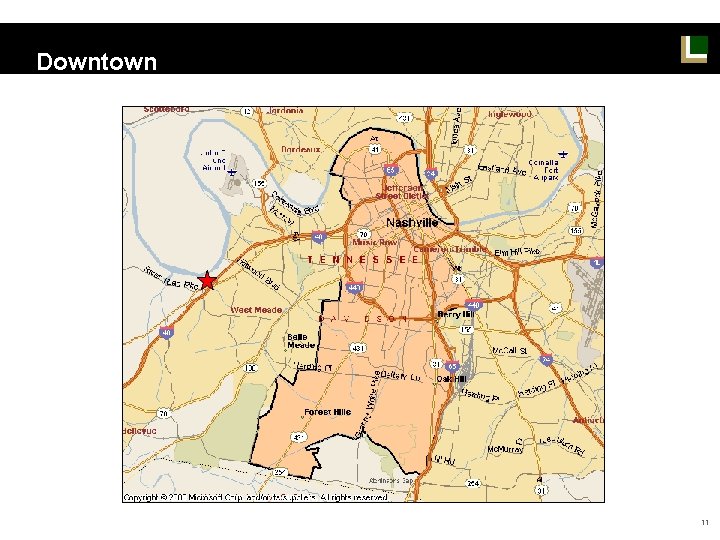
Downtown 11
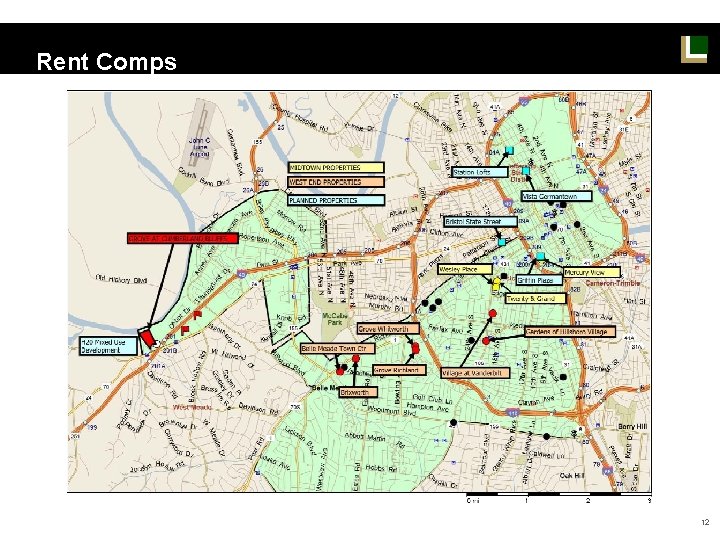
Rent Comps 12
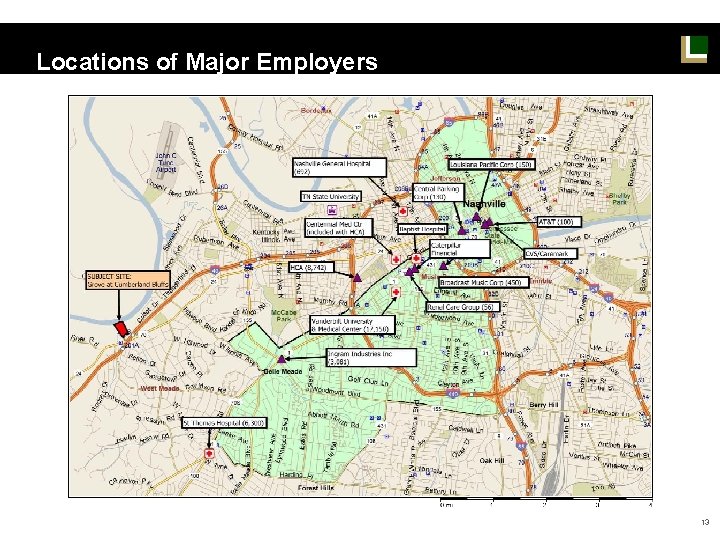
Locations of Major Employers 13
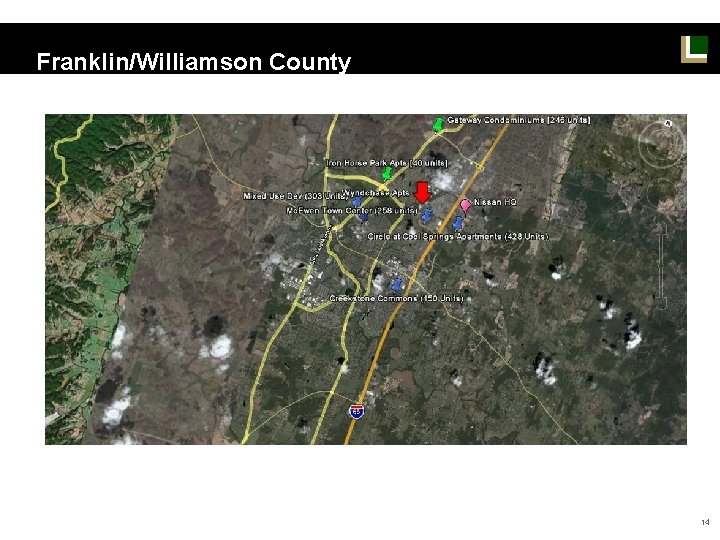
Franklin/Williamson County 14
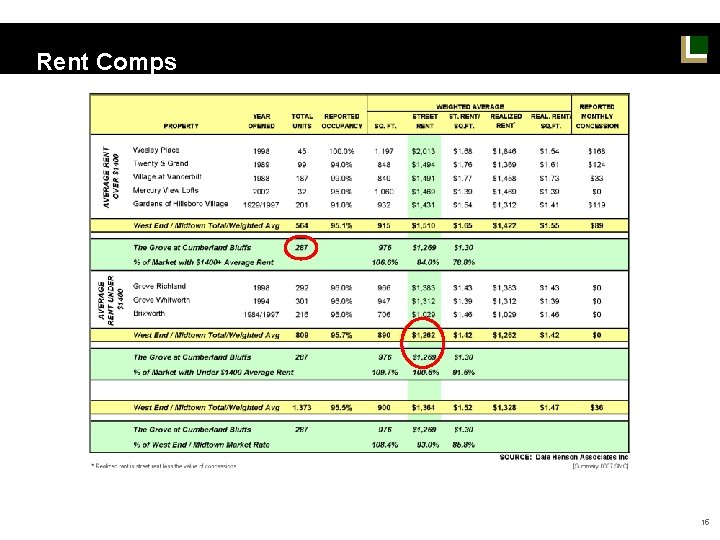
Rent Comps 15
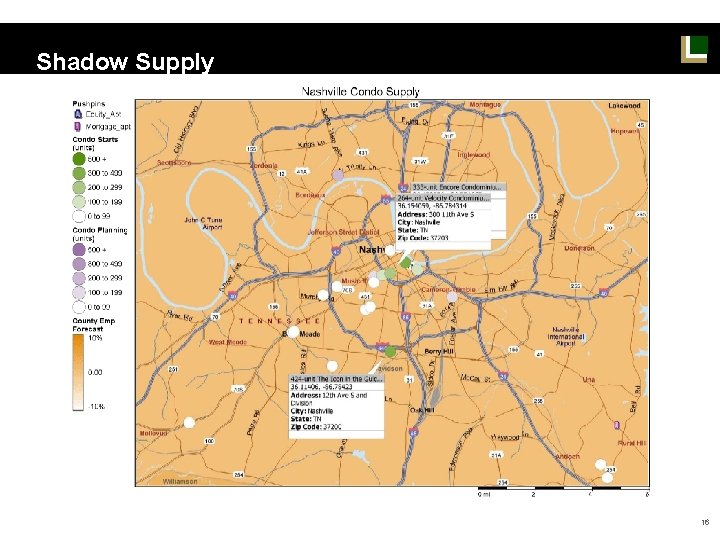
Shadow Supply 16
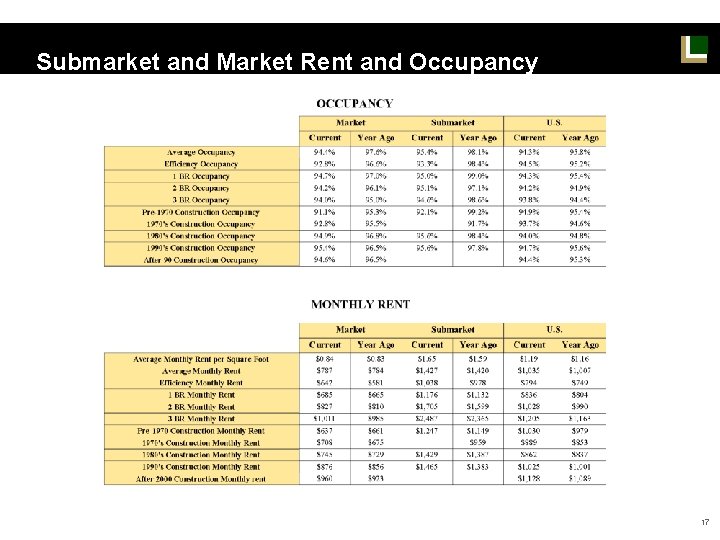
Submarket and Market Rent and Occupancy 17
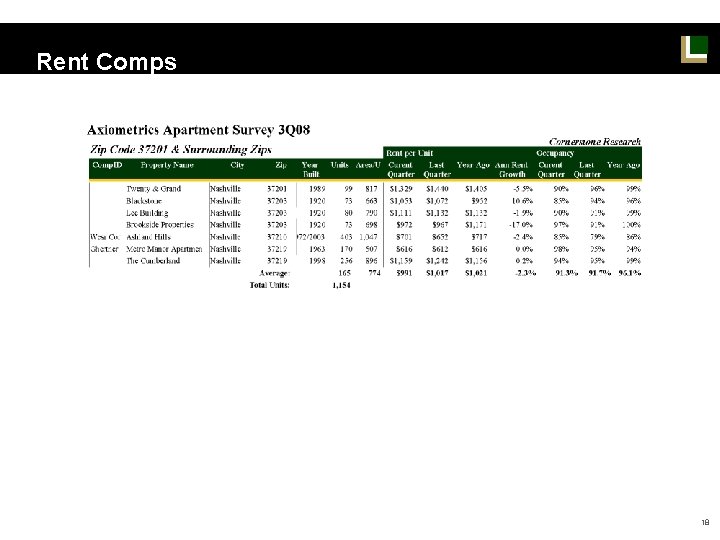
Rent Comps 18
Proforma Cash Flow 19
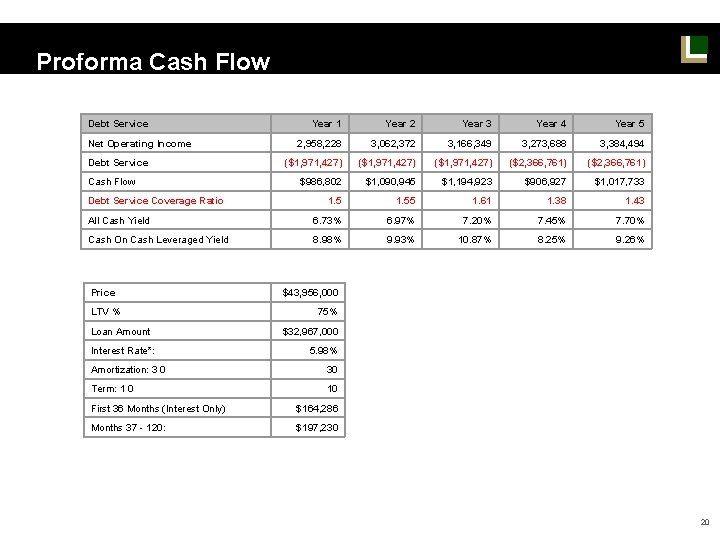
Proforma Cash Flow Debt Service Year 1 Year 2 Year 3 Year 4 Year 5 2, 958, 228 3, 062, 372 3, 166, 349 3, 273, 688 3, 384, 494 ($1, 971, 427) ($2, 366, 761) $986, 802 $1, 090, 945 $1, 194, 923 $906, 927 $1, 017, 733 1. 55 1. 61 1. 38 1. 43 All Cash Yield 6. 73% 6. 97% 7. 20% 7. 45% 7. 70% Cash On Cash Leveraged Yield 8. 98% 9. 93% 10. 87% 8. 25% 9. 26% Net Operating Income Debt Service Cash Flow Debt Service Coverage Ratio Price LTV % Loan Amount Interest Rate*: $43, 956, 000 75% $32, 967, 000 5. 98% Amortization: 3 0 30 Term: 1 0 10 First 36 Months (Interest Only) $164, 286 Months 37 - 120: $197, 230 20
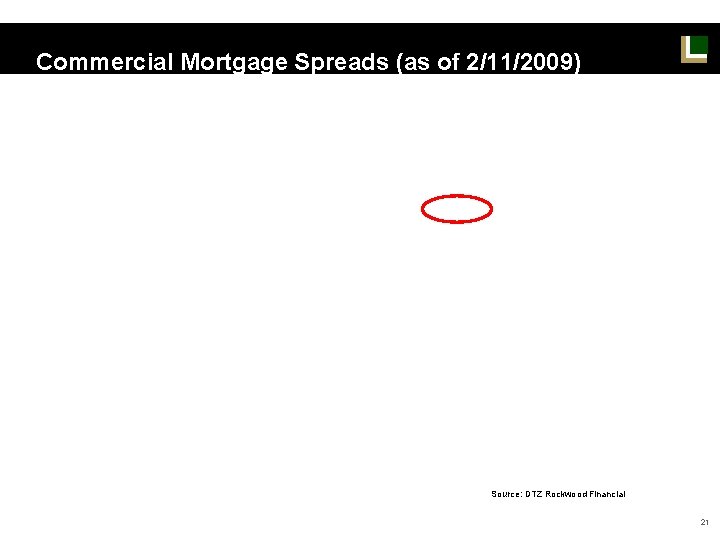
Commercial Mortgage Spreads (as of 2/11/2009) Source: DTZ Rockwood Financial 21
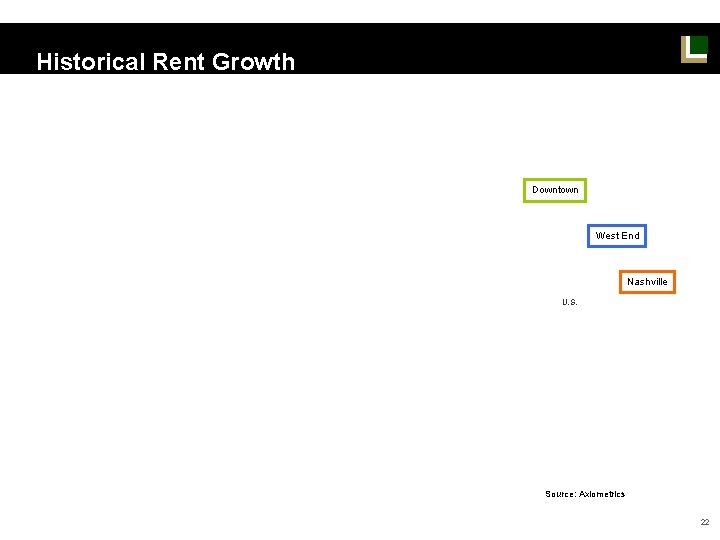
Historical Rent Growth Downtown West End Nashville U. S. Source: Axiometrics 22
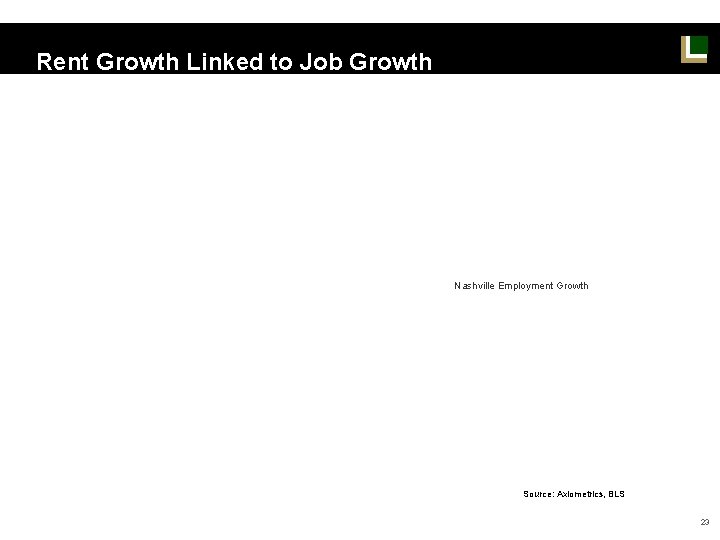
Rent Growth Linked to Job Growth Nashville Employment Growth Source: Axiometrics, BLS 23
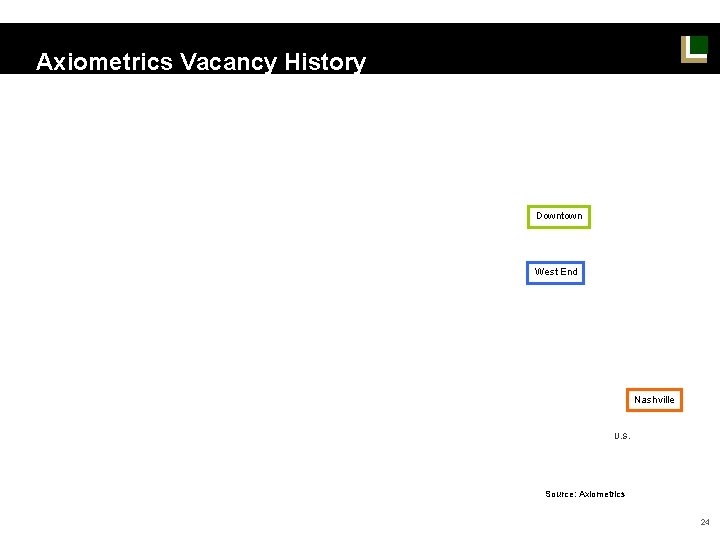
Axiometrics Vacancy History Downtown West End Nashville U. S. Source: Axiometrics 24