Controlling air pollution in India Dr Sumit Sharma

- Slides: 28
Controlling air pollution in India Dr. Sumit Sharma Director, ESCC Division TERI 11 th Dec 2019
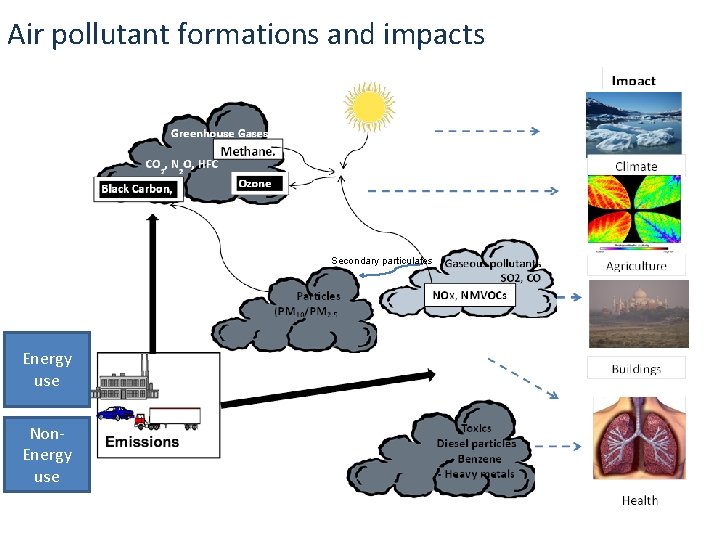
Air pollutant formations and impacts Secondary particulates Energy use Non. Energy use
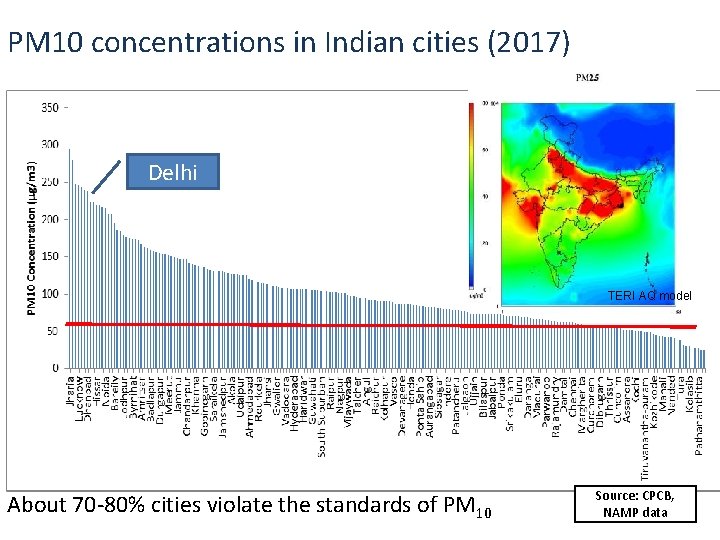
PM 10 concentrations in Indian cities (2017) Delhi TERI AQ model About 70 -80% cities violate the standards of PM 10 Source: CPCB, NAMP data
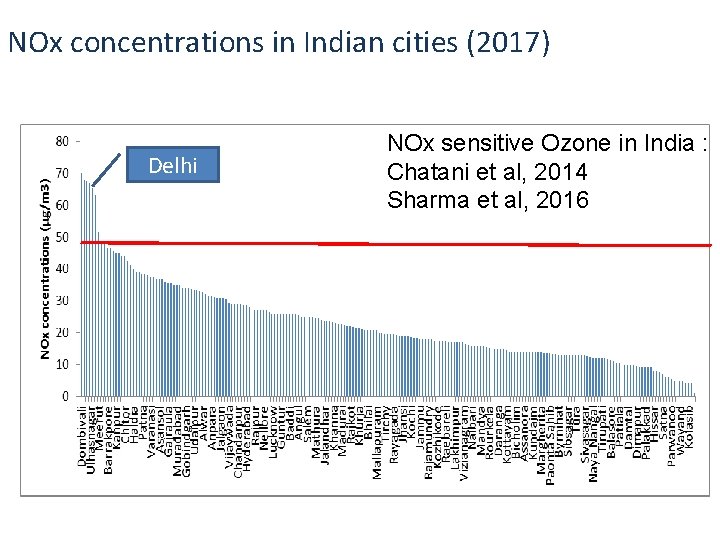
NOx concentrations in Indian cities (2017) Delhi NOx sensitive Ozone in India : Chatani et al, 2014 Sharma et al, 2016
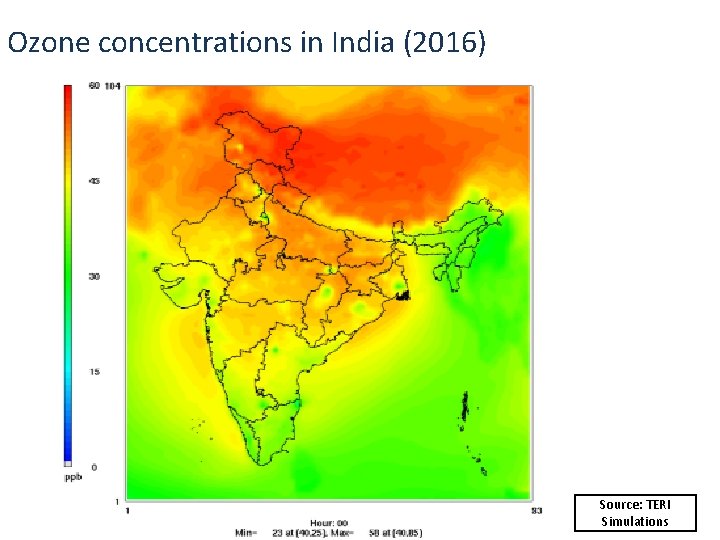
Ozone concentrations in India (2016) Source: TERI Simulations
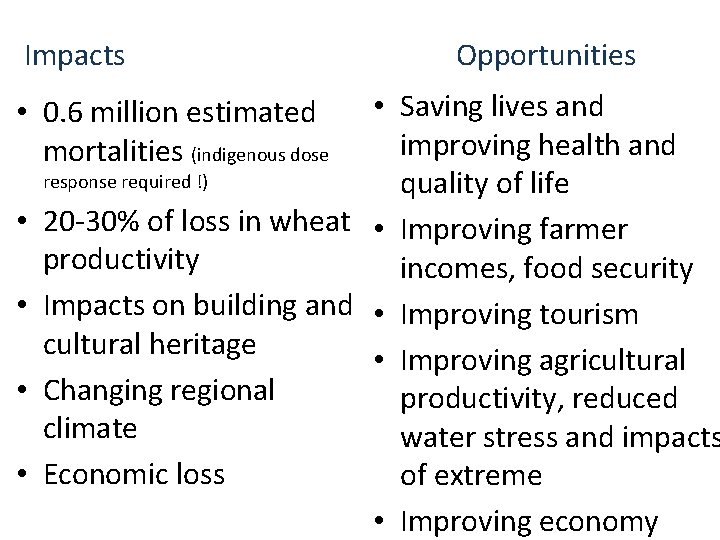
Impacts Opportunities • Saving lives and improving health and response required !) quality of life • 20 -30% of loss in wheat • Improving farmer productivity incomes, food security • Impacts on building and • Improving tourism cultural heritage • Improving agricultural • Changing regional productivity, reduced climate water stress and impacts • Economic loss of extreme • Improving economy • 0. 6 million estimated mortalities (indigenous dose
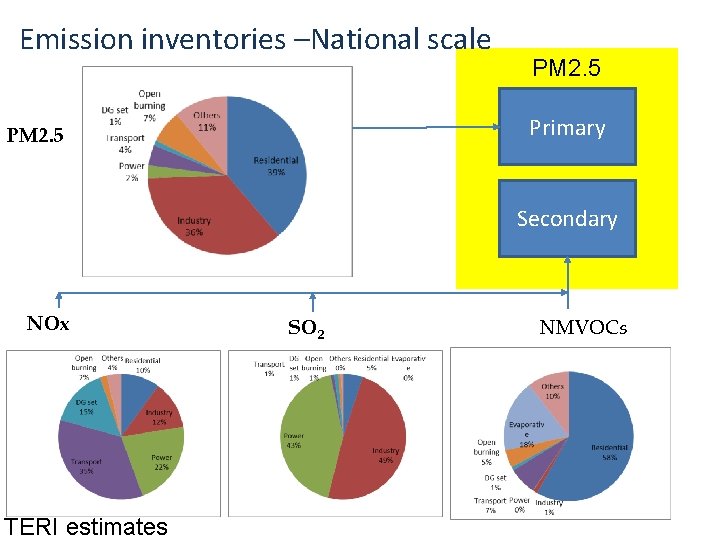
Emission inventories –National scale PM 2. 5 Primary PM 2. 5 Secondary NOx TERI estimates SO 2 NMVOCs
Urban air quality in Delhi
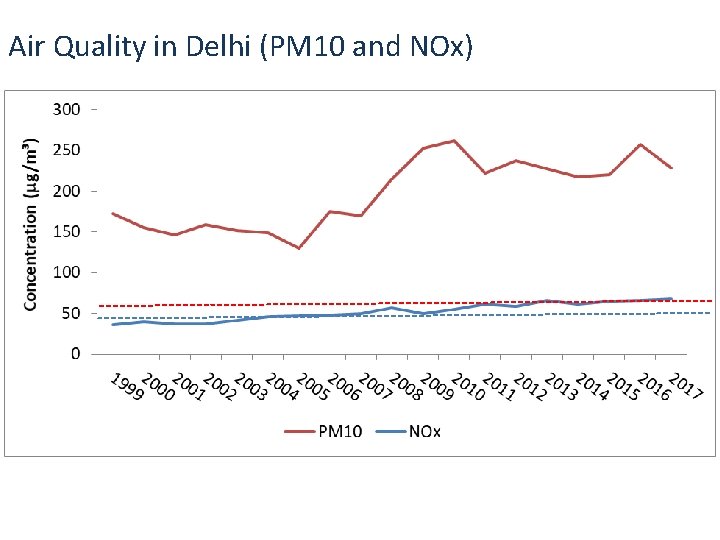
Air Quality in Delhi (PM 10 and NOx)
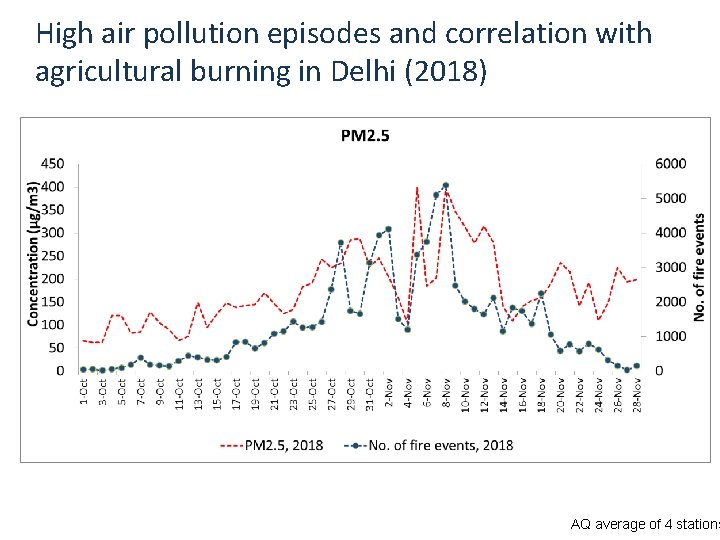
High air pollution episodes and correlation with agricultural burning in Delhi (2018) AQ average of 4 stations
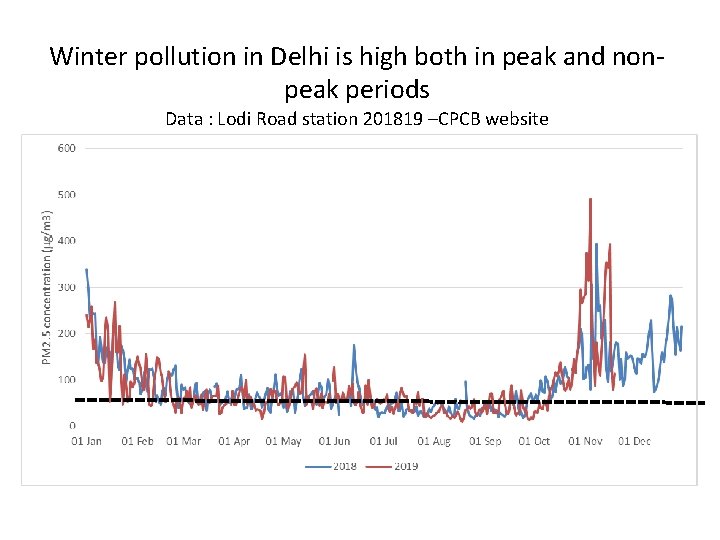
Winter pollution in Delhi is high both in peak and nonpeak periods Data : Lodi Road station 201819 –CPCB website
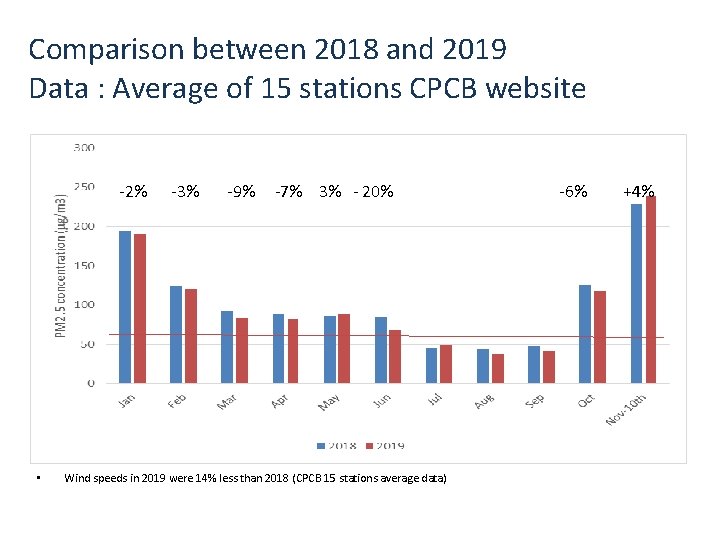
Comparison between 2018 and 2019 Data : Average of 15 stations CPCB website -2% • -3% -9% -7% 3% - 20% Wind speeds in 2019 were 14% less than 2018 (CPCB 15 stations average data) -6% +4%
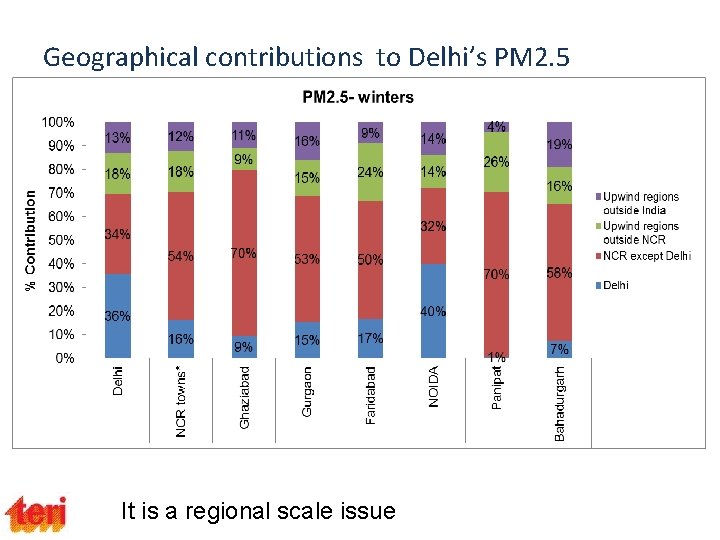
Geographical contributions to Delhi’s PM 2. 5 It is a regional scale issue
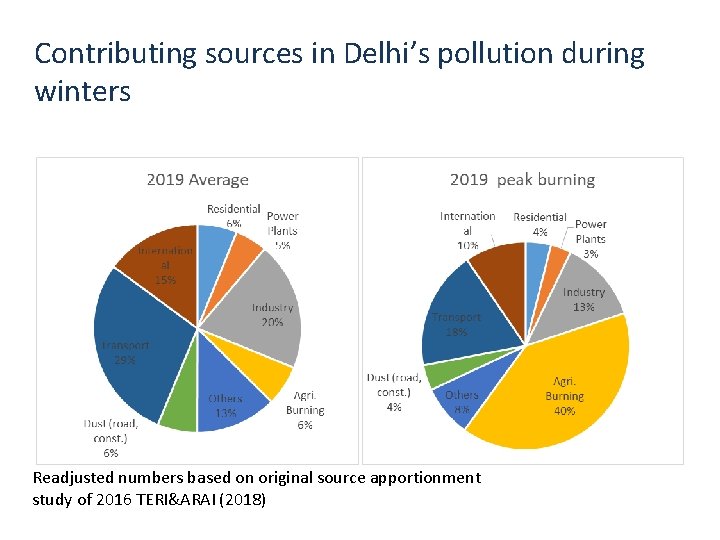
Contributing sources in Delhi’s pollution during winters Readjusted numbers based on original source apportionment study of 2016 TERI&ARAI (2018)
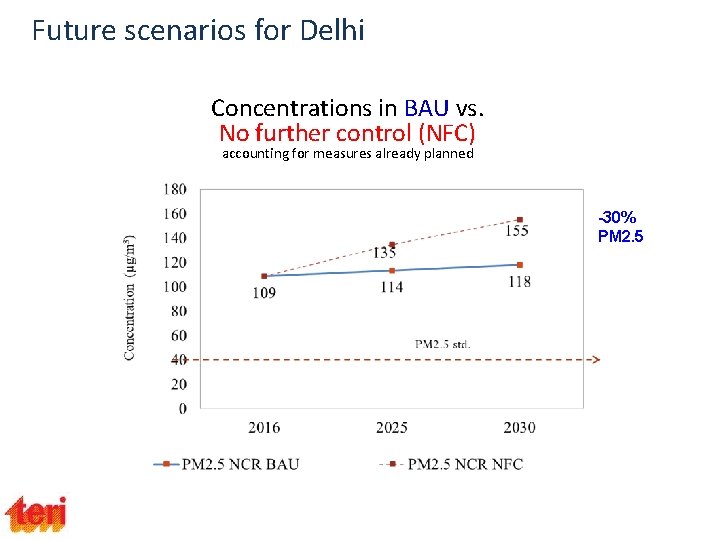
Future scenarios for Delhi Concentrations in BAU vs. No further control (NFC) accounting for measures already planned -30% PM 2. 5
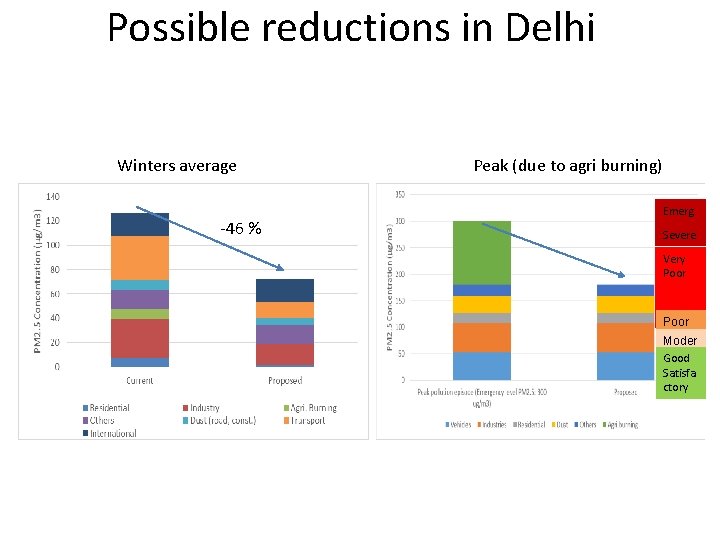
Possible reductions in Delhi Winters average -46 % Peak (due to agri burning) Emerg ency Severe Very Poor Moder ate Good Satisfa ctory
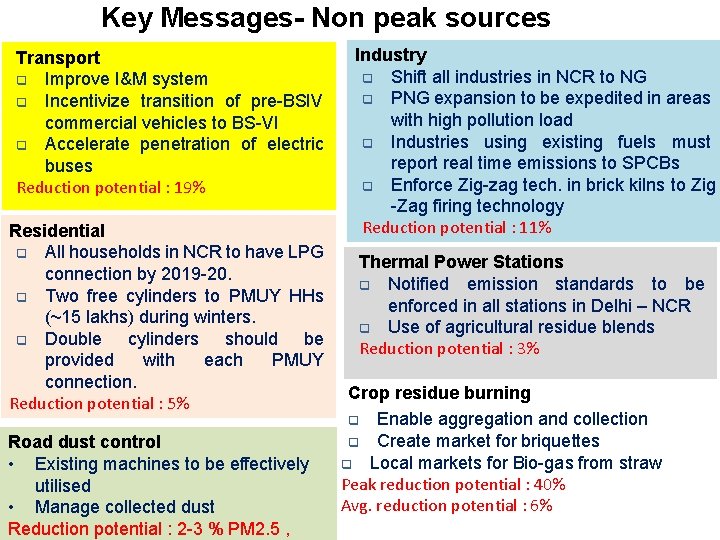
Key Messages- Non peak sources Transport q Improve I&M system q Incentivize transition of pre-BSIV commercial vehicles to BS-VI q Accelerate penetration of electric buses Reduction potential : 19% Residential q All households in NCR to have LPG connection by 2019 -20. q Two free cylinders to PMUY HHs (~15 lakhs) during winters. q Double cylinders should be provided with each PMUY connection. Reduction potential : 5% Road dust control • Existing machines to be effectively utilised • Manage collected dust Reduction potential : 2 -3 % PM 2. 5 , Industry q Shift all industries in NCR to NG q PNG expansion to be expedited in areas with high pollution load q Industries using existing fuels must report real time emissions to SPCBs q Enforce Zig-zag tech. in brick kilns to Zig -Zag firing technology Reduction potential : 11% Thermal Power Stations q Notified emission standards to be enforced in all stations in Delhi – NCR q Use of agricultural residue blends Reduction potential : 3% Crop residue burning q Enable aggregation and collection q Create market for briquettes q Local markets for Bio-gas from straw Peak reduction potential : 40% Avg. reduction potential : 6%
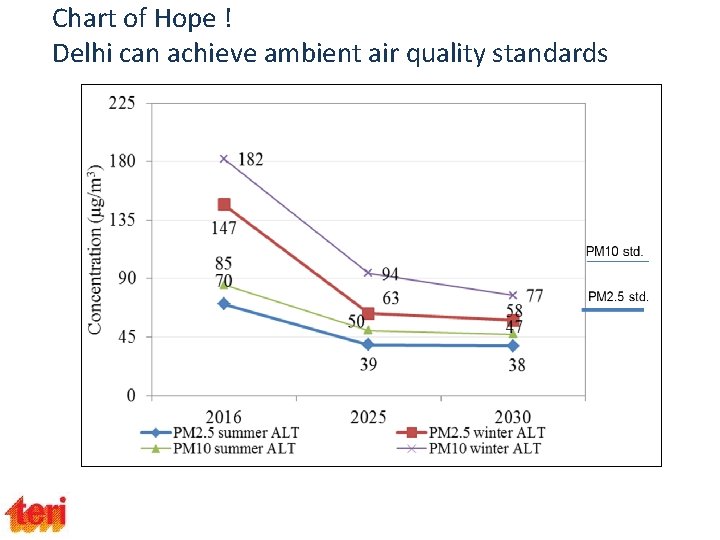
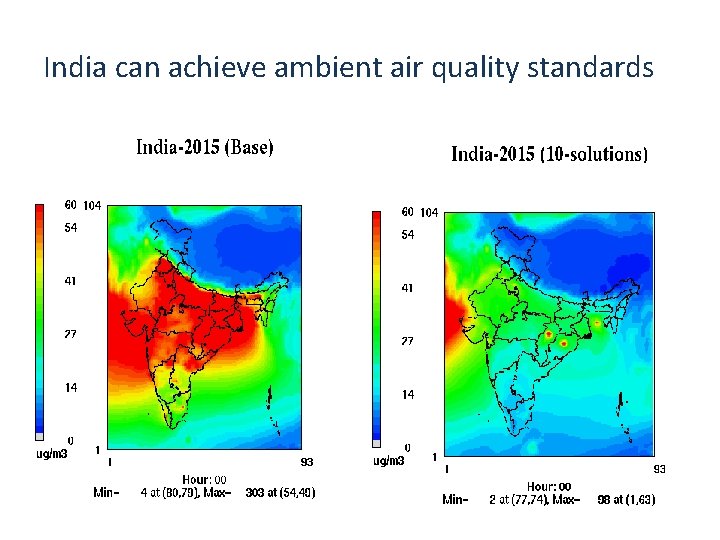
Chart of Hope ! Delhi can achieve ambient air quality standards
Reducing regional pollution in India
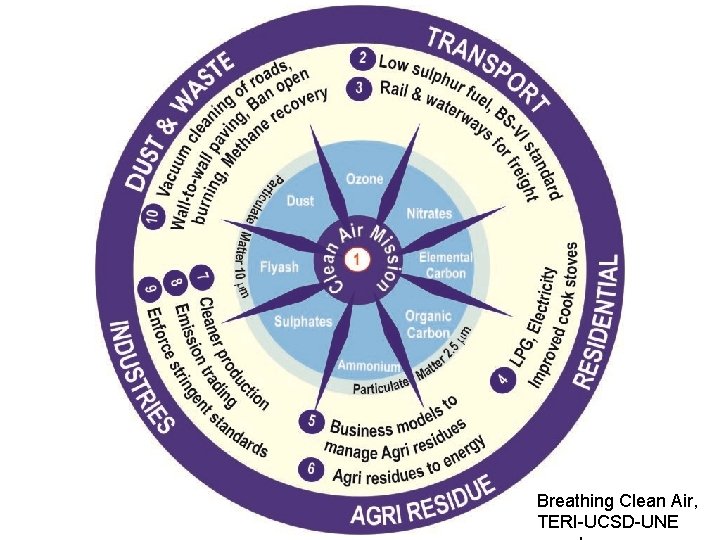
Breathing Clean Air, TERI-UCSD-UNE
Measures taken for air pollution control in India • Launching national Clean Air Programme (NCAP) for Multi-Scale and Cross-Sectoral Coordination • LPG PNG penetration – Ujjwala • Rural electrification- Saubhagya • Leapfrog to Euro-VI vehicular and fuel technology • Promoting in-situ management of agri residues • Introducing stringent norms for power plants • Expansion of gas as automotive, industrial, and residential fuel • Awareness- AQI
Things to be done • • • Fleet modernization Strengthen Inspection and maintenance Public transportation Electric mobility Use of technology for enforcement Extending gas networks and connections Ex-situ management of agri waste Waste management Road dust control VOC control in products Ammonia control in fertilizer use and live stock management
India can achieve ambient air quality standards
Climate-AQ linkages
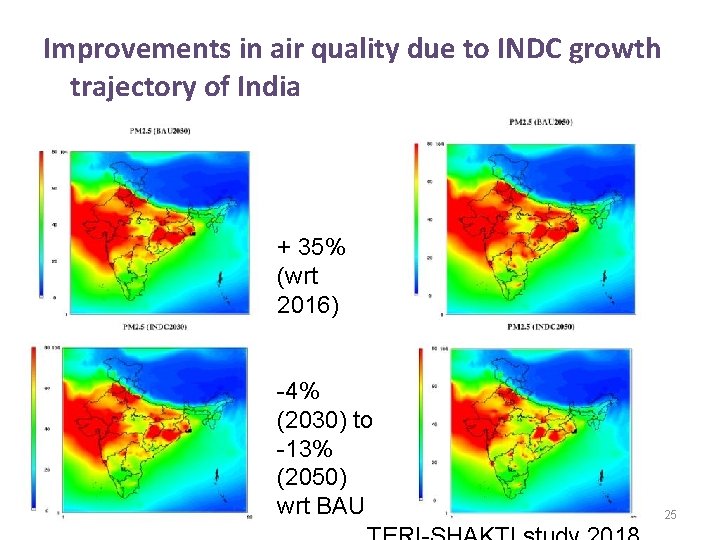
Improvements in air quality due to INDC growth trajectory of India + 35% (wrt 2016) -4% (2030) to -13% (2050) wrt BAU 25
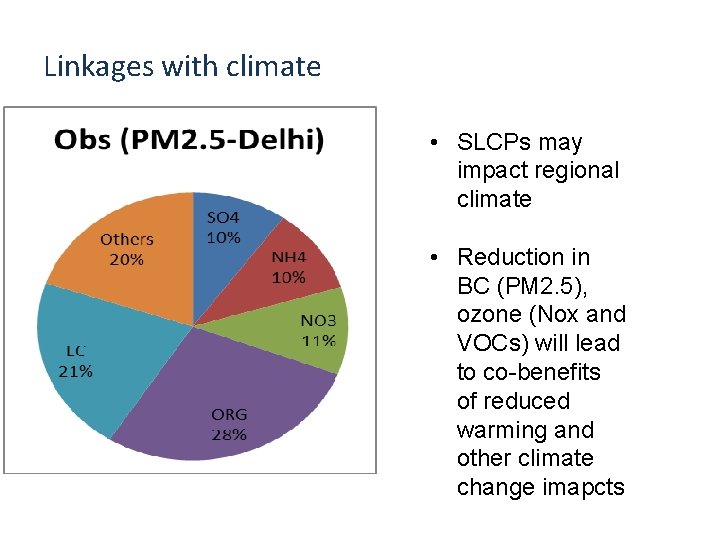
Linkages with climate • SLCPs may impact regional climate • Reduction in BC (PM 2. 5), ozone (Nox and VOCs) will lead to co-benefits of reduced warming and other climate change imapcts
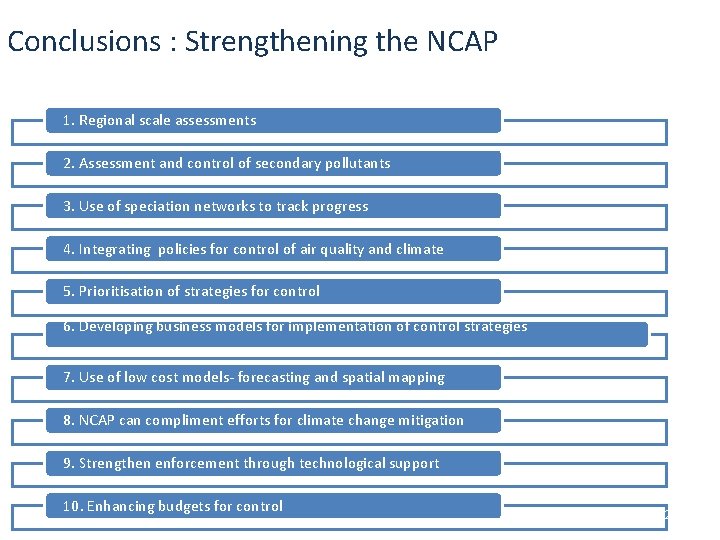
Conclusions : Strengthening the NCAP 1. Regional scale assessments 2. Assessment and control of secondary pollutants 3. Use of speciation networks to track progress 4. Integrating policies for control of air quality and climate 5. Prioritisation of strategies for control 6. Developing business models for implementation of control strategies 7. Use of low cost models- forecasting and spatial mapping 8. NCAP can compliment efforts for climate change mitigation 9. Strengthen enforcement through technological support 10. Enhancing budgets for control 27
Thanks