CONNECTING PLAINS DATA TO THE COMMON CORE Plain
- Slides: 13
CONNECTING PLAIN’S DATA TO THE COMMON CORE Plain Local District Inservice August 31, 2012
RAY HEXAMER, FORMER PRESIDENT AND GM OF WHBC RADIO IN HIS ADDRESS TO LEADERSHIP STARK COUNTY ON AUGUST 30, 2012 Measure simple Measure to target and stretch Measure as often as possible Everybody needs to measure Find the key indicator
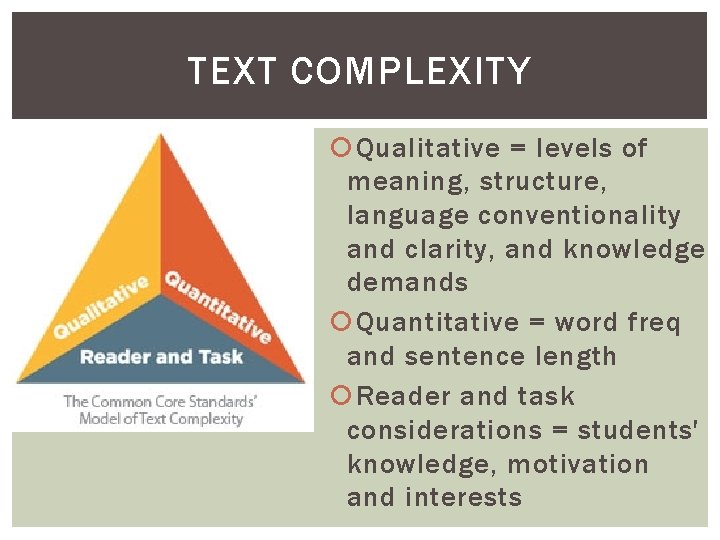
TEXT COMPLEXITY Qualitative = levels of meaning, structure, language conventionality and clarity, and knowledge demands Quantitative = word freq and sentence length Reader and task considerations = students' knowledge, motivation and interests
DID YOU KNOW? Text complexity of K-12 texts has become increasingly "easier" the last 50 years with steep declines in average sentence length and vocab level in reading textbooks. While text demands of college and careers have remained consistent or increased, meaning college students are expected to read complex text with greater independence than are high school students. Result is a significant gap between students' reading abilities and the text demands of their postsecondary pursuits
LEXILE LEVELS A Lexile measure describes either an individual's reading ability or the difficulty level of text.
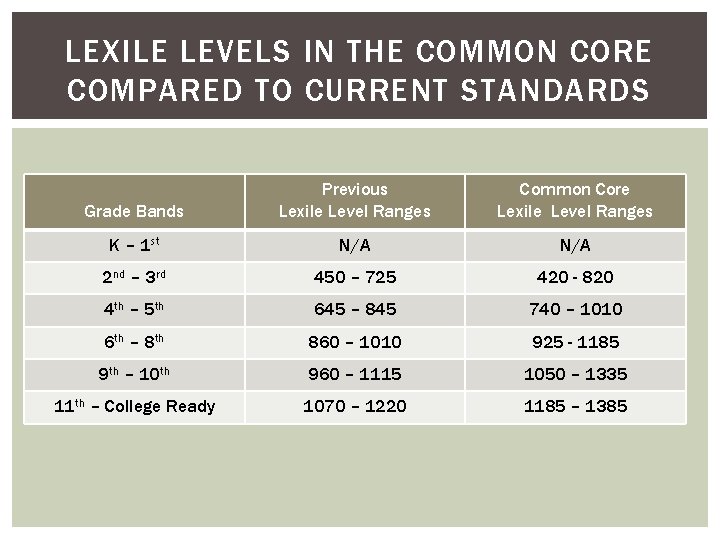
LEXILE LEVELS IN THE COMMON CORE COMPARED TO CURRENT STANDARDS Grade Bands Previous Lexile Level Ranges Common Core Lexile Level Ranges K – 1 st N/A 2 nd – 3 rd 450 – 725 420 - 820 4 th – 5 th 645 – 845 740 – 1010 6 th – 8 th 860 – 1010 925 - 1185 9 th – 10 th 960 – 1115 1050 – 1335 11 th – College Ready 1070 – 1220 1185 – 1385
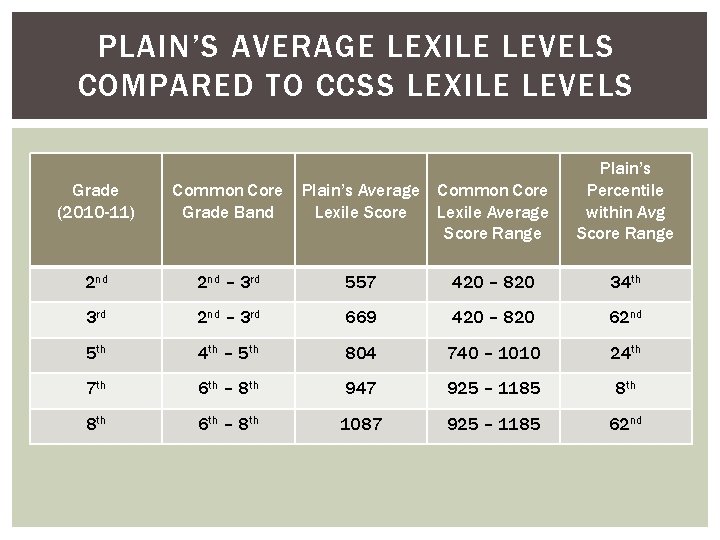
PLAIN’S AVERAGE LEXILE LEVELS COMPARED TO CCSS LEXILE LEVELS Grade (2010 -11) Common Core Plain’s Average Common Core Grade Band Lexile Score Lexile Average Score Range Plain’s Percentile within Avg Score Range 2 nd – 3 rd 557 420 – 820 34 th 3 rd 2 nd – 3 rd 669 420 – 820 62 nd 5 th 4 th – 5 th 804 740 – 1010 24 th 7 th 6 th – 8 th 947 925 – 1185 8 th 6 th – 8 th 1087 925 – 1185 62 nd
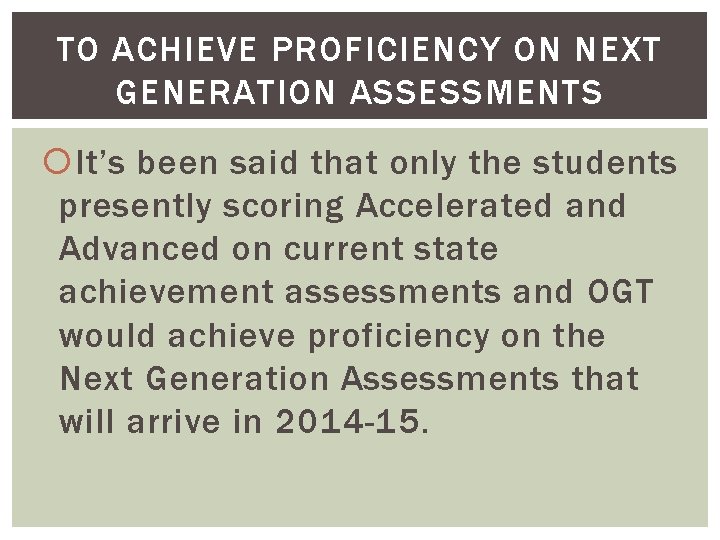
TO ACHIEVE PROFICIENCY ON NEXT GENERATION ASSESSMENTS It’s been said that only the students presently scoring Accelerated and Advanced on current state achievement assessments and OGT would achieve proficiency on the Next Generation Assessments that will arrive in 2014 -15.
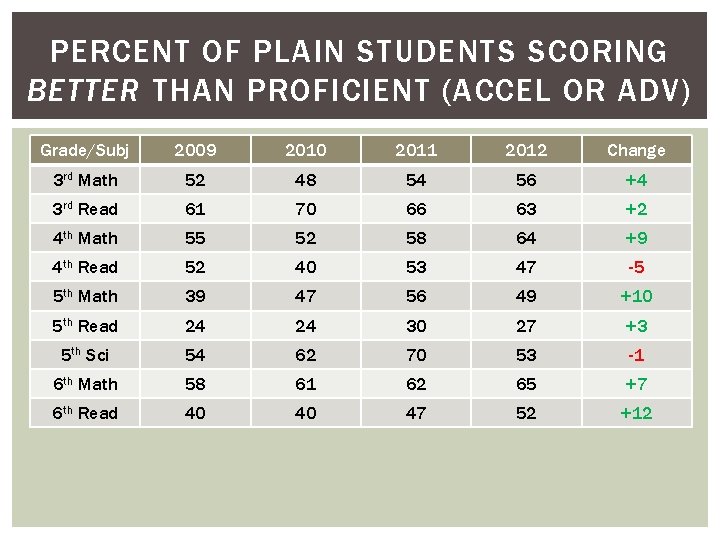
PERCENT OF PLAIN STUDENTS SCORING BETTER THAN PROFICIENT (ACCEL OR ADV) Grade/Subj 2009 2010 2011 2012 Change 3 rd Math 52 48 54 56 +4 3 rd Read 61 70 66 63 +2 4 th Math 55 52 58 64 +9 4 th Read 52 40 53 47 -5 5 th Math 39 47 56 49 +10 5 th Read 24 24 30 27 +3 5 th Sci 54 62 70 53 -1 6 th Math 58 61 62 65 +7 6 th Read 40 40 47 52 +12
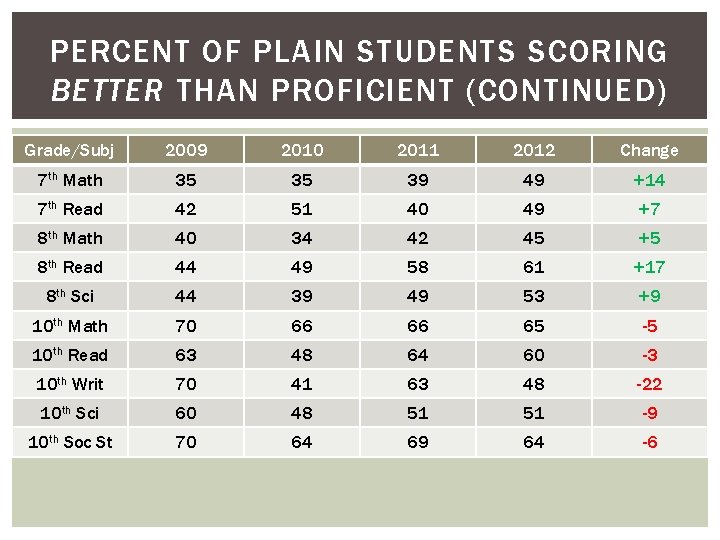
PERCENT OF PLAIN STUDENTS SCORING BETTER THAN PROFICIENT (CONTINUED) Grade/Subj 2009 2010 2011 2012 Change 7 th Math 35 35 39 49 +14 7 th Read 42 51 40 49 +7 8 th Math 40 34 42 45 +5 8 th Read 44 49 58 61 +17 8 th Sci 44 39 49 53 +9 10 th Math 70 66 66 65 -5 10 th Read 63 48 64 60 -3 10 th Writ 70 41 63 48 -22 10 th Sci 60 48 51 51 -9 10 th Soc St 70 64 69 64 -6
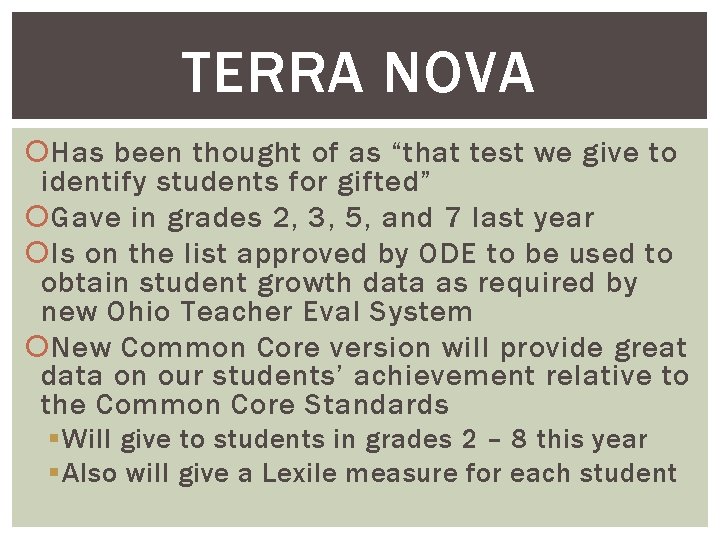
TERRA NOVA Has been thought of as “that test we give to identify students for gifted” Gave in grades 2, 3, 5, and 7 last year Is on the list approved by ODE to be used to obtain student growth data as required by new Ohio Teacher Eval System New Common Core version will provide great data on our students’ achievement relative to the Common Core Standards § Will give to students in grades 2 – 8 this year § Also will give a Lexile measure for each student
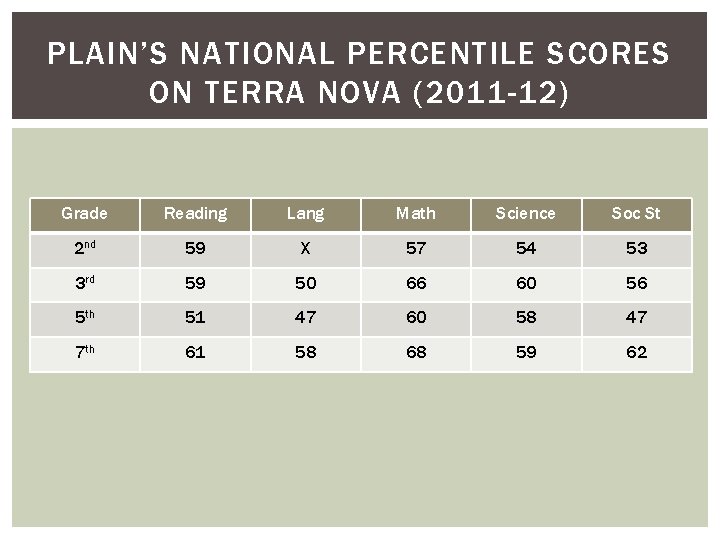
PLAIN’S NATIONAL PERCENTILE SCORES ON TERRA NOVA (2011 -12) Grade Reading Lang Math Science Soc St 2 nd 59 X 57 54 53 3 rd 59 50 66 60 56 5 th 51 47 60 58 47 7 th 61 58 68 59 62
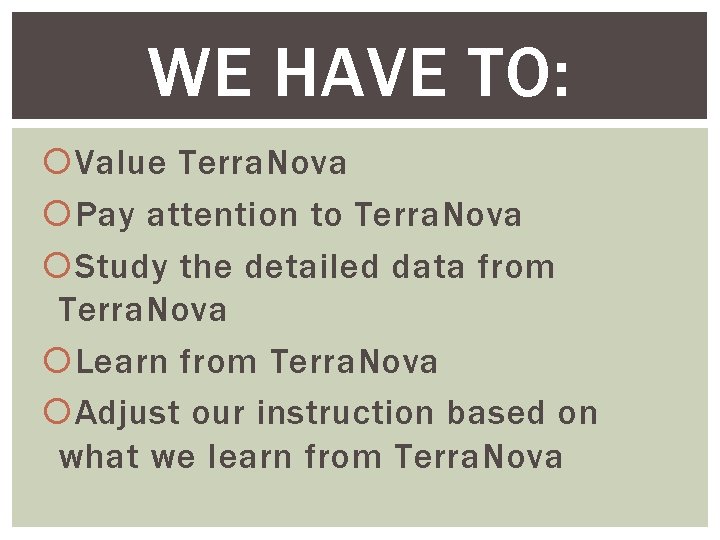
WE HAVE TO: Value Terra. Nova Pay attention to Terra. Nova Study the detailed data from Terra. Nova Learn from Terra. Nova Adjust our instruction based on what we learn from Terra. Nova