ASSESSMENT OF GLYCEMIC INDEX OF COCOYAM COWPEA AND


- Slides: 24
ASSESSMENT OF GLYCEMIC INDEX OF COCOYAM, COWPEA AND PLANTAIN COMPOSITE FLOUR MEAL FOR APPARENTLY HEALTHY NIGERIANS 1 Nutrition 1 J. V Akinlotan, 2 I. O Olayiwola, 3 A Ladokun and 4 S. A Sanni and Dietetics Department, Moshood Abiola Polytechnic Abeokuta 2, 4 Nutrition and Dietetics Department, Federal University of Agriculture Abeokuta 3 Department of Animal Physiology Federal University of Agriculture Abeokuta
INTRODUCTION � � � Consumption of high and easily digestible carbohydrate foods may result in higher glycemic index (GI) leading to higher risk of diabetes and other nutritional diseases. The upsurge in the incidence and prevalence of diabetic worldwide and in Nigeria in particular is a challenge for urgent action in the adoption of appropriate dietary management (WHO 2010). Careful combination of slowly digestible starchy food staples such as cocoyam, plantain combined with cowpea could give appreciable low GI and nutritional value of the meals. Lowering the glycemic index of meals can improve the control of diabetics and other nutritional diseases. Hence, this study was carried out to determine the glycemic index of meals produced from cocoyam, plantain and cowpea flour blends.
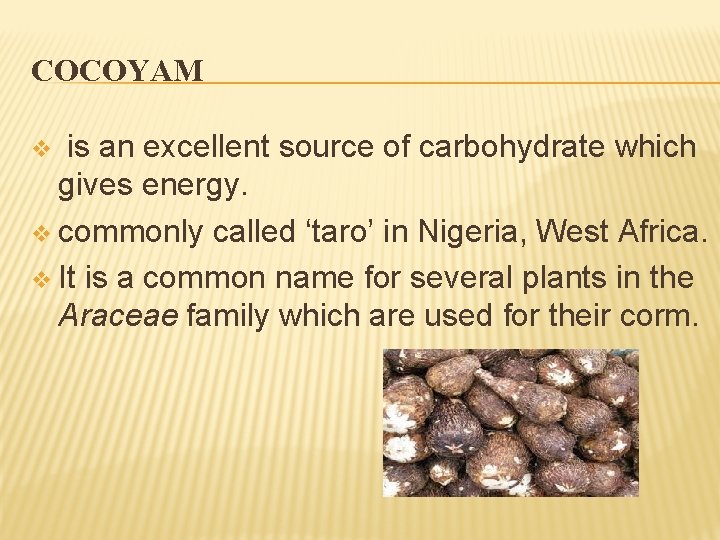
COCOYAM is an excellent source of carbohydrate which gives energy. v commonly called ‘taro’ in Nigeria, West Africa. v It is a common name for several plants in the Araceae family which are used for their corm. v
PLANTAIN It is from the genus Musa and species paradisiaca. v The matured unripe plantain contains more starch and less sugar than bananas. v
COWPEA v v Known as Vigna unguiculata. They are the most important plant food legume.
GLYCEMIC INDEX v It measures how quickly a particular food can raise blood sugar. v A high carbohydrate food (high glycemic index) raises blood glucose after consumption.
FOOD STARCH v v v Food starch are classified into rapidly digestible starch, slowly digestible starch and resistant starch. Starch from plantain and cowpea is known to belong to the SDS (Slowly Digestible Starch). A food with high glycemic index (rapidly digestible starch) raises the blood glucose which can result in obesity over time.
FOOD STARCH v v v CONTINUES In Nigeria, West Africa, majority of the staple or core meal is from carbohydrate source. In order to create varieties of meal, people tend to mix their diet. This mixing became apparent because of emergence of some nutritional diseases. Mixed diet is known to show reduced overall GI of the meal (Wolever and Mehling, 2003). Terminal diseases especially Type 2 diabetes can be delayed/reduced by increasing the frequency of consumption of low glycemic food.
OBJECTIVE v The overall objective is to produce mixed meal from cocoyam substituted with plantain and cowpea at various level to determine the glycemic index of the composite flour.
METHODOLOGY � Cocoyam flour production � Cowpea flour production � Plantain flour production
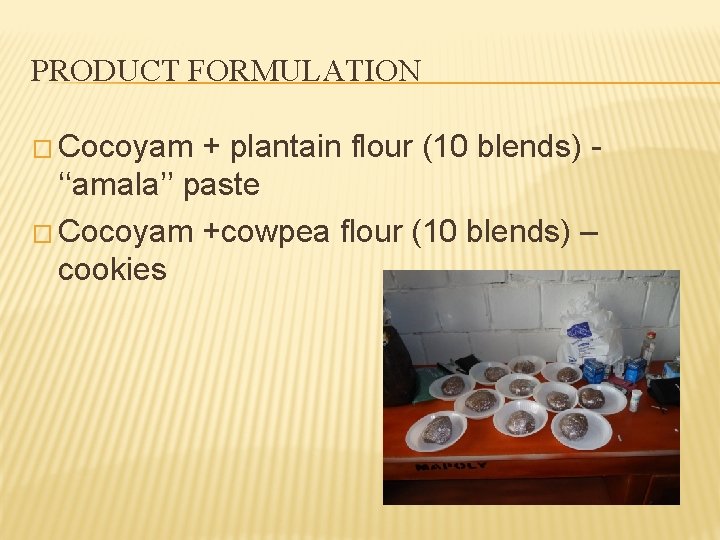
PRODUCT FORMULATION � Cocoyam + plantain flour (10 blends) ‘‘amala’’ paste � Cocoyam +cowpea flour (10 blends) – cookies
PRODUCT ANALYSIS � The flour and the meal were analysed for starch and sugar.
GLYCEMIC INDEX DETERMINATION Ten apparently healthy volunteers (5 males and 5 females) aged 19 – 30 years were also fed with the meals (‘‘amala’’ and cookies). � Postprandial blood glucose was determined at thirty minutes interval for two hours using glucometer. � Fasting blood sugar (FBS) � Postprandial glucose level �
DATA ANALYSIS The statistical design was a randomized design. � Starch and sugar were analyzed using Analysis of Variance. � The incremental area under the blood glucose response curve IUAC was calculated according to (Bronus et al. , 2005) The data obtained was used to calculate GI of the meals. � Means were separated using Duncan’s multiple range tests. � Level of significance were determined at 5%. �
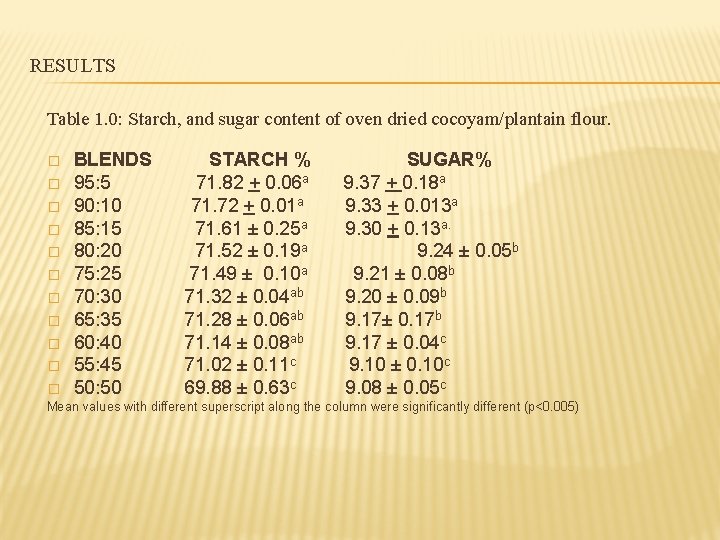
RESULTS Table 1. 0: Starch, and sugar content of oven dried cocoyam/plantain flour. � � � BLENDS 95: 5 90: 10 85: 15 80: 20 75: 25 70: 30 65: 35 60: 40 55: 45 50: 50 STARCH % 71. 82 + 0. 06 a 71. 72 + 0. 01 a 71. 61 ± 0. 25 a 71. 52 ± 0. 19 a 71. 49 ± 0. 10 a 71. 32 ± 0. 04 ab 71. 28 ± 0. 06 ab 71. 14 ± 0. 08 ab 71. 02 ± 0. 11 c 69. 88 ± 0. 63 c SUGAR% 9. 37 + 0. 18 a 9. 33 + 0. 013 a 9. 30 + 0. 13 a. 9. 24 ± 0. 05 b 9. 21 ± 0. 08 b 9. 20 ± 0. 09 b 9. 17± 0. 17 b 9. 17 ± 0. 04 c 9. 10 ± 0. 10 c 9. 08 ± 0. 05 c Mean values with different superscript along the column were significantly different (p<0. 005)
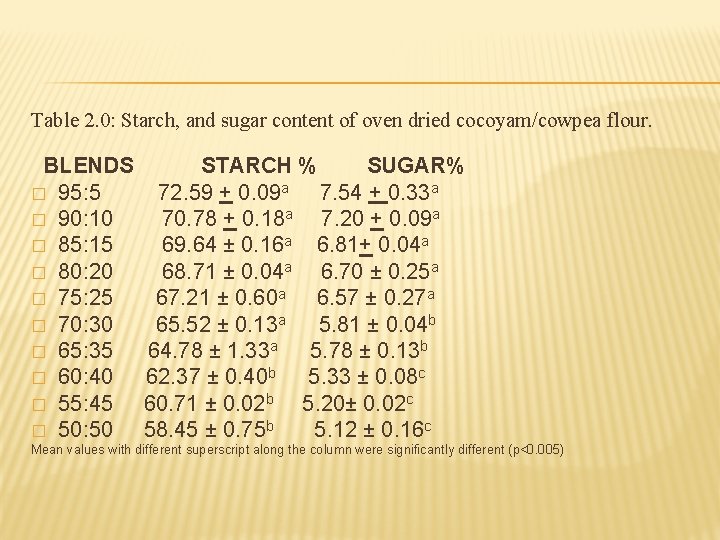
Table 2. 0: Starch, and sugar content of oven dried cocoyam/cowpea flour. BLENDS � 95: 5 � 90: 10 � 85: 15 � 80: 20 � 75: 25 � 70: 30 � 65: 35 � 60: 40 � 55: 45 � 50: 50 STARCH % SUGAR% 72. 59 + 0. 09 a 7. 54 + 0. 33 a 70. 78 + 0. 18 a 7. 20 + 0. 09 a 69. 64 ± 0. 16 a 6. 81+ 0. 04 a 68. 71 ± 0. 04 a 6. 70 ± 0. 25 a 67. 21 ± 0. 60 a 6. 57 ± 0. 27 a 65. 52 ± 0. 13 a 5. 81 ± 0. 04 b 64. 78 ± 1. 33 a 5. 78 ± 0. 13 b 62. 37 ± 0. 40 b 5. 33 ± 0. 08 c 60. 71 ± 0. 02 b 5. 20± 0. 02 c 58. 45 ± 0. 75 b 5. 12 ± 0. 16 c Mean values with different superscript along the column were significantly different (p<0. 005)
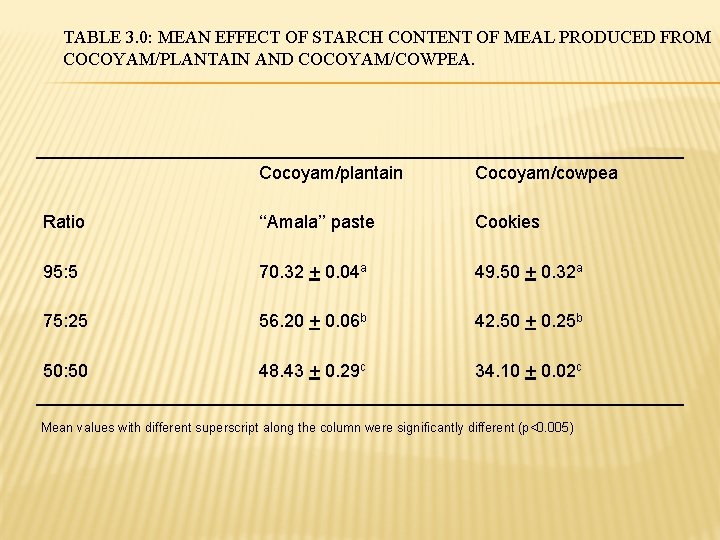
TABLE 3. 0: MEAN EFFECT OF STARCH CONTENT OF MEAL PRODUCED FROM COCOYAM/PLANTAIN AND COCOYAM/COWPEA. Cocoyam/plantain Cocoyam/cowpea Ratio ‘‘Amala’’ paste Cookies 95: 5 70. 32 + 0. 04 a 49. 50 + 0. 32 a 75: 25 56. 20 + 0. 06 b 42. 50 + 0. 25 b 50: 50 48. 43 + 0. 29 c 34. 10 + 0. 02 c Mean values with different superscript along the column were significantly different (p<0. 005)
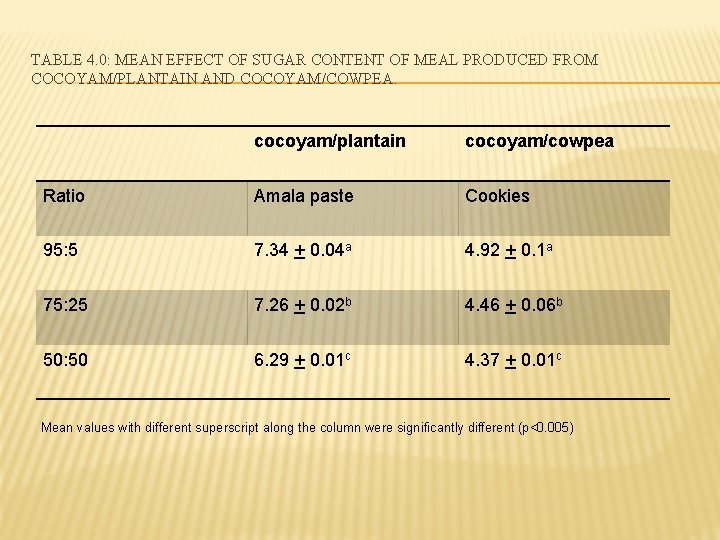
TABLE 4. 0: MEAN EFFECT OF SUGAR CONTENT OF MEAL PRODUCED FROM COCOYAM/PLANTAIN AND COCOYAM/COWPEA. cocoyam/plantain cocoyam/cowpea Ratio Amala paste Cookies 95: 5 7. 34 + 0. 04 a 4. 92 + 0. 1 a 75: 25 7. 26 + 0. 02 b 4. 46 + 0. 06 b 50: 50 6. 29 + 0. 01 c 4. 37 + 0. 01 c Mean values with different superscript along the column were significantly different (p<0. 005)
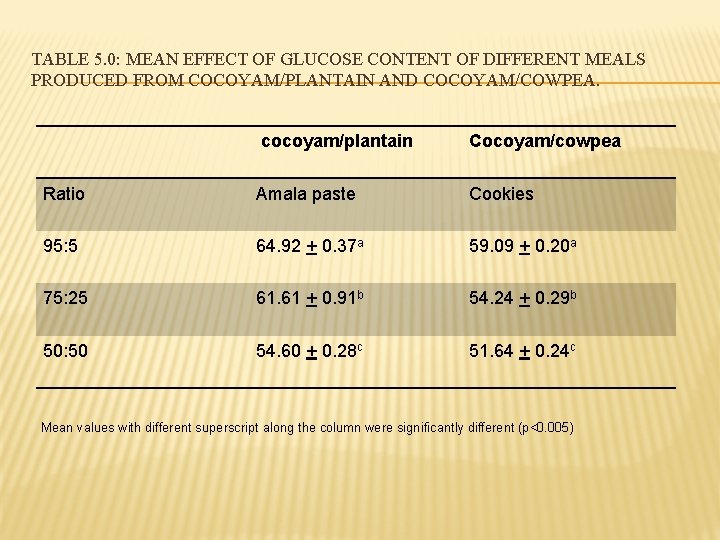
TABLE 5. 0: MEAN EFFECT OF GLUCOSE CONTENT OF DIFFERENT MEALS PRODUCED FROM COCOYAM/PLANTAIN AND COCOYAM/COWPEA. cocoyam/plantain Cocoyam/cowpea Ratio Amala paste Cookies 95: 5 64. 92 + 0. 37 a 59. 09 + 0. 20 a 75: 25 61. 61 + 0. 91 b 54. 24 + 0. 29 b 50: 50 54. 60 + 0. 28 c 51. 64 + 0. 24 c Mean values with different superscript along the column were significantly different (p<0. 005)
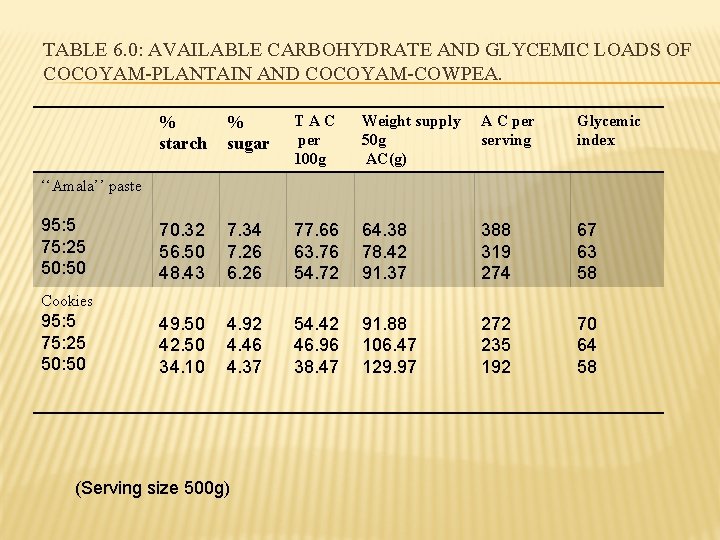
TABLE 6. 0: AVAILABLE CARBOHYDRATE AND GLYCEMIC LOADS OF COCOYAM-PLANTAIN AND COCOYAM-COWPEA. % starch % sugar TAC per 100 g Weight supply 50 g AC(g) A C per serving Glycemic index 70. 32 56. 50 48. 43 7. 34 7. 26 6. 26 77. 66 63. 76 54. 72 64. 38 78. 42 91. 37 388 319 274 67 63 58 49. 50 42. 50 34. 10 4. 92 4. 46 4. 37 54. 42 46. 96 38. 47 91. 88 106. 47 129. 97 272 235 192 70 64 58 ‘‘Amala’’ paste 95: 5 75: 25 50: 50 Cookies 95: 5 75: 25 50: 50 (Serving size 500 g)
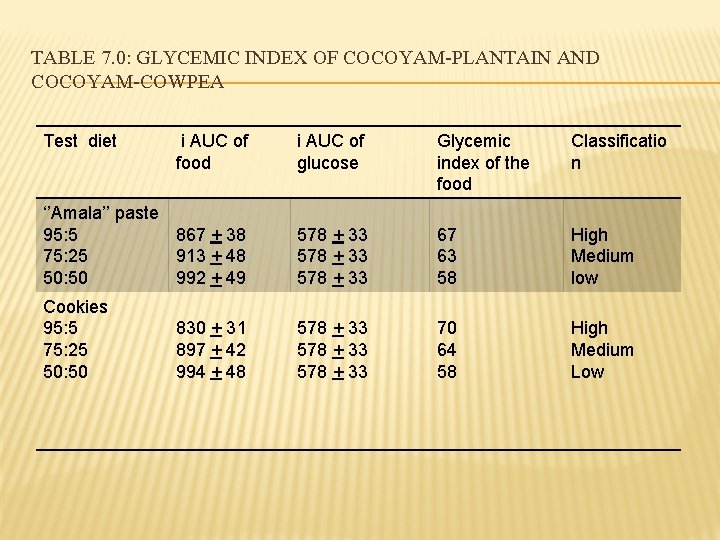
TABLE 7. 0: GLYCEMIC INDEX OF COCOYAM-PLANTAIN AND COCOYAM-COWPEA Test diet i AUC of food i AUC of glucose Glycemic index of the food Classificatio n ‘’Amala’’ paste 95: 5 867 + 38 75: 25 913 + 48 50: 50 992 + 49 578 + 33 67 63 58 High Medium low Cookies 95: 5 75: 25 50: 50 578 + 33 70 64 58 High Medium Low 830 + 31 897 + 42 994 + 48
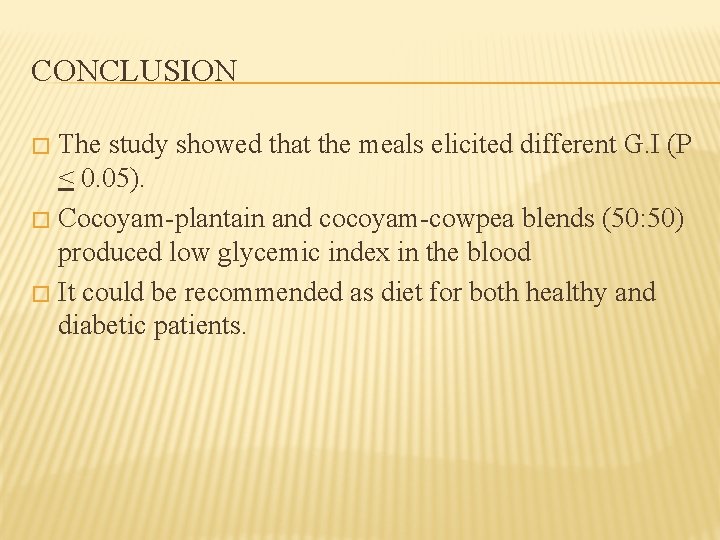
CONCLUSION The study showed that the meals elicited different G. I (P < 0. 05). � Cocoyam-plantain and cocoyam-cowpea blends (50: 50) produced low glycemic index in the blood � It could be recommended as diet for both healthy and diabetic patients. �
SELECTED REFERENCE � � � Brown F. , Bjorck L. , Frayn K. N. , Gibbs A. L. , Lang V. , Slana G. And Wolever T. M. S. 2005. Glycemic index methodology. Nutrition Research Review 18: 145 – 171 Ojinnaka M. C. , Akobundu, E. N. T. and Iwe M. O. 2009. Cocoyam starch modification effect on functional sensory and cookies qualities. Pakistan Journal of Nutrition 8(6): 558 -567 Wolever, T. M. S and Menling, C. 2003. Long-term effect of varying the source or amount of dietary carbohydrate on postprandial plasma glucose, insulin, triaclylglycerol and free fatty acid. Concentrations in subjects with impaired glucose tolerance. American journal of clinical nutrition 77 (3): 612 -621.
THANK YOU