ANALYZING DATA TO CREATE INSTRUCTIONAL MITIGATIONS Emilia Calderon


- Slides: 10
ANALYZING DATA TO CREATE INSTRUCTIONAL MITIGATIONS Emilia Calderon Ariel Kirshenbaum Mark Lobaco Fahima Zaman March 8, 2016 Academic Subcommittee Meeting
The Mathematics Center is dedicated to: Improving teacher content knowledge Promoting collaborative lesson design with best practices Providing coaching support in the classroom Utilizing benchmark assessment results to create instructional mitigations that increase student achievement
Why do we analyze benchmark data? • • • To inform practice To develop and implement instructional mitigations To develop and implement content-specific best practices To inform professional development needs To examine general district and site trends; not for teacher evaluation
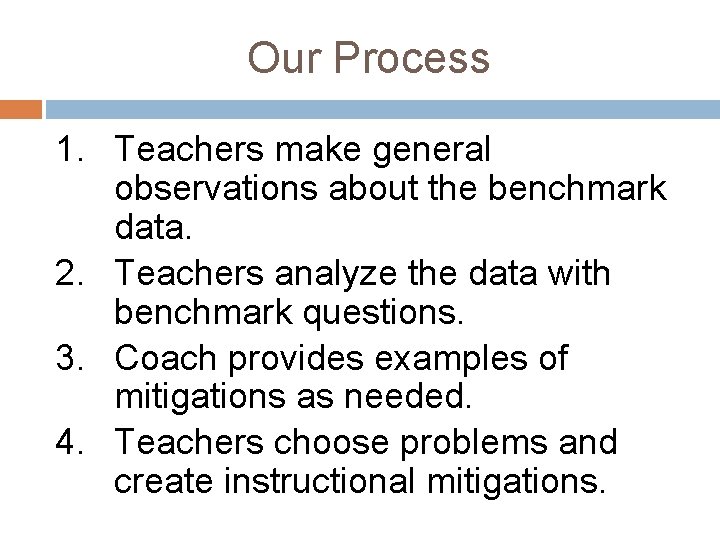
Our Process 1. Teachers make general observations about the benchmark data. 2. Teachers analyze the data with benchmark questions. 3. Coach provides examples of mitigations as needed. 4. Teachers choose problems and create instructional mitigations.
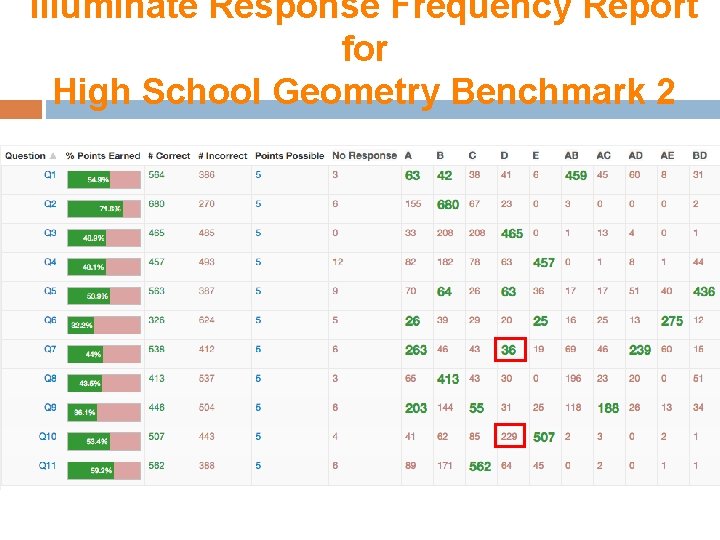
Illuminate Response Frequency Report for High School Geometry Benchmark 2
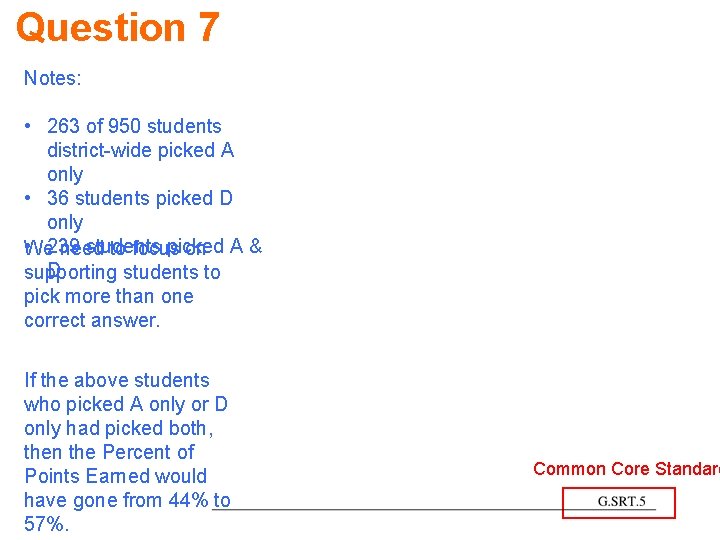
Question 7 Notes: • 263 of 950 students district-wide picked A only • 36 students picked D only • 239 students picked We need to focus on A & D supporting students to pick more than one correct answer. If the above students who picked A only or D only had picked both, then the Percent of Points Earned would have gone from 44% to 57%. Common Core Standard
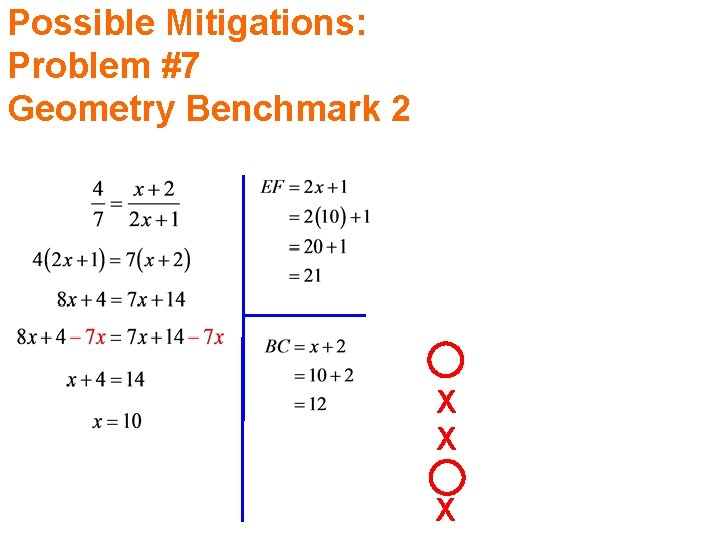
Possible Mitigations: Problem #7 Geometry Benchmark 2 X X X
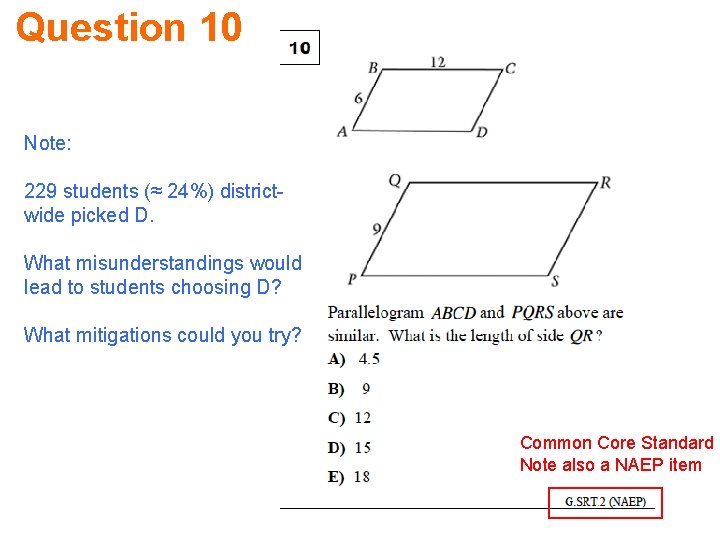
Question 10 Note: 229 students (≈ 24%) districtwide picked D. What misunderstandings would lead to students choosing D? What mitigations could you try? Common Core Standard Note also a NAEP item
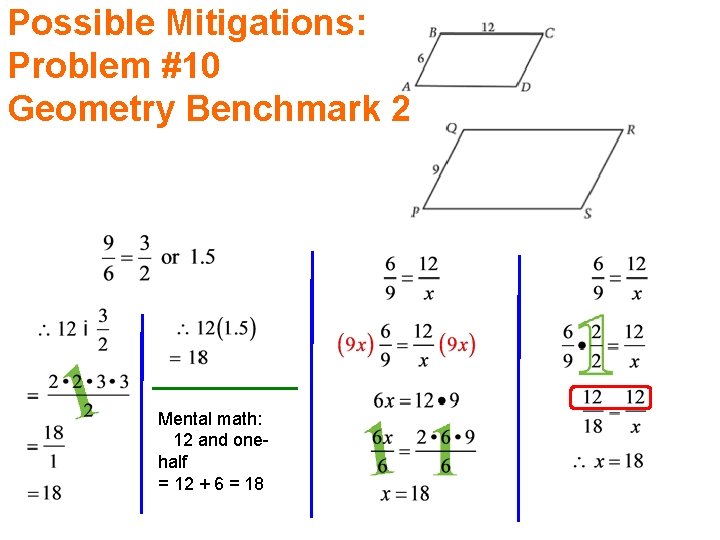
Possible Mitigations: Problem #10 Geometry Benchmark 2 Mental math: 12 and onehalf = 12 + 6 = 18
Your Turn, Teachers!!