Analysis of Economic Situation 3 ECONOMIC INDICATORS 3
- Slides: 17
Analysis of Economic Situation 3. ECONOMIC INDICATORS 3. 1. Macroeconomic Indicators
Macroeconomic Indicators • Macroeconomics: A branch of economics dealing with the performance, structure, behavior, and decision-making of an economy as a whole (national, regional, and global economies) • Key issues: – national economy output – inflation – unemployment – fiscal problems 2
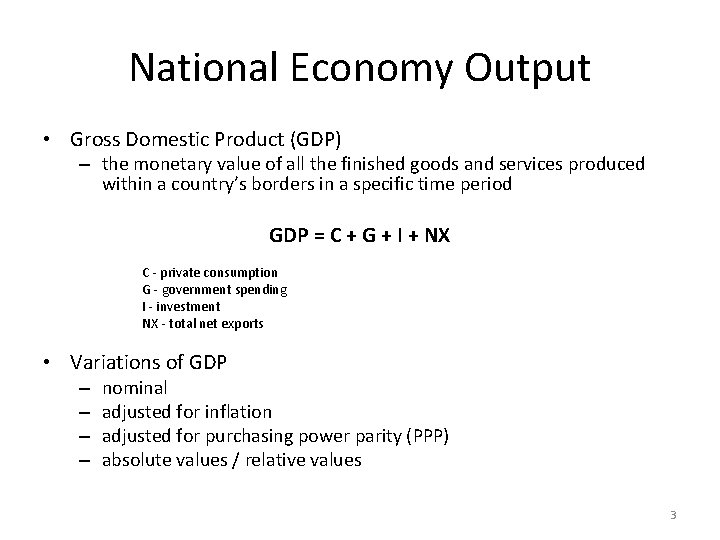
National Economy Output • Gross Domestic Product (GDP) – the monetary value of all the finished goods and services produced within a country’s borders in a specific time period GDP = C + G + I + NX C - private consumption G - government spending I - investment NX - total net exports • Variations of GDP – – nominal adjusted for inflation adjusted for purchasing power parity (PPP) absolute values / relative values 3
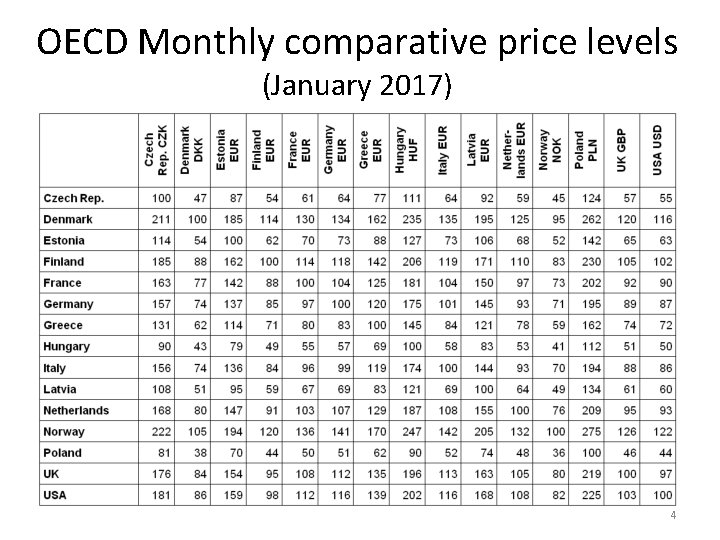
OECD Monthly comparative price levels (January 2017) 4
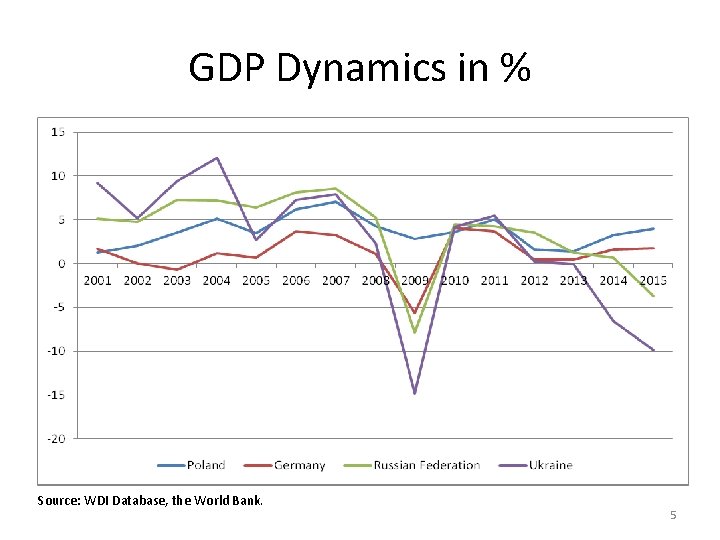
GDP Dynamics in % Source: WDI Database, the World Bank. 5
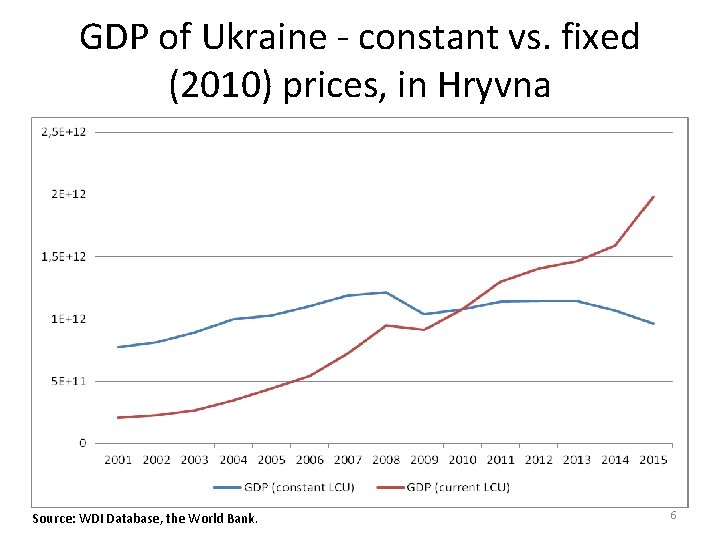
GDP of Ukraine - constant vs. fixed (2010) prices, in Hryvna Source: WDI Database, the World Bank. 6
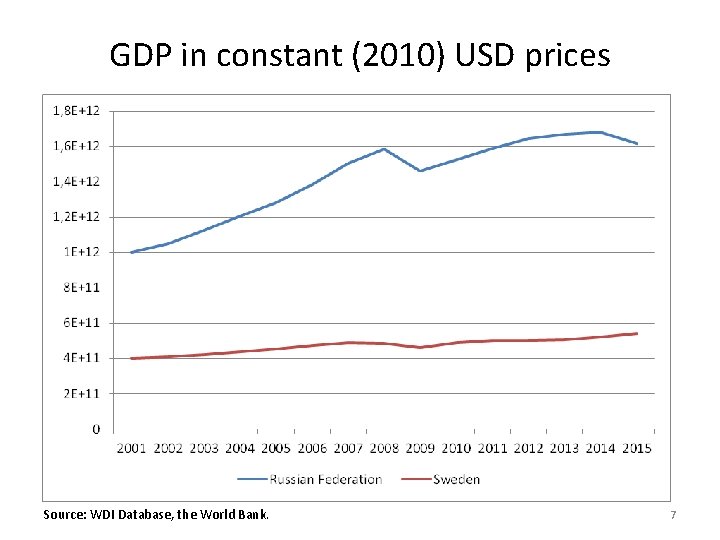
GDP in constant (2010) USD prices Source: WDI Database, the World Bank. 7
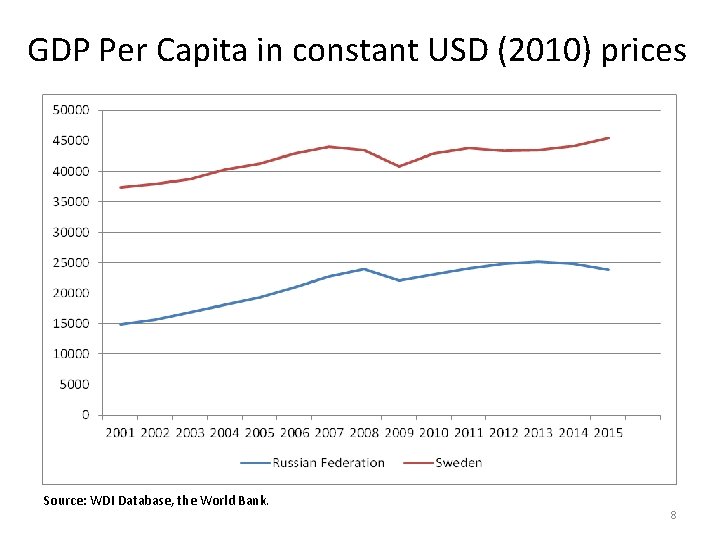
GDP Per Capita in constant USD (2010) prices Source: WDI Database, the World Bank. 8
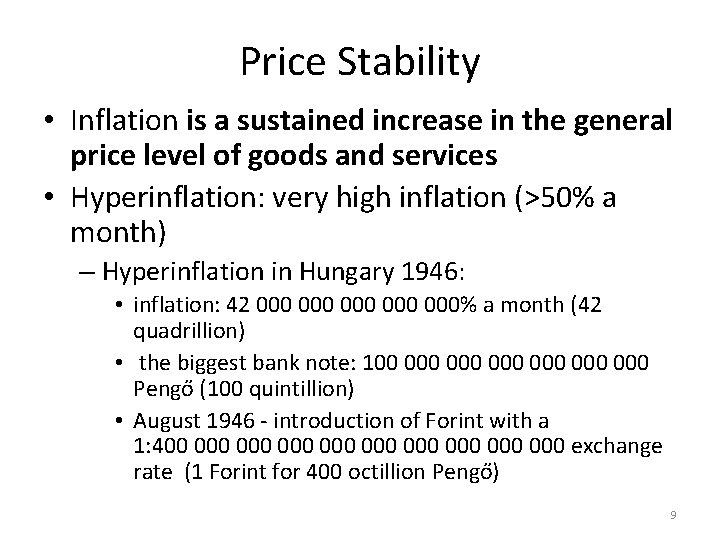
Price Stability • Inflation is a sustained increase in the general price level of goods and services • Hyperinflation: very high inflation (>50% a month) – Hyperinflation in Hungary 1946: • inflation: 42 000 000 000% a month (42 quadrillion) • the biggest bank note: 100 000 000 000 Pengő (100 quintillion) • August 1946 - introduction of Forint with a 1: 400 000 000 000 exchange rate (1 Forint for 400 octillion Pengő) 9
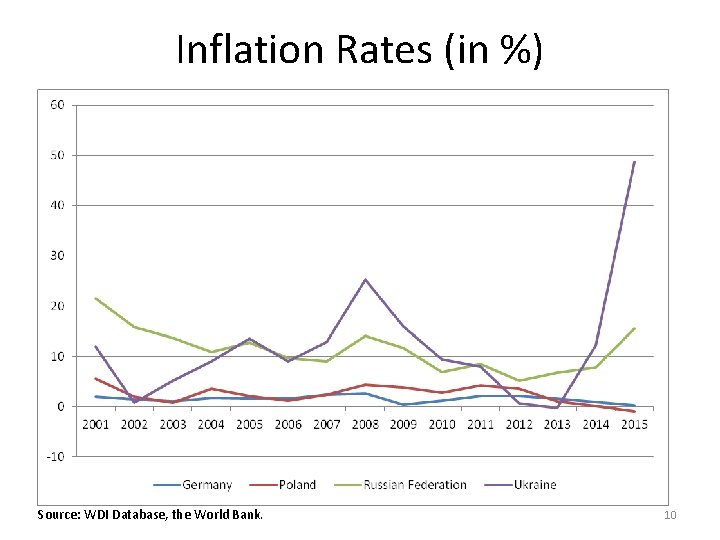
Inflation Rates (in %) Source: WDI Database, the World Bank. 10
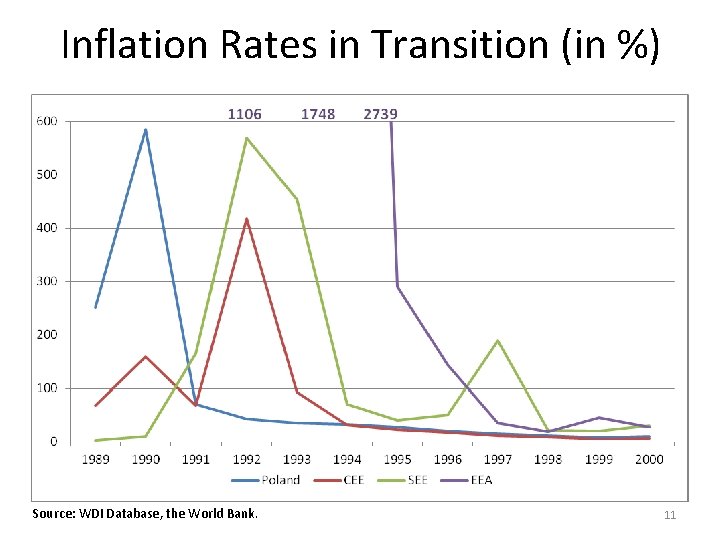
Inflation Rates in Transition (in %) Source: WDI Database, the World Bank. 11
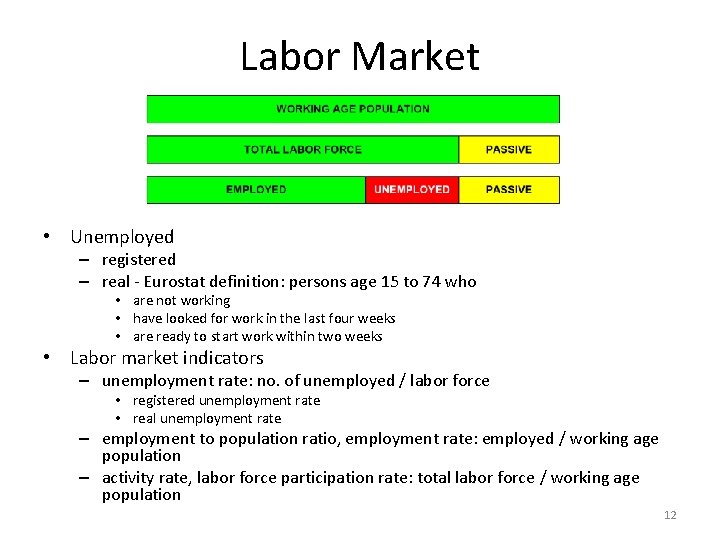
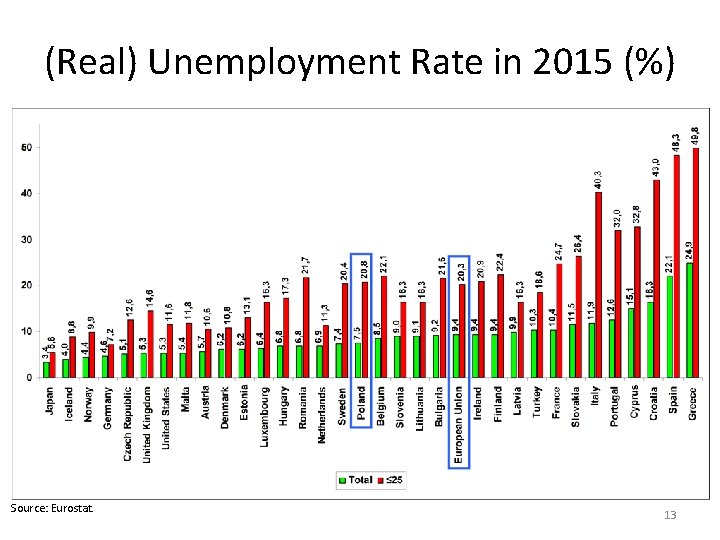
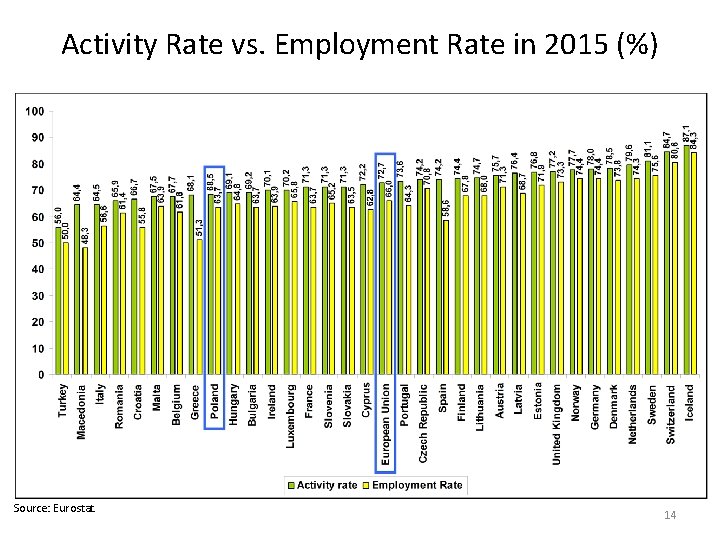
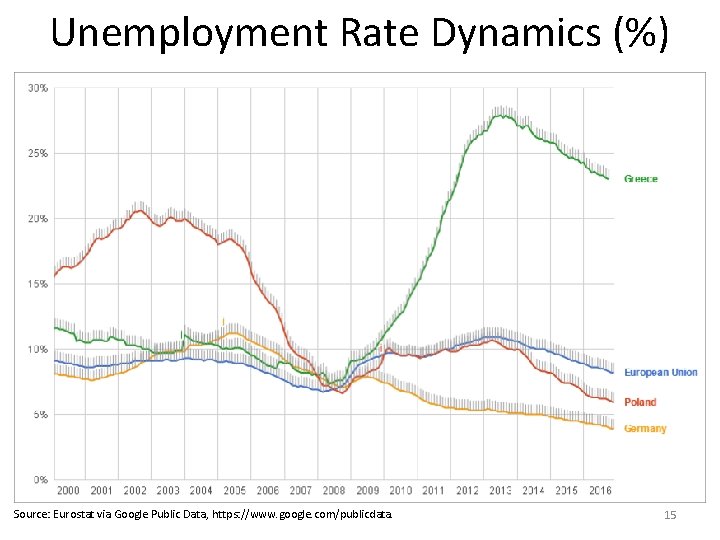
Labor Market • Unemployed – registered – real - Eurostat definition: persons age 15 to 74 who • are not working • have looked for work in the last four weeks • are ready to start work within two weeks • Labor market indicators – unemployment rate: no. of unemployed / labor force • registered unemployment rate • real unemployment rate – employment to population ratio, employment rate: employed / working age population – activity rate, labor force participation rate: total labor force / working age population 12
(Real) Unemployment Rate in 2015 (%) Source: Eurostat. 13
Activity Rate vs. Employment Rate in 2015 (%) Source: Eurostat. 14
Unemployment Rate Dynamics (%) Source: Eurostat via Google Public Data, https: //www. google. com/publicdata. 15
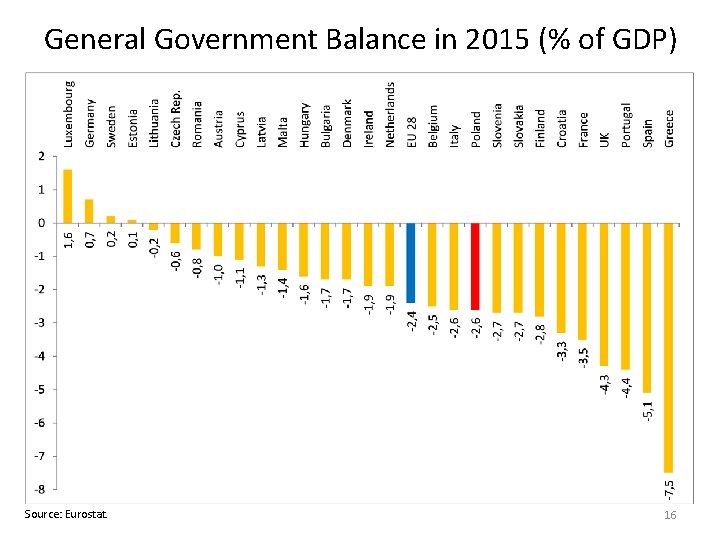
General Government Balance in 2015 (% of GDP) Source: Eurostat. 16
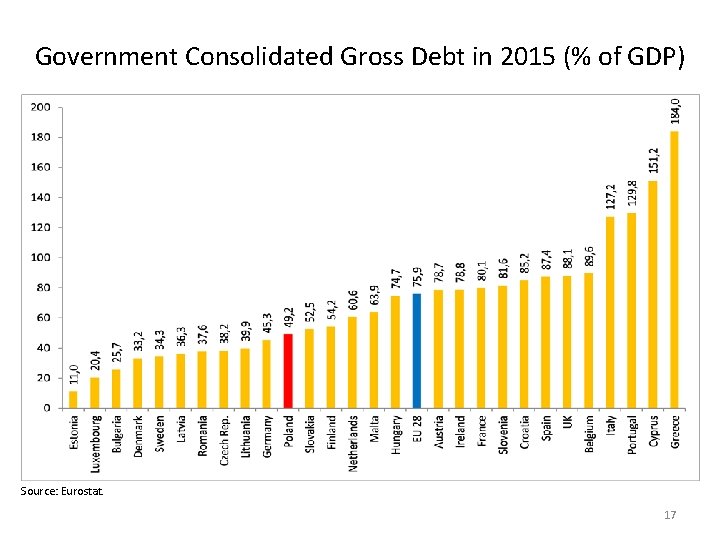
Government Consolidated Gross Debt in 2015 (% of GDP) Source: Eurostat. 17