AEA 2020 paper Inequality Dynamics amidst Rapid Growth


- Slides: 16

AEA 2020 paper: Inequality Dynamics amidst Rapid Growth: A Post Liberalization Indian Perspective Sriram Balasubramanian (IMF) Rishabh Kumar (California State University) Prakash Loungani (IMF)

Contents of the paper • • Introduction and Context Key Questions Approach and Analysis Overview Evolution of inequality in India a. Gini index based analysis (including comparative with other countries) b. Growth Incidence Curve (GIC) based analysis c. Inter-State income based analysis • Rural/Urban inequality a. GIC Rural Inequality with comparative analysis with China and Indonesia b. GIC Urban Inequality with comparative analysis with China and Indonesia • Direct Benefit Transfers (DBT) a. DBT by State and Schemes b. Progress and Income Effects of DBT c. Income based savings from scheme based transfers d. Scenario based impact by DBT on GIC

Introduction and Context • Economic growth has rapidly accelerated since the economic reforms/liberalization in the 1990’s. • Due to lack of systematically comparable data, it is so far unclear how this evolution of inequality reflects the changing rural-urban profile and the growth of the organized sector. • Furthermore, the impact of DBT has been marginally analyzed in the literature especially in the context of inequality.

Key Questions • How has income inequality evolved over the period of rapid growth? How do incomes compare across states, across urban and rural areas, and across deciles within rural and urban areas? • How is income inequality likely to evolve in the future in India given the increased prevalence of direct benefit transfer schemes?

Approach and Analysis Overview • Three main approaches to our analysis: The Gini coefficient approach, inter-state incomes and the Growth incidence curve approach (GIC). • Within Gini index, we focus on the consumption gini in India and compare it with other countries. • In the GIC and the state per capita incomes approach, through the Lewis type process, we look at the evolution of the rural-urban profile/inter-state changes in the last few decades. • Estimate DBT impact on inequality in recent years.

Evolution of inequality—Gini Index approach Gini Index for India, China, Brazil, Russia and South Africa from 1990 onwards Source: WBG Povcalnet and Authors analysis Comparative consumption Gini for India, China and Indonesia from 1980 onwards Source: WBG Povcalnet and Authors analysis

Evolution of inequality—GIC approach GIC Curve for India (Rural/Urban/National Aggregate) from 1990 -2011 Source: WBG Povcalnet database and authors analysis • The graph indicates that the India national aggregate’s annual growth in average decile income for the top 10 percent (1990 -2011) increased by almost 2. 8 percent while the bottom 10 percent grew by just around 1. 7 percent. • In rural areas, the disparity seems to be equally high with the top 10 percent growing by approximately 2. 5 percent and the bottom 10 percent growing by just around 1. 7 percent for the same time period. • In urban areas, the growth in income in the top 10 percent was just above 3. 0 percent while the bottom 10 percent grew by around 1. 5 percent.

Evolution of inequality—GIC approach Source: WBG Povcalnet database and authors analysis Source: Authors analysis

Evolution of inequality—Inter-state incomes Inter-state income analysis without population thresholds, 2011 -2018 Source: Central Statistics Office, Government of India Inter-state income analysis with population thresholds, 2004 and 2013 Source: Central Statistics Office, Government of India

Rural/Urban Inequality GIC curves for India, China and Indonesia rural 1990 -2017 Source: WBG Povcalnet database and authors analysis GIC curves for India, China and Indonesia urban 1990 -2017

Direct Benefit Transfers • a. b. c. Source: DBT Mission GOI and authors analysis DBT transfers have increased from almost 1, 034 million USD in 2013/14, it has increased to almost 30, 061 million USD in 2018/19 according to official records. There was 30 times increase in DBT transfer has been attributed to a few factors. First, the integration of JAM (Jan Dhan Yogana, Aadhar and Mobile) has been accelerated significantly. This has provided an important template to scale up the DBT program at an accelerated pace. Second, the improvements in efficiency in the DBT program, which we highlight in the paper, has improved the targeting to a large extent. Moreover, it has also ensured substantive savings to the government due to identification of fake and overlapping accounts and reduction in corruption due to the elimination of middle men

DBT by Schemes

DBT by States Source: DBT Mission and authors analysis

DBT Savings

Key Findings • Greater rural-urban inequality divergence when compared to interstate inequality divergence aligning to Lewis approach. • Comparative approach with other similar countries indicates that certain aspects of India’s growth story is more equitable than other countries. • Impact of DBT, while though nascent, could have a substantial impact in the 10 th/20 th decile income levels if implemented in a sustained manner.

THANK YOU! • Q and A session
 Joy amidst suffering
 Poverty amidst plenty
 1-6 solving compound and absolute value inequalities
 Aea joe listings
 Aea joe listings
 Aea 90364
 Aea
Aea Aea sjc
 Bts aea
 Avinash dixit education
 Datacenterdynamics
 Define growth analysis
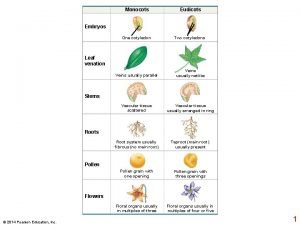
 Monocots eudicots
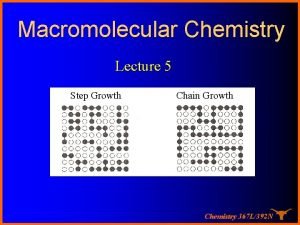
 Step growth polymerization vs chain growth
 Primary growth and secondary growth in plants
 Chapter 35 plant structure growth and development
 Geometric growth graph


