Wellcome Collection audience survey Peter Williams August 2017

- Slides: 5
Wellcome Collection audience survey Peter Williams, August 2017
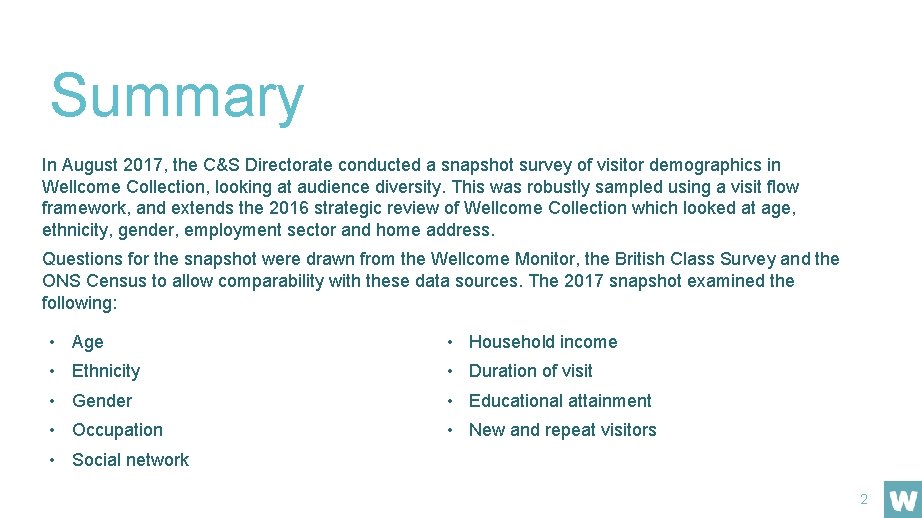
Summary In August 2017, the C&S Directorate conducted a snapshot survey of visitor demographics in Wellcome Collection, looking at audience diversity. This was robustly sampled using a visit flow framework, and extends the 2016 strategic review of Wellcome Collection which looked at age, ethnicity, gender, employment sector and home address. Questions for the snapshot were drawn from the Wellcome Monitor, the British Class Survey and the ONS Census to allow comparability with these data sources. The 2017 snapshot examined the following: • Age • Household income • Ethnicity • Duration of visit • Gender • Educational attainment • Occupation • New and repeat visitors • Social network 2
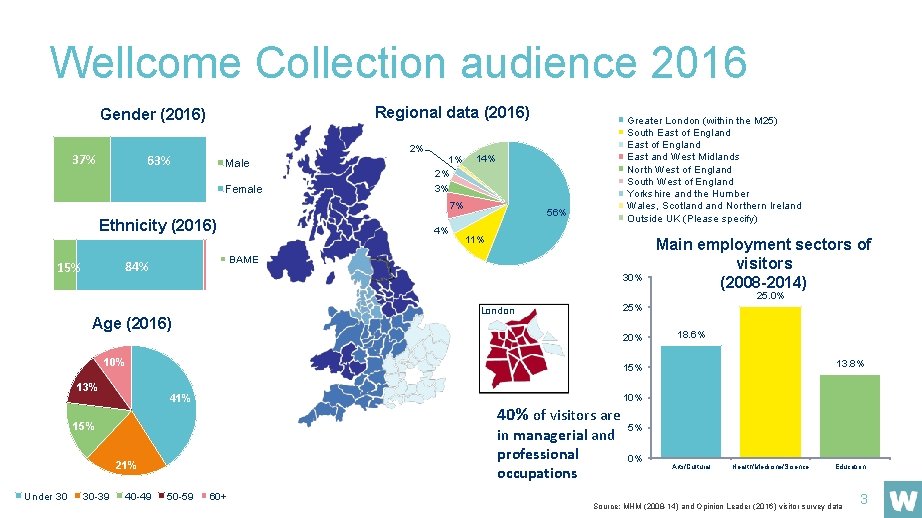
Wellcome Collection audience 2016 Regional data (2016) Gender (2016) 37% 2% 63% Male 1% 2% Female 3% 14% 7% Ethnicity (2016) 56% 11% BAME 84% 15% 4% Greater London (within the M 25) South East of England East and West Midlands North West of England South West of England Yorkshire and the Humber Wales, Scotland Northern Ireland Outside UK (Please specify) 30% Main employment sectors of visitors (2008 -2014) 25. 0% 25% London Age (2016) 20% 13% 41% 40% of visitors are in managerial and professional occupations 21% 30 -39 40 -49 13. 8% 15% Under 30 18. 6% 50 -59 60+ 10% 5% 0% Arts/Cultural Health/Medicine/Science Education Source: MHM (2008 -14) and Opinion Leader (2016) visitor survey data 3
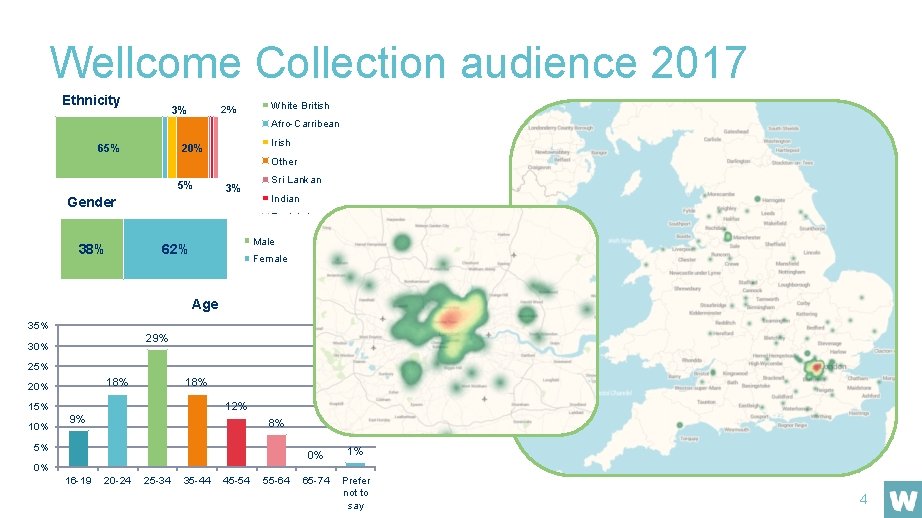
Wellcome Collection audience 2017 Ethnicity 2% 3% White British Afro-Carribean 37% 65% 63% Irish 20% Other 5% Gender 3% Sri Lankan Indian East Asian 38% Male 62% Female Age 35% 29% 30% 25% 18% 20% 18% 12% 15% 10% 9% 8% 5% 0% 1% 65 -74 Prefer not to say 0% 16 -19 20 -24 25 -34 35 -44 45 -54 55 -64 4
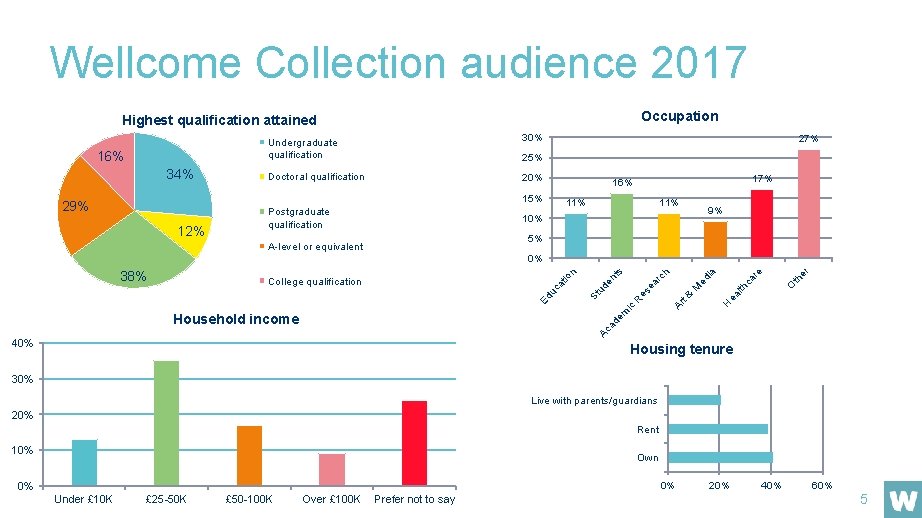
Wellcome Collection audience 2017 Occupation Highest qualification attained 37%16% 63% 34% Undergraduate qualification 30% Doctoral qualification 20% 27% 25% 15% 29% 12% Postgraduate qualification 17% 16% 11% 9% 10% 5% A-level or equivalent lth er th H ea O ca r ed M t& Ar R em ic e ia h rc es ea ud St Ed uc at io College qualification en n 38% ts 0% Ac ad Household income 40% Housing tenure 30% Live with parents/guardians 20% Rent 10% Own 0% 0% Under £ 10 K £ 25 -50 K £ 50 -100 K Over £ 100 K Prefer not to say 20% 40% 60% 5