We will set all students on a path





- Slides: 39
We will set all students on a path to success. TEAM Evaluation Measure Selection
ACADEMICS We will set all students on a path to success. WHOLE CHILD TENNESSEE PUBLIC SCHOOLS WILL BE EQUIPPED TO SERVE THE ACADEMIC AND NONACADEMIC NEEDS OF ALL STUDENTS ALL TENNESSEE STUDENTS WILL HAVE ACCESS TO A HIGHQUALITY EDUCATION, NO MATTER WHERE THEY LIVE EDUCATORS TENNESSEE WILL SET A NEW PATH FOR THE EDUCATION PROFESSION AND BE THE TOP STATE TO BECOME AND REMAIN A TEACHER AND LEADER
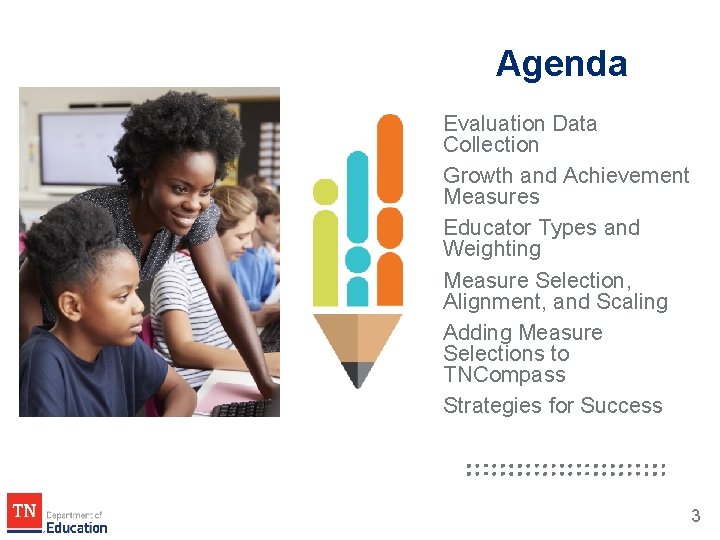
Agenda Evaluation Data Collection Growth and Achievement Measures Educator Types and Weighting Measure Selection, Alignment, and Scaling Adding Measure Selections to TNCompass Strategies for Success 3
Evaluation Data Collection
Tennessee Educator Acceleration Model Tennessee’s multi-measure evaluation model is known as the Tennessee Educator Acceleration Model or TEAM includes the following weighted measures: • Observation scores • Growth scores • Achievement scores • Student surveys (optional) These measures are captured in TNCompass and combined to form the educator’s level of overall effectiveness score or LOE.
TNCompass is the user-friendly database through which the department collects educator data from TEAM evaluations, including growth and achievement measure selections. Data quality and security is managed through role specific permissions.
Growth and Achievement Measures
Definitions Growth scores – scores created from the value-added measure of actual academic gains made by a student as compared to the expected academic gains by that student. • Growth scores are generated from TVAAS testing, portfolios, and alternatives to portfolio. • TVAAS scores may include up to three years of data when available. Individual growth scores – scores generated by tested grades/subjects, portfolios, and alternatives to portfolio. Composite growth scores – scores generated through the combination of test scores from multiple subjects. All composite scores are single year scores. 8
Definitions Achievement score – a measure of how well a student performs against a standard. • Achievement scores may be generated by a multitude of tests including TCAP tests, ACT, industry certifications, graduation rate, or many other measures. • In most cases, achievement scores must be scaled at the local level unless they are related to state testing. • Achievement scores are always a single year measure. 9
Educator Types and Weighting
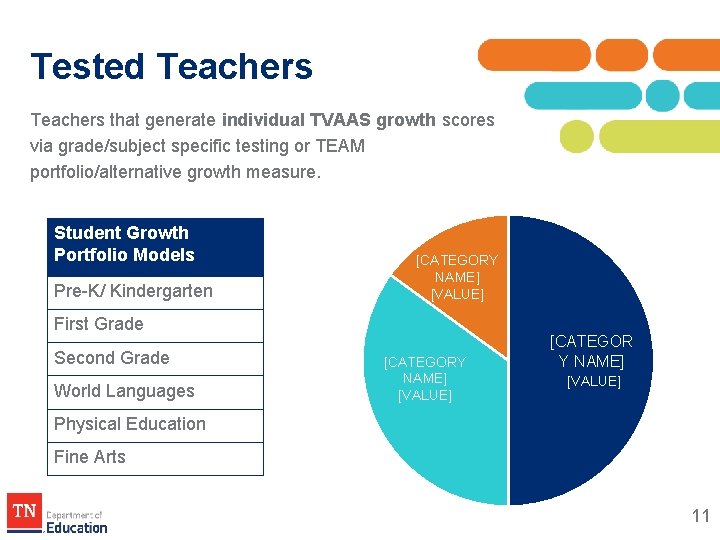
Tested Teachers that generate individual TVAAS growth scores via grade/subject specific testing or TEAM portfolio/alternative growth measure. Student Growth Portfolio Models Pre-K/ Kindergarten [CATEGORY NAME] [VALUE] First Grade Second Grade World Languages [CATEGORY NAME] [VALUE] [CATEGOR Y NAME] [VALUE] Physical Education Fine Arts 11
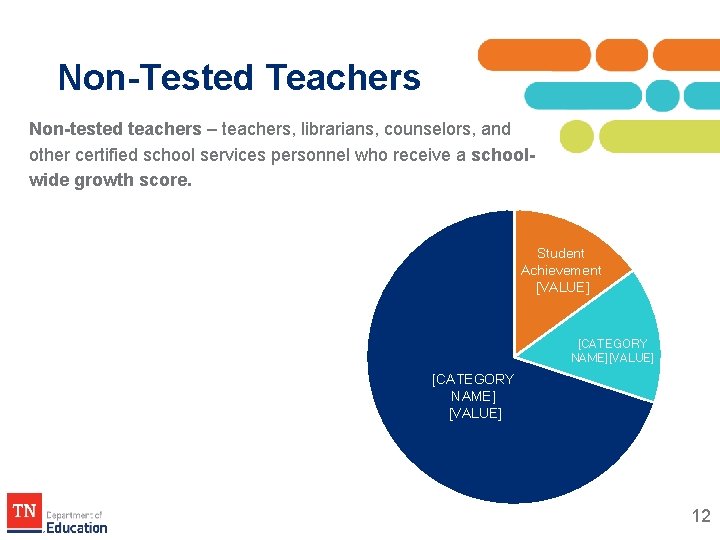
Non-Tested Teachers Non-tested teachers – teachers, librarians, counselors, and other certified school services personnel who receive a schoolwide growth score. Student Achievement [VALUE] [CATEGORY NAME] [VALUE] 12
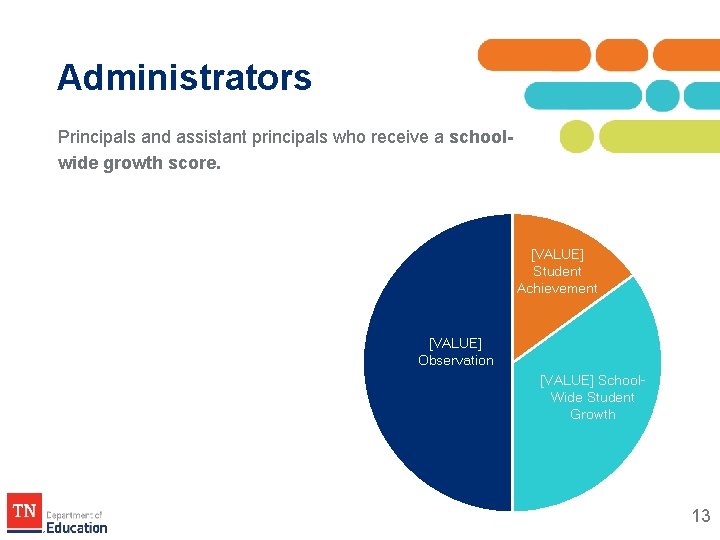
Administrators Principals and assistant principals who receive a schoolwide growth score. [VALUE] Student Achievement [VALUE] Observation [VALUE] School. Wide Student Growth 13
Measure Alignment, Selection, and Scaling 14
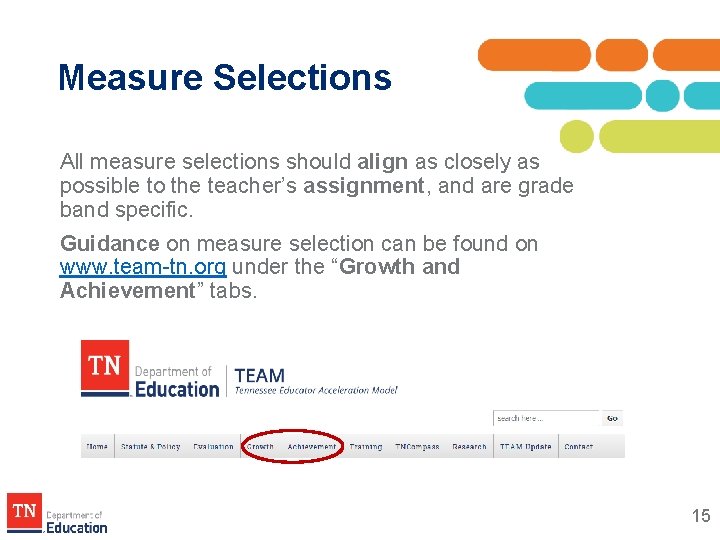
Measure Selections All measure selections should align as closely as possible to the teacher’s assignment, and are grade band specific. Guidance on measure selection can be found on www. team-tn. org under the “Growth and Achievement” tabs. 15
Measure Selection Guidance Growth Measure Guidance Achievement Measure Worksheet 16
Growth Measures There are five types of growth measures from which growth scores are generated. • Individual value-added scores (TVAAS) • Individual student growth portfolio or alternative growth measure • School-level TVAAS composites • District-level TVAAS composites • Feeder/Custom school- or district-level TVAAS composites • Used only in situations where the school does not generate its own TVAAS data (i. e. K-2 only school) All automatically populate in TNCompass other than feeder/custom measures, which must be uploaded by the school or district. 17
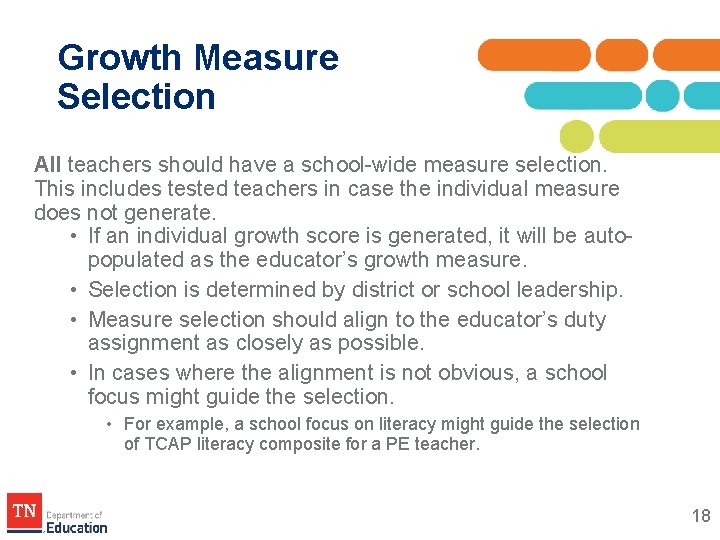
Growth Measure Selection All teachers should have a school-wide measure selection. This includes tested teachers in case the individual measure does not generate. • If an individual growth score is generated, it will be autopopulated as the educator’s growth measure. • Selection is determined by district or school leadership. • Measure selection should align to the educator’s duty assignment as closely as possible. • In cases where the alignment is not obvious, a school focus might guide the selection. • For example, a school focus on literacy might guide the selection of TCAP literacy composite for a PE teacher. 18
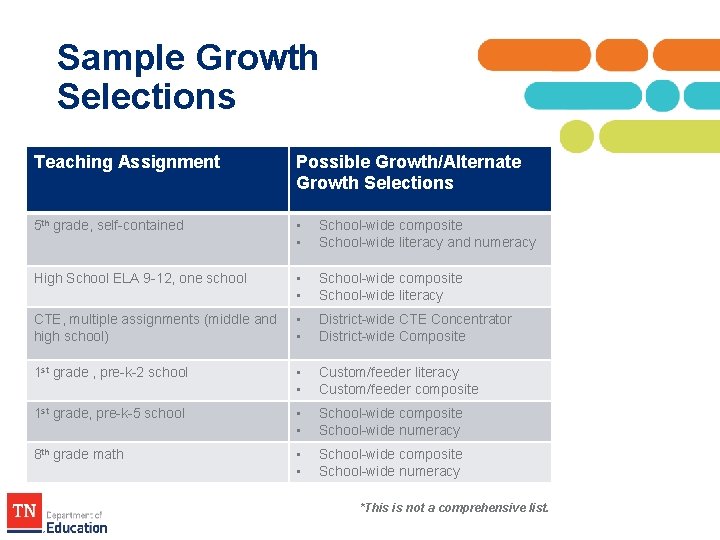
Sample Growth Selections Teaching Assignment Possible Growth/Alternate Growth Selections 5 th grade, self-contained • • School-wide composite School-wide literacy and numeracy High School ELA 9 -12, one school • • School-wide composite School-wide literacy CTE, multiple assignments (middle and high school) • • District-wide CTE Concentrator District-wide Composite 1 st grade , pre-k-2 school • • Custom/feeder literacy Custom/feeder composite 1 st grade, pre-k-5 school • • School-wide composite School-wide numeracy 8 th grade math • • School-wide composite School-wide numeracy *This is not a comprehensive list.
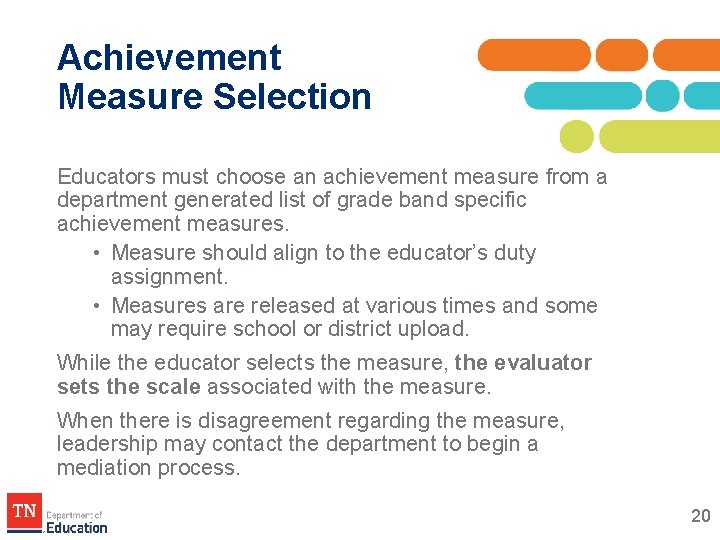
Achievement Measure Selection Educators must choose an achievement measure from a department generated list of grade band specific achievement measures. • Measure should align to the educator’s duty assignment. • Measures are released at various times and some may require school or district upload. While the educator selects the measure, the evaluator sets the scale associated with the measure. When there is disagreement regarding the measure, leadership may contact the department to begin a mediation process. 20
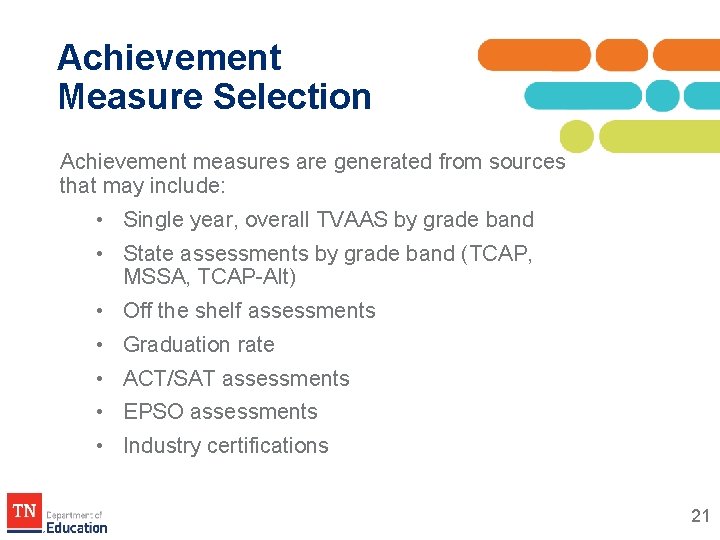
Achievement Measure Selection Achievement measures are generated from sources that may include: • Single year, overall TVAAS by grade band • State assessments by grade band (TCAP, MSSA, TCAP-Alt) • Off the shelf assessments • Graduation rate • ACT/SAT assessments • EPSO assessments • Industry certifications 21
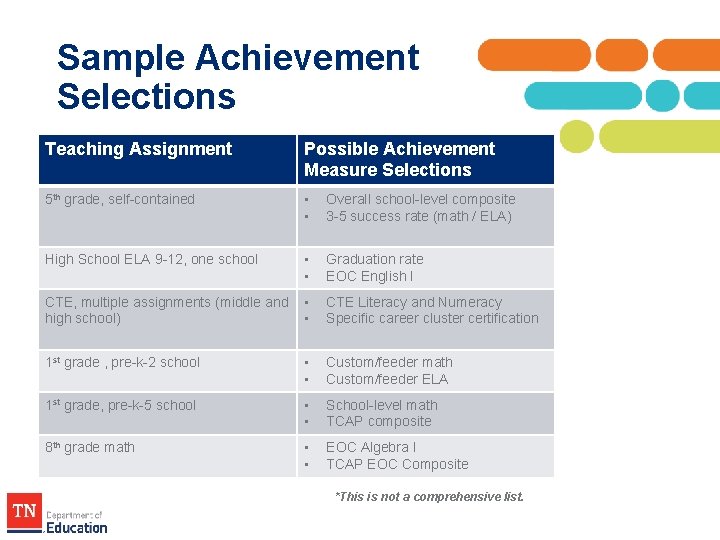
Sample Achievement Selections Teaching Assignment Possible Achievement Measure Selections 5 th grade, self-contained • • Overall school-level composite 3 -5 success rate (math / ELA) High School ELA 9 -12, one school • • Graduation rate EOC English I CTE, multiple assignments (middle and high school) • • CTE Literacy and Numeracy Specific career cluster certification 1 st grade , pre-k-2 school • • Custom/feeder math Custom/feeder ELA 1 st grade, pre-k-5 school • • School-level math TCAP composite 8 th grade math • • EOC Algebra I TCAP EOC Composite *This is not a comprehensive list.
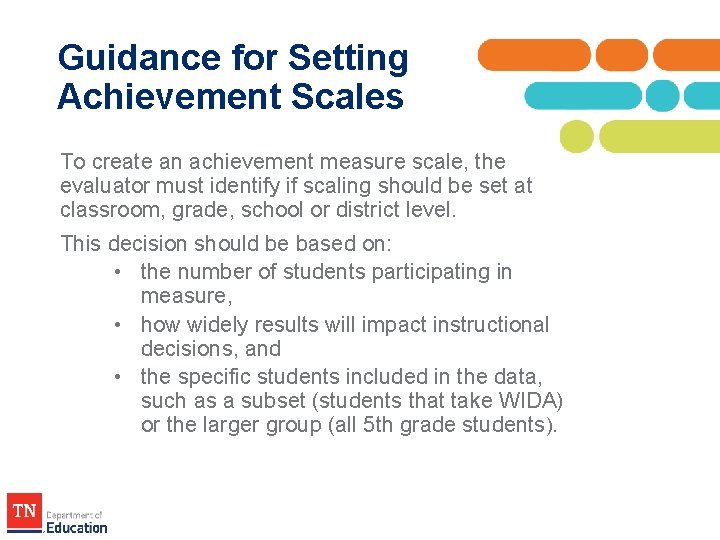
Guidance for Setting Achievement Scales To create an achievement measure scale, the evaluator must identify if scaling should be set at classroom, grade, school or district level. This decision should be based on: • the number of students participating in measure, • how widely results will impact instructional decisions, and • the specific students included in the data, such as a subset (students that take WIDA) or the larger group (all 5 th grade students).
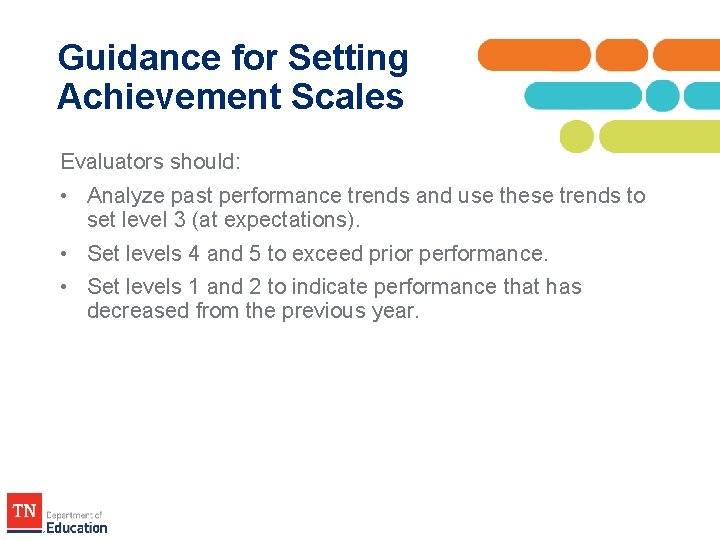
Guidance for Setting Achievement Scales Evaluators should: • Analyze past performance trends and use these trends to set level 3 (at expectations). • Set levels 4 and 5 to exceed prior performance. • Set levels 1 and 2 to indicate performance that has decreased from the previous year.
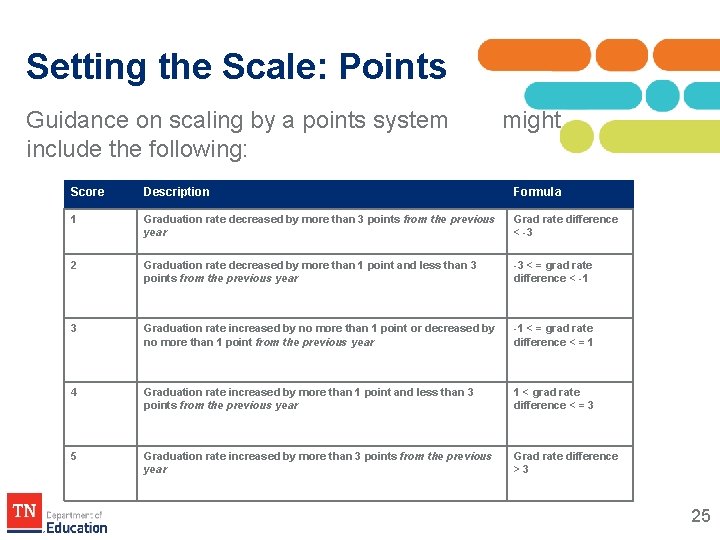
Setting the Scale: Points Guidance on scaling by a points system include the following: might Score Description Formula 1 Graduation rate decreased by more than 3 points from the previous year Grad rate difference < -3 2 Graduation rate decreased by more than 1 point and less than 3 points from the previous year -3 < = grad rate difference < -1 3 Graduation rate increased by no more than 1 point or decreased by no more than 1 point from the previous year -1 < = grad rate difference < = 1 4 Graduation rate increased by more than 1 point and less than 3 points from the previous year 1 < grad rate difference < = 3 5 Graduation rate increased by more than 3 points from the previous year Grad rate difference > 3 25
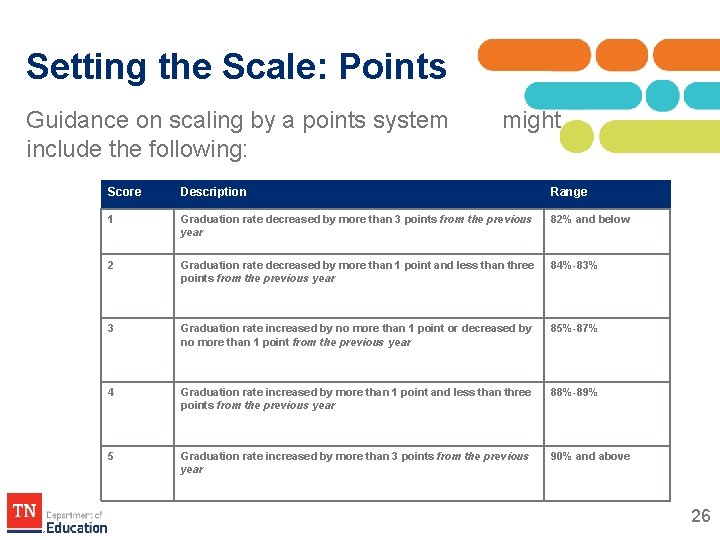
Setting the Scale: Points Guidance on scaling by a points system include the following: might Score Description Range 1 Graduation rate decreased by more than 3 points from the previous year 82% and below 2 Graduation rate decreased by more than 1 point and less than three points from the previous year 84%-83% 3 Graduation rate increased by no more than 1 point or decreased by no more than 1 point from the previous year 85%-87% 4 Graduation rate increased by more than 1 point and less than three points from the previous year 88%-89% 5 Graduation rate increased by more than 3 points from the previous year 90% and above 26
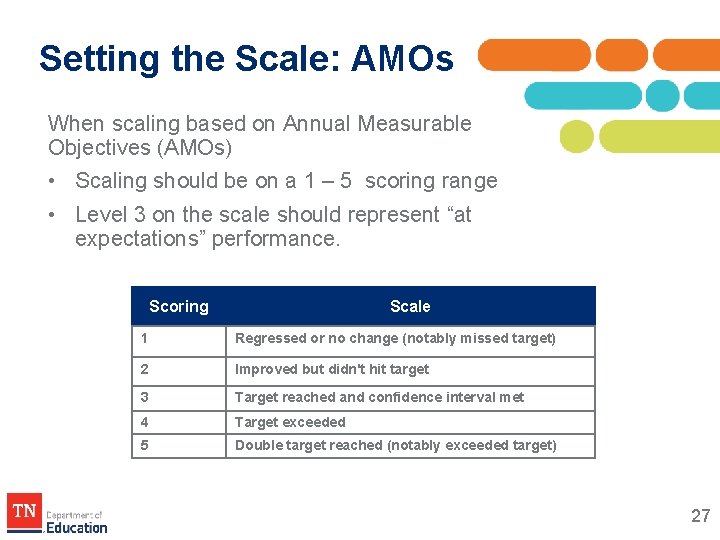
Setting the Scale: AMOs When scaling based on Annual Measurable Objectives (AMOs) • Scaling should be on a 1 – 5 scoring range • Level 3 on the scale should represent “at expectations” performance. Scoring Scale 1 Regressed or no change (notably missed target) 2 Improved but didn't hit target 3 Target reached and confidence interval met 4 Target exceeded 5 Double target reached (notably exceeded target) 27
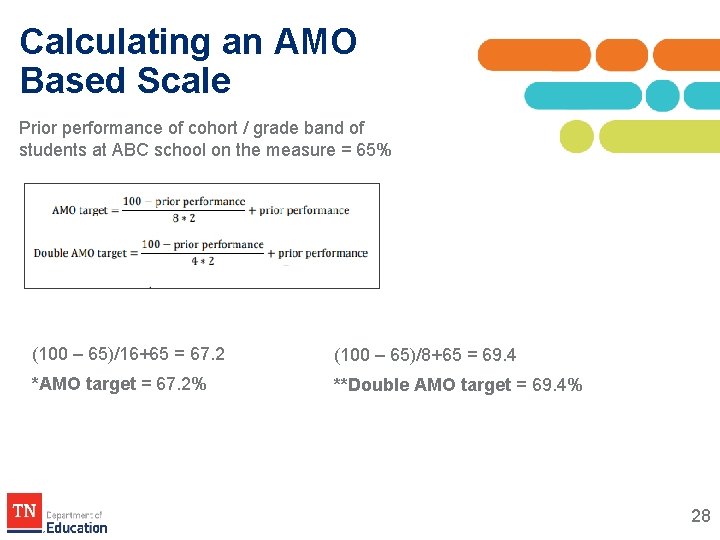
Calculating an AMO Based Scale Prior performance of cohort / grade band of students at ABC school on the measure = 65% (100 – 65)/16+65 = 67. 2 (100 – 65)/8+65 = 69. 4 *AMO target = 67. 2% **Double AMO target = 69. 4% 28
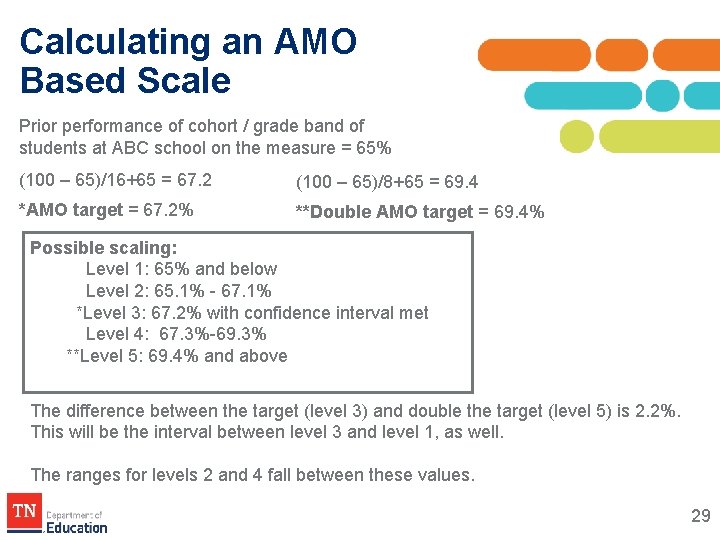
Calculating an AMO Based Scale Prior performance of cohort / grade band of students at ABC school on the measure = 65% (100 – 65)/16+65 = 67. 2 (100 – 65)/8+65 = 69. 4 *AMO target = 67. 2% **Double AMO target = 69. 4% Possible scaling: Level 1: 65% and below Level 2: 65. 1% - 67. 1% *Level 3: 67. 2% with confidence interval met Level 4: 67. 3%-69. 3% **Level 5: 69. 4% and above The difference between the target (level 3) and double the target (level 5) is 2. 2%. This will be the interval between level 3 and level 1, as well. The ranges for levels 2 and 4 fall between these values. 29
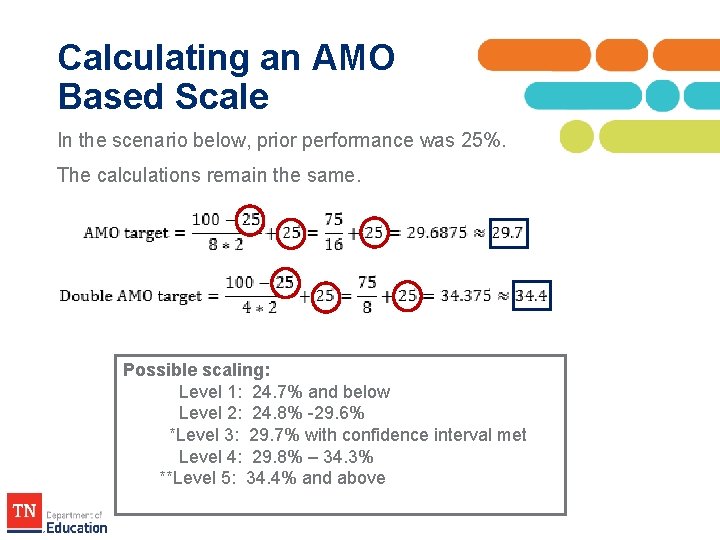
Calculating an AMO Based Scale In the scenario below, prior performance was 25%. The calculations remain the same. Possible scaling: Level 1: 24. 7% and below Level 2: 24. 8% -29. 6% *Level 3: 29. 7% with confidence interval met Level 4: 29. 8% – 34. 3% **Level 5: 34. 4% and above
Adding Measure Selections to TNCompass 31
Uploading Measure Selections to TNCompass Growth & Achievement Measure Import Instructions 32
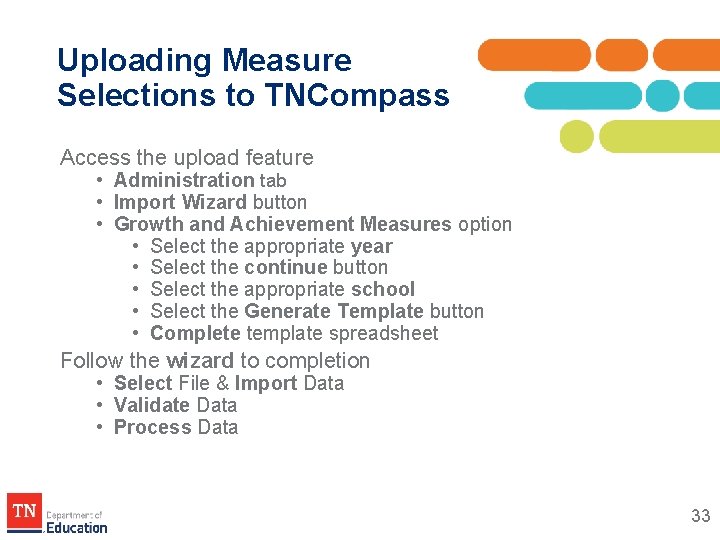
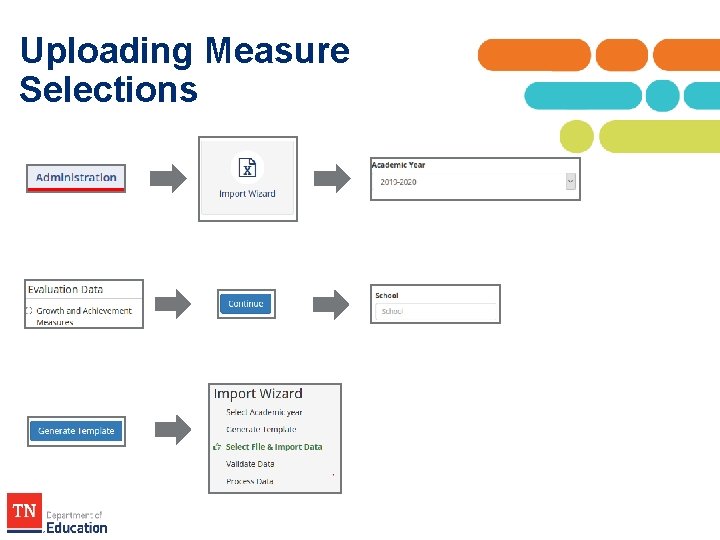
Uploading Measure Selections to TNCompass Access the upload feature • Administration tab • Import Wizard button • Growth and Achievement Measures option • Select the appropriate year • Select the continue button • Select the appropriate school • Select the Generate Template button • Complete template spreadsheet Follow the wizard to completion • Select File & Import Data • Validate Data • Process Data 33
Uploading Measure Selections
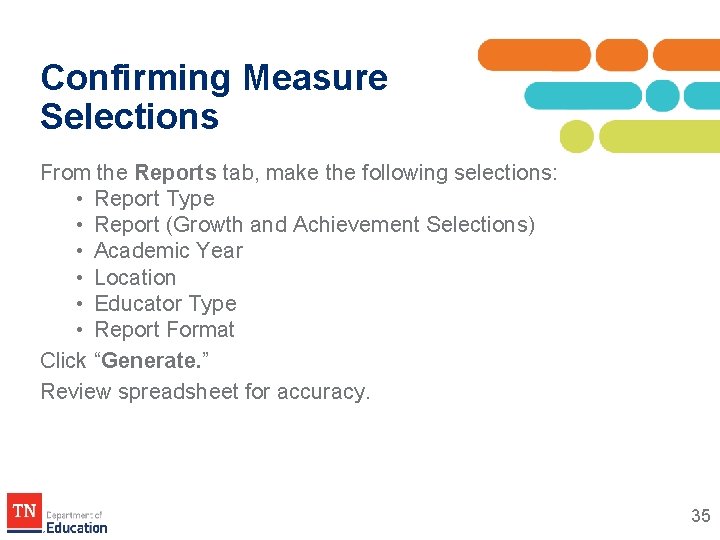
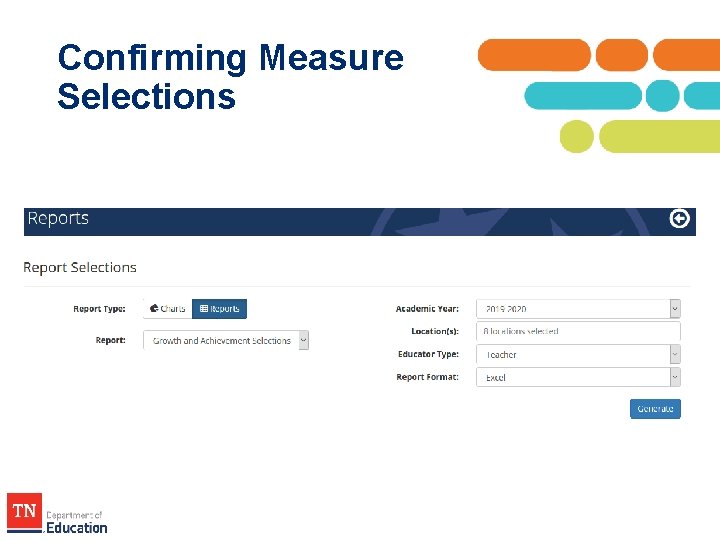
Confirming Measure Selections From the Reports tab, make the following selections: • Report Type • Report (Growth and Achievement Selections) • Academic Year • Location • Educator Type • Report Format Click “Generate. ” Review spreadsheet for accuracy. 35
Confirming Measure Selections
Strategies for Success
Strategies for Success Review the yearly evaluation timeline prior to the start of the school year • Subscribe to Human Capital Update and other department newsletters Review the Growth and Achievement Selections report to ensure all selections are complete. Know your resources • TNCompass guides • www. team-tn. org • TEAM. Questions@tn. gov • support@tncompass. org 38