Warmup 1 Write the equation of the line
 Write the equation of the line passing through (4, 5)(3, 2) in:")


 Enter data into")
 The table shows the cost of visiting a working ranch for one day")
 The table shows the cost of a catered lunch buffet for different numbers")
 The table shows the number of active woodpecker clusters in a part of")
 The table shows the weight of an alligator at various times during the")
 The table shows the duration of several eruptions of the geyser Old Faithful")
- Slides: 11
Warm-up 1) Write the equation of the line passing through (4, 5)(3, 2) in: Slope Intercept Form: Standard Form: Graph: Find intercepts.
LINES OF BEST FIT
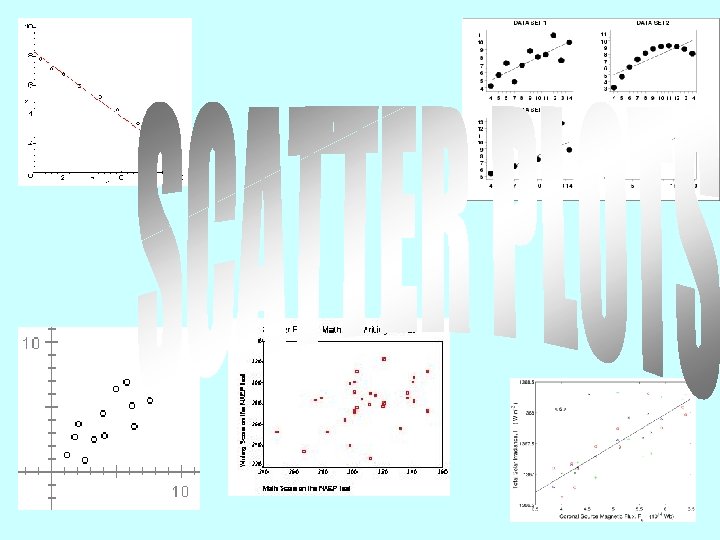
SCATTER PLOT • A graph used to determine whethere is a relationship between paired data. • These relationships may be linear, quadratic, cubic, quartic, logarithmic, exponential, etc. • Used to make predictions. • Linear patterns can be described according to the type of correlation.
SCATTER PLOT • A graph used to determine whethere is a relationship between paired data. • These relationships may be linear, quadratic, cubic, exponential, etc. • Used to make predictions. • Linear patterns can be described according to the type of correlation.
Using the calc to find a line of best fit 1) Enter data into L 1 and L 2 2) Press STAT CALC and then 4 Lin. Reg(ax+b) Enter x 1 2 3 y 15 21 22 4 5 26 28 What does this screen mean? The equation of the line of best fit is __________ Correlation coefficient is _____ so _____. Use the data/line of best fit to make predictions: What is the value of y when x=5. 2 ________ What is the value of x when y=10 ________
1) The table shows the cost of visiting a working ranch for one day and night for different numbers of people. Number of People 4 6 8 10 12 Cost (dollars) 250 350 450 550 650 a) Can the situation be modeled by a linear equation? Explain. b) What is the slope and what does it represent? c) Write an equation that gives the cost as a function of the number of people in the group.
2) The table shows the cost of a catered lunch buffet for different numbers of people. Number of People Cost (Dollars) 12 192 18 288 24 384 30 480 36 576 42 672 a) What is the slope and what does it represent? b) Write an equation that gives the cost of the lunch buffet as a function of the number of people attending. c) What is the cost of a lunch buffet for 120 people?
4) The table shows the number of active woodpecker clusters in a part of the De Soto National Forest in Mississippi. Year Active Clusters 1992 1993 22 24 1995 1996 1997 1998 1999 2000 27 27 34 40 42 45 51 a) Make a scatterplot of the data. Represent the x-axis as the number of years since 1990. b) Find the slope and describe what it represents. c) Write an equation that models the number of active clusters as a function of the number of years since 1990. d) Use the equation to determine the number of active clusters in the year 2010.
5) The table shows the weight of an alligator at various times during the feeding trial. Weeks 0 9 18 27 34 43 49 Weight (pounds) 6 8. 6 10 13. 6 15 17. 2 19. 8 a) Make a scatterplot of the data. b) Find the slope and describe what it represents. c) Write an equation of the best fitting line. d) Use the equation to predict the weight of this alligator at week. 52.
6) The table shows the duration of several eruptions of the geyser Old Faithful and the interval between eruptions. Duration (min) 1. 5 2 2. 5 3 3. 5 4 4. 5 5 Interval (min) 50 57 65 71 76 82 89 95 a) Make a scatterplot of the data and draw a line of best fit. b) Write an equation that models the interval as a function of an eruption’s duration. c) Predict the interval between geysers for a duration of 6 minutes.