Understanding SEP properties through Neutron Monitor data modeling

- Slides: 5
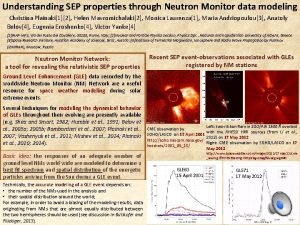
Understanding SEP properties through Neutron Monitor data modeling Christina Plainaki[1][2], Helen Mavromichalaki[2], Monica Laurenza[1], Maria Andriopoulou[3], Anatoly Belov[4], Eugenia Eroshenko[4], Victor Yanke[4] [1]INAF-IAPS, Via del Fosso del Cavaliere, 00133, Rome, Italy; [2]Nuclear and Particle Physics Section, Physics Dpt. , National and Kapodistrian University of Athens, Greece [3]Space Research Institute, Austrian Academy of Sciences, Graz, Austria; [4]Institute of Terrestrial Magnetism, Ionosphere and Radio Wave Propagation by Pushkov (IZMIRAN), Moscow, Russia Neutron Monitor Network: a tool for revealing the relativistic SEP properties Recent SEP event-observations associated with GLEs registered by NM stations Ground Level Enhancement (GLE) data recorded by the worldwide Neutron Monitor (NM) Network are a useful resource for space weather modeling during solar extreme events. Several techniques for modeling the dynamical behavior of GLEs throughout their evolving are presently available (e. g. Shea and Smart, 1982; Humble et al. , 1991; Belov et al. , 2005 a; 2005 b; Bombardieri et al. , 2007; Plainaki et al. , 2007; Vashenyuk et al. , 2011; Mishev et al. , 2014; Plainaki et al. , 2010; 2014). Basic idea: the responses of an adequate number of ground level NMs world wide are modeled to determine a best fit spectrum and spatial distribution of the energetic particles arriving from the Sun during a GLE event. Technically, the accurate modeling of a GLE event depends on: that used are • The thefunctions number of the NMsare usedbeing in the analysis and chosen as to thedistribution physical around processes involved in the particle • represent their spatial the world; For example, in order to avoid biasing of the modeling-results, data rigidity distribution and a propagation as well as the originating NMsatmosphere that are almost distributed between response from of the to equally energetic solar particle the two hemispheres should be used (see discussion in Bütikofer and fluxes. Flückiger, 2013). Left: two-ribbon flare in SDO/AIA 1600 A overlaid CME observation by with the RHESSI HXR sources (from Li et al. , SOHO/LASCO on 15 April 2001 2013) on 17 May 2012 http: //soho. nascom. nasa. gov/ Right: CME observation by SOHO/LASCO on 17 hots/2001_04_15/ May 2012 http: //www. spaceweather. com/images 2012/17 may 12/cme _anim. gif? PHPSESSID=gmt 7 p 9 bqv 1 taqfhivucgnrg 640 GLE 60 15 April 2001 GLE 71 17 May 2012
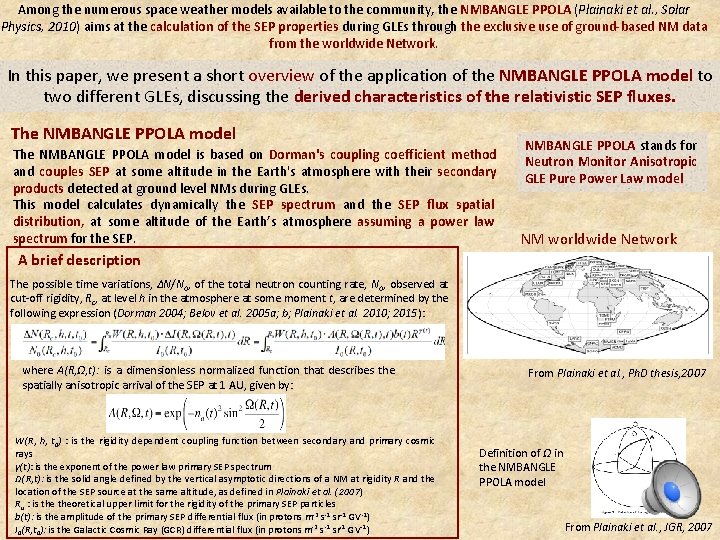
Among the numerous space weather models available to the community, the NMBANGLE PPOLA (Plainaki et al. , Solar Physics, 2010) aims at the calculation of the SEP properties during GLEs through the exclusive use of ground-based NM data from the worldwide Network. In this paper, we present a short overview of the application of the NMBANGLE PPOLA model to two different GLEs, discussing the derived characteristics of the relativistic SEP fluxes. The NMBANGLE PPOLA model is based on Dorman's coupling coefficient method and couples SEP at some altitude in the Earth's atmosphere with their secondary products detected at ground level NMs during GLEs. This model calculates dynamically the SEP spectrum and the SEP flux spatial distribution, at some altitude of the Earth’s atmosphere assuming a power law spectrum for the SEP. NMBANGLE PPOLA stands for Neutron Monitor Anisotropic GLE Pure Power Law model NM worldwide Network A brief description The possible time variations, ΔN/N 0, of the total neutron counting rate, N 0, observed at cut-off rigidity, Rc, at level h in the atmosphere at some moment t, are determined by the following expression (Dorman 2004; Belov et al. 2005 a; b; Plainaki et al. 2010; 2015): where A(R, Ω, t): is a dimensionless normalized function that describes the spatially anisotropic arrival of the SEP at 1 AU, given by: W(R, h, t 0) : is the rigidity dependent coupling function between secondary and primary cosmic rays γ(t): is the exponent of the power law primary SEP spectrum Ω(R, t): is the solid angle defined by the vertical asymptotic directions of a NM at rigidity R and the location of the SEP source at the same altitude, as defined in Plainaki et al. (2007) Ru : is theoretical upper limit for the rigidity of the primary SEP particles b(t): is the amplitude of the primary SEP differential flux (in protons m-2 s-1 sr-1 GV-1) I 0(R, t 0): is the Galactic Cosmic Ray (GCR) differential flux (in protons m-2 s-1 sr-1 GV-1) From Plainaki et al. , Ph. D thesis, 2007 Definition of Ω in the NMBANGLE PPOLA model From Plainaki et al. , JGR, 2007
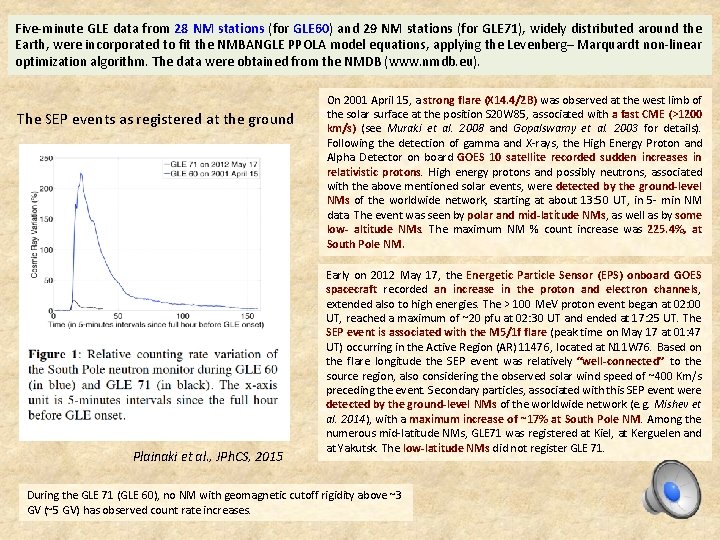
Five-minute GLE data from 28 NM stations (for GLE 60) and 29 NM stations (for GLE 71), widely distributed around the Earth, were incorporated to fit the NMBANGLE PPOLA model equations, applying the Levenberg– Marquardt non-linear optimization algorithm. The data were obtained from the NMDB (www. nmdb. eu). The SEP events as registered at the ground Plainaki et al. , JPh. CS, 2015 On 2001 April 15, a strong flare (X 14. 4/2 B) was observed at the west limb of the solar surface at the position S 20 W 85, associated with a fast CME (>1200 km/s) (see Muraki et al. 2008 and Gopalswamy et al. 2003 for details). Following the detection of gamma and X-rays, the High Energy Proton and Alpha Detector on board GOES 10 satellite recorded sudden increases in relativistic protons. High energy protons and possibly neutrons, associated with the above mentioned solar events, were detected by the ground-level NMs of the worldwide network, starting at about 13: 50 UT, in 5 - min NM data. The event was seen by polar and mid-latitude NMs, as well as by some low- altitude NMs. The maximum NM % count increase was 225. 4%, at South Pole NM. Early on 2012 May 17, the Energetic Particle Sensor (EPS) onboard GOES spacecraft recorded an increase in the proton and electron channels, extended also to high energies. The > 100 Me. V proton event began at 02: 00 UT, reached a maximum of ~20 pfu at 02: 30 UT and ended at 17: 25 UT. The SEP event is associated with the M 5/1 f flare (peak time on May 17 at 01: 47 UT) occurring in the Active Region (AR) 11476, located at N 11 W 76. Based on the flare longitude the SEP event was relatively “well-connected” to the source region, also considering the observed solar wind speed of ~400 Km/s preceding the event. Secondary particles, associated with this SEP event were detected by the ground-level NMs of the worldwide network (e. g. Mishev et al. 2014), with a maximum increase of ~17% at South Pole NM. Among the numerous mid-latitude NMs, GLE 71 was registered at Kiel, at Kerguelen and at Yakutsk. The low-latitude NMs did not register GLE 71. During the GLE 71 (GLE 60), no NM with geomagnetic cutoff rigidity above ~3 GV (~5 GV) has observed count rate increases.
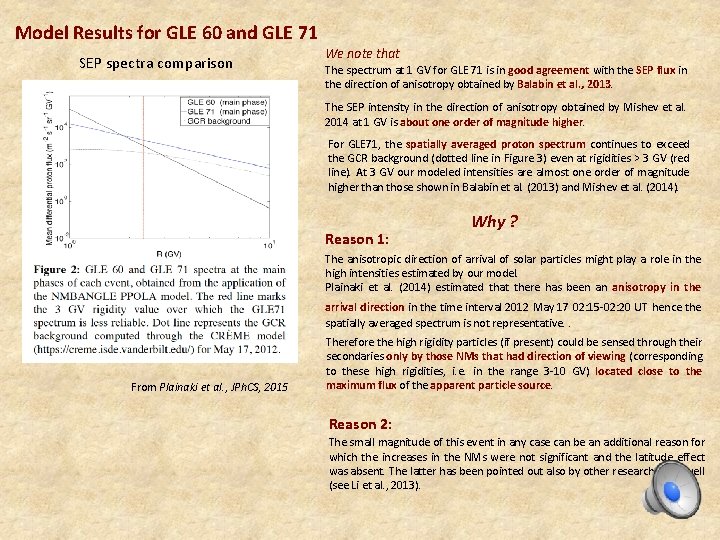
Model Results for GLE 60 and GLE 71 SEP spectra comparison We note that The spectrum at 1 GV for GLE 71 is in good agreement with the SEP flux in the direction of anisotropy obtained by Balabin et al. , 2013. The SEP intensity in the direction of anisotropy obtained by Mishev et al. 2014 at 1 GV is about one order of magnitude higher. For GLE 71, the spatially averaged proton spectrum continues to exceed the GCR background (dotted line in Figure 3) even at rigidities > 3 GV (red line). At 3 GV our modeled intensities are almost one order of magnitude higher than those shown in Balabin et al. (2013) and Mishev et al. (2014). Reason 1: Why ? The anisotropic direction of arrival of solar particles might play a role in the high intensities estimated by our model. Plainaki et al. (2014) estimated that there has been an anisotropy in the arrival direction in the time interval 2012 May 17 02: 15 -02: 20 UT hence the spatially averaged spectrum is not representative. . From Plainaki et al. , JPh. CS, 2015 Therefore the high rigidity particles (if present) could be sensed through their secondaries only by those NMs that had direction of viewing (corresponding to these high rigidities, i. e. in the range 3 -10 GV) located close to the maximum flux of the apparent particle source. Reason 2: The small magnitude of this event in any case can be an additional reason for which the increases in the NMs were not significant and the latitude effect was absent. The latter has been pointed out also by other researchers as well (see Li et al. , 2013).
Conclusions Model Results for GLE 60 and GLE 71 SEP spectra comparison • A hard rigidity spectrum of accelerated protons was found during the initial phase of GLE 60 and a rather soft spectrum in later phases, i. e. after 14: 00 The UTNMBANGLE (γ ~ -5. 5). PPOLA model application gives a harder spatially averaged spectrum for GLE 71 than for GLE 60: in the rigidity range from 2 to ~ 4 GV the • During the main phase of GLE 71, the rigiditymean spectrum index γ was estimated to be ~ -2. 1; in later differential flux of the primary SEPs during GLE 71 is higher than its values phases, i. e. after 02: 20 UT, a softer spectrumduring of accelerated (γof~magnitude. -3. 8) has been derived. The GLE 60, by up protons to one order corresponding values for the energy spectrum are -1. 55 and -2. 4, respectively. This result seems to contradict the fact that during GLE 60, SEPs with higher • The results for GLE 71 are consistent with themaximum typicalenergy rangethan found Ellison (1985) for those by during GLE 71 and have Ramaty been observed. shock wave acceleration in case of relativistic SEP events (see also Mewaldt et al. , 2012), although a Explanation direct flare contribution cannot be excluded (see also Plainaki. Possible et al. , 2014). • The model-results can provide realistic estimation of comparison the SEP fluxes in the energy range where NM of each The above of the two SEP spectra refers to the main phase event, i. e. after the registration of the maximum NM intensity variation, and not increases are registered. to the main SEP acceleration phase that had taken place during the first 5 -min • For both GLEs, the model seems to overestimate the spatially averaged SEP spectrum in the high rigidity intervals after the flare in each case. The high rigidity SEPs during GLE 60 were range, where no NM increases are registered Comparison of thethisresults obtained the two events is mainly during initial phase (see forfor example Plainaki et al. , 2014). a relatively soft SEP spectrum in the main phase of GLE 60 is more trustful mainly in the rigidity range 1 -3 Therefore GV. reasonable. • The spectrum computed in the event main phase results to be harder for GLE 71. This could be due to Moreover, although GLEdirection 60 shows intensity variations in the different SEP flux spatial distribution with respect to thethe. NM of viewing and theground different observations significantly higher than during GLE 71, the spatial distribution of GCR background level (that is reduced duringthe. GLE 60) primary flux is more anisotropic, consistently with NM observations. As a • The integral SEPFrom fluxes calculated by the NMBANGLE PPOLA model areflux in good agreement with GOES consequence, the peak secondary (at the ground) can be measured mainly at Plainaki et al. , JPh. CS, 2015 specific locations that are magnetically favorable with respect to the SEP source observations if extrapolated to the lower energy range. (Plainaki et al. , 2015). Therefore, the spatially averaged modeled-SEP spectrum is less Acknowledgements representative of the actual GLE 60 event evolution, since the averaged SEP fluxes smoothen the data actualused fluxin variations in and rigidity. The authors acknowledge all colleagues at the NM stations who kindly providedtoo usmuch with the this study the Referees of both our related papers for their useful comments. Thanks are also due to the High-resolution Neutron Monitor NMDB database, founded under the European Union’s FP 7 Program (contract No. 213007) for providing cosmic ray data. Special acknowledgements to Dr. Marisa Storini for important discussions and contribution to the related published works and to Dr. Kanellakopoulos for his contribution to the data analysis.