Uncertainties in implementation of common metrics Jolene Cook
- Slides: 16
Uncertainties in implementation of common metrics Jolene Cook, 3 April 2012, Bonn With thanks to: Chris Huntingford (CEH), Laila Gohar (Met Office Hadley Centre), Nick Howarth (Oxford Univ. ), Myles Allen (Oxford Univ. ), Alex Lorenz (Oxford Univ. ), Keith Shine (Reading Univ. ), Bill Collins (Met Office Hadley Centre), Jason Lowe (Met Office Hadley Centre), David Lee (Tau Scientific)
Uncertainties in current knowledge and use of metrics • Physical - • Structural - • e. g. impact of different lifetimes, choice of time horizon, relationship with end impact Economic - • e. g. climate sensitivity, radiative impact e. g. choice of discount rate, potential for perverse incentives Political - e. g. winners and losers, ease of communication, stability UNCERTAINTIES IN IMPLEMENTATION OF METRICS 3 APRIL 2012
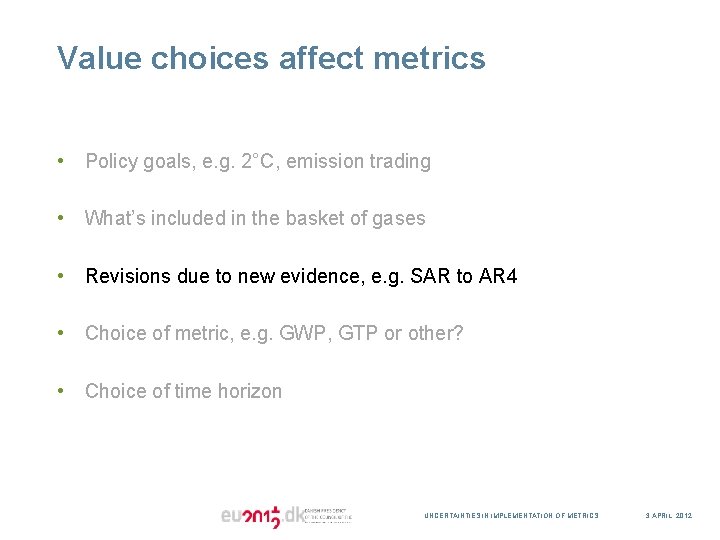
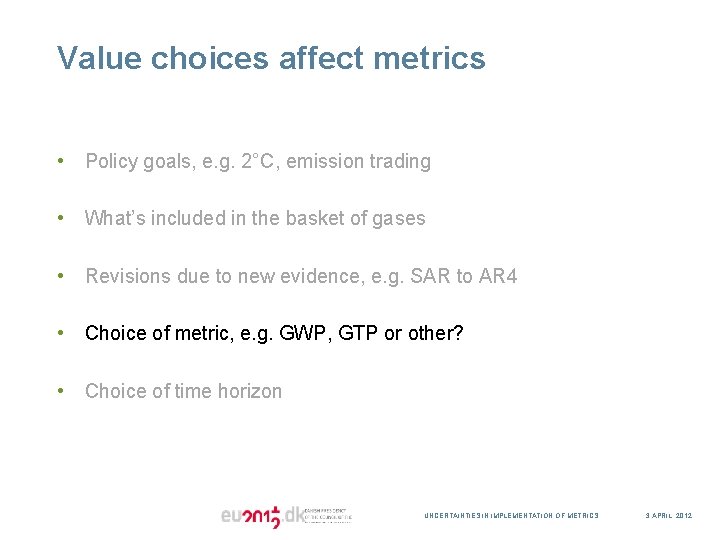
Value choices affect metrics • Policy goals, e. g. 2°C, emission trading, reporting and monitoring • What’s included in the basket of gases • Revisions due to new evidence, e. g. SAR to AR 4. • Choice of metric, e. g. GWP, GTP or other? • Choice of time horizon UNCERTAINTIES IN IMPLEMENTATION OF METRICS 3 APRIL 2012
Value choices affect metrics • Policy goals, e. g. 2°C, emission trading • What’s included in the basket of gases • Revisions due to new evidence, e. g. SAR to AR 4 • Choice of metric, e. g. GWP, GTP or other? • Choice of time horizon UNCERTAINTIES IN IMPLEMENTATION OF METRICS 3 APRIL 2012
Value choices affect metrics • Policy goals, e. g. 2°C, emission trading • What’s included in the basket of gases • Revisions due to new evidence, e. g. SAR to AR 4 • Choice of metric, e. g. GWP, GTP or other? • Choice of time horizon UNCERTAINTIES IN IMPLEMENTATION OF METRICS 3 APRIL 2012
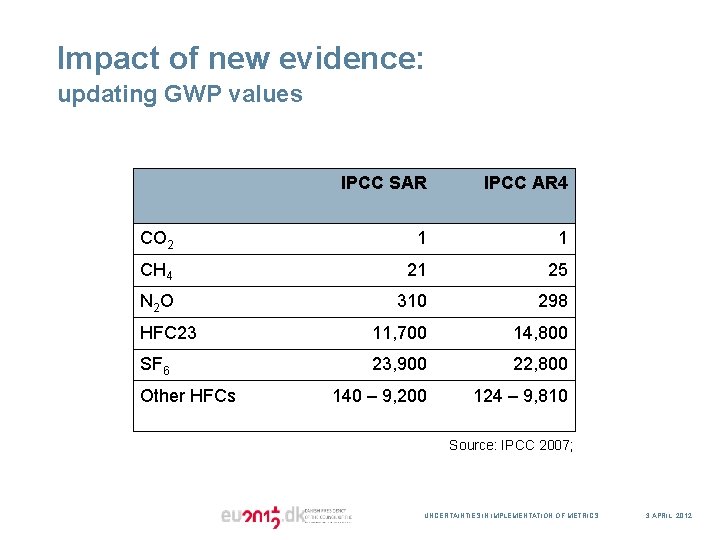
Impact of new evidence: updating GWP values IPCC SAR IPCC AR 4 CO 2 1 1 CH 4 21 25 N 2 O 310 298 HFC 23 11, 700 14, 800 SF 6 23, 900 22, 800 140 – 9, 200 124 – 9, 810 Other HFCs Source: IPCC 2007; UNCERTAINTIES IN IMPLEMENTATION OF METRICS 3 APRIL 2012
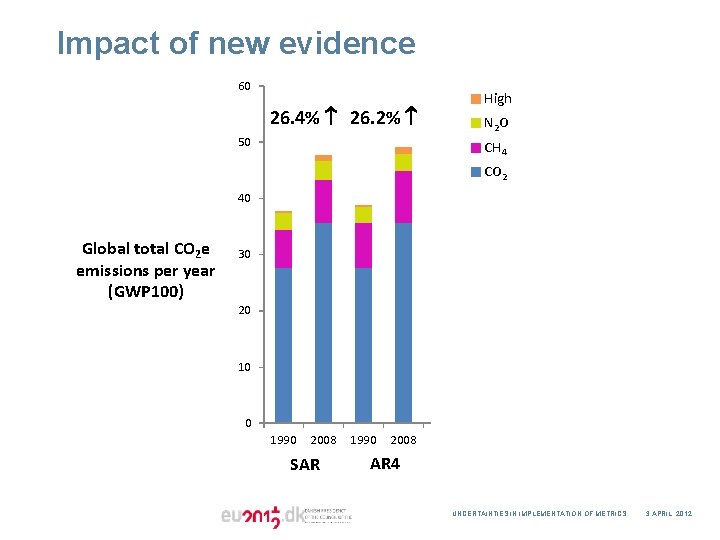
Impact of new evidence 60 26. 4% 26. 2% 50 High N 2 O CH 4 CO 2 40 Global total CO 2 e emissions per year (GWP 100) 30 20 10 0 1990 2008 SAR 1990 2008 AR 4 UNCERTAINTIES IN IMPLEMENTATION OF METRICS 3 APRIL 2012
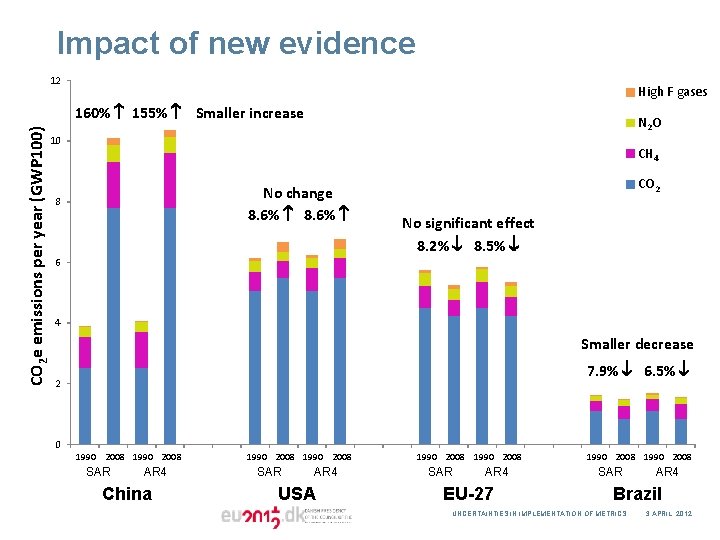
Impact of new evidence 12 High F gases CO 2 e emissions per year (GWP 100) 160% 155% Smaller increase N 2 O 10 CH 4 No change 8. 6% 8 6 CO 2 No significant effect 8. 2% 8. 5% 4 Smaller decrease 7. 9% 6. 5% 2 0 1990 2008 SAR AR 4 China 1990 2008 SAR AR 4 USA 1990 2008 SAR AR 4 EU-27 1990 2008 SAR AR 4 Brazil UNCERTAINTIES IN IMPLEMENTATION OF METRICS 3 APRIL 2012
Value choices affect metrics • Policy goals, e. g. 2°C, emission trading • What’s included in the basket of gases • Revisions due to new evidence, e. g. SAR to AR 4 • Choice of metric, e. g. GWP, GTP or other? • Choice of time horizon UNCERTAINTIES IN IMPLEMENTATION OF METRICS 3 APRIL 2012
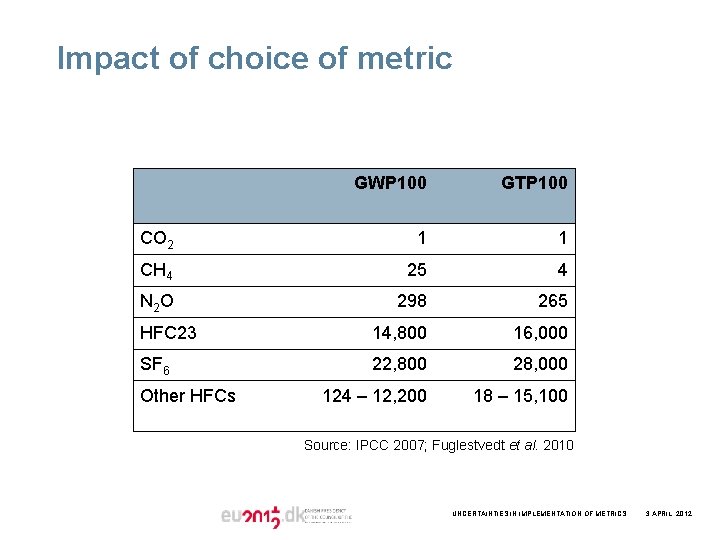
Impact of choice of metric GWP 100 GTP 100 CO 2 1 1 CH 4 25 4 N 2 O 298 265 HFC 23 14, 800 16, 000 SF 6 22, 800 28, 000 124 – 12, 200 18 – 15, 100 Other HFCs Source: IPCC 2007; Fuglestvedt et al. 2010 UNCERTAINTIES IN IMPLEMENTATION OF METRICS 3 APRIL 2012
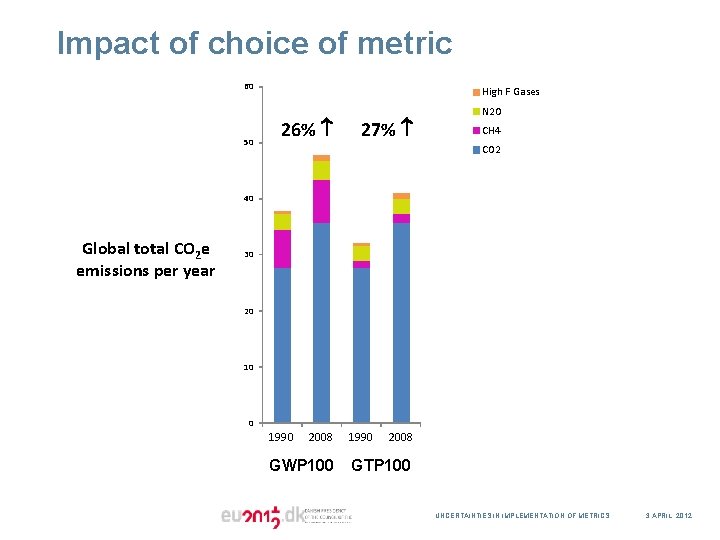
Impact of choice of metric 60 50 High F Gases 26% 27% N 2 O CH 4 CO 2 40 Global total CO 2 e emissions per year 30 20 10 0 1990 2008 GWP 100 1990 2008 GTP 100 UNCERTAINTIES IN IMPLEMENTATION OF METRICS 3 APRIL 2012
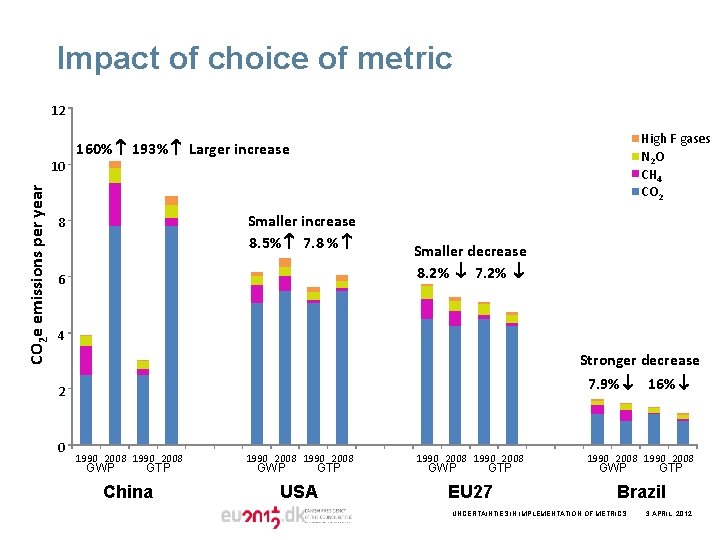
Impact of choice of metric 12 CO 2 e emissions per year 10 High F gases N 2 O CH 4 CO 2 160% 193% Larger increase Smaller increase 8. 5% 7. 8 % 8 6 Smaller decrease 8. 2% 7. 2% 4 Stronger decrease 7. 9% 16% 2 0 1990 2008 1990 2008 China USA EU 27 Brazil GWP GTP GWP UNCERTAINTIES IN IMPLEMENTATION OF METRICS GTP 3 APRIL 2012
Value choices affect metrics • Policy goals, e. g. 2°C, emission trading • What’s included in the basket of gases • Revisions due to new evidence, e. g. SAR to AR 4 • Choice of metric, e. g. GWP, GTP or other? • Choice of time horizon UNCERTAINTIES IN IMPLEMENTATION OF METRICS 3 APRIL 2012
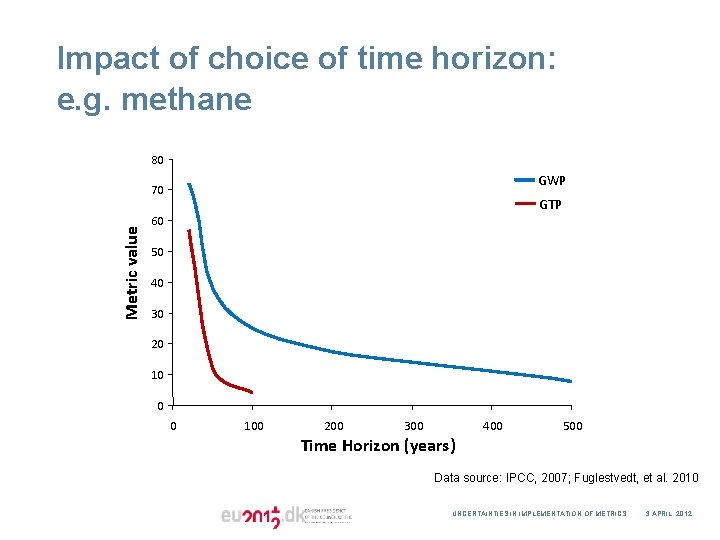
Impact of choice of time horizon: e. g. methane 80 GWP Metric value 70 GTP 60 50 40 30 20 10 0 0 100 200 300 400 500 Time Horizon (years) Data source: IPCC, 2007; Fuglestvedt, et al. 2010 UNCERTAINTIES IN IMPLEMENTATION OF METRICS 3 APRIL 2012
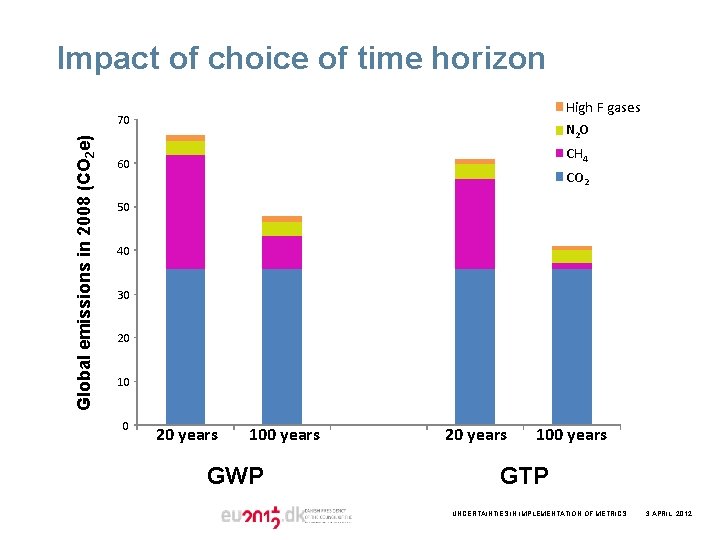
Impact of choice of time horizon High F gases Global emissions in 2008 (CO 2 e) 70 N 2 O CH 4 60 CO 2 50 40 30 20 10 0 20 years 100 years GWP 20 years 100 years GTP UNCERTAINTIES IN IMPLEMENTATION OF METRICS 3 APRIL 2012
Conclusions • Both GWP and GTP require value choices. • Large sensitivity to choice of time horizon. • Important to consult IPCC Fifth Assessment Report related to status of scientific findings related to metrics • Next step: consider economic implications. • Any value in changing metric when impact on other areas unknown? UNCERTAINTIES IN IMPLEMENTATION OF METRICS 3 APRIL 2012