TULLAHOMA UTILITIES AUTHORITY RETAIL RATE REVIEW Our approach

- Slides: 26
TULLAHOMA UTILITIES AUTHORITY RETAIL RATE REVIEW Our approach to residential and commercial rate realignment
Historical Rate Thinking • The original Electric Light Board – Street lighting – Flat fee • Power and Light companies – Metered usage – Customer charge & k. Wh
More History • What about big loads? • What if the big loads don’t use much k. Wh? – Capacity charges and Demand Charges – Load factor charges – Facilities Charges
Along those lines… • What if large loads use power seasonally or infrequently? – Demand ratchets – Minimum bill calculations – Rate floors/rate penalties – Seasonal load factor charges
And there’s more… • What if the type of load was heavily motor load and required energizing current (aka bigger wire, transformers, etc). – Reactive meters – Power Factor adjustments
Limited Metering capabilities • Westinghouse brought us the k. Wh meter in 1894 • Relatively unchanged for 100 years except for introduction of: – Demand metering ($$) – Reactive k. Wh metering ($$$) – Limited recording on tape ($$$$)
TVA End use rates • For residential, prescribed kwh metering and a customer charge • For commercial/industrial, outlined a three tier rate, GSA-1, GSA-2, GSA-3 • Why have a three part rate? – Cost of metering – Difficultly allocating fixed generation
GSA rate review • GSA-1 under 50 k. W, 15, 000 k. W – No demand meter (saves costs) – Low customer charge, high k. Wh • GSA-2 over 50 k. W or 15, 000 kw – Higher customer charge – Demand component • GSA-3 over 1000 k. W – High customer charge, low k. Wh cost
What’s wrong with this rate? • Doesn’t really correlate fixed asset costs to those who require it – Transmission – Distribution • Doesn’t really correlate cost of energy generation with usage. – Wholesale costs of purchased power on peak vs excess capacity
TVAs response: TOU • Time of use rates allow TVA to better align energy costs with energy usage. • But what about fixed asset recovery? • TVA is still attempting to recover fixed costs with a volumetric component.
TUA Response: Change. • TVA wholesale rate from end-use to Time-of-use energy, and we speculated future structure adjustments • TUA typically peaks concurrently with TVA, so our variable costs align with same time periods • Technology has developed that allowed us to capture interval data for every customer.
First response: TOU • TUA was the first to implement mandatory TOU across all customer segments • We implemented an AMI system that would automatically pool usage into on-peak, off-peak, and transition. • This required major programming
Retail TOU Implementation Plan • Public meetings – AMI rollout and TOU discussion were combined • RFP for AMI infrastructure – Several venders responded – Required 15 minute interval data – Future ability for load control (2 -way) – Need for water readings
Implementation Challenges – Few customer complaints – Cycle billing vs calendar month with respect to seasons – Residential – 5 cent summer differential, 3 cent winter differential – TVA rate spread may be insufficient to influence customer behavior. – Declining block in GSA-2
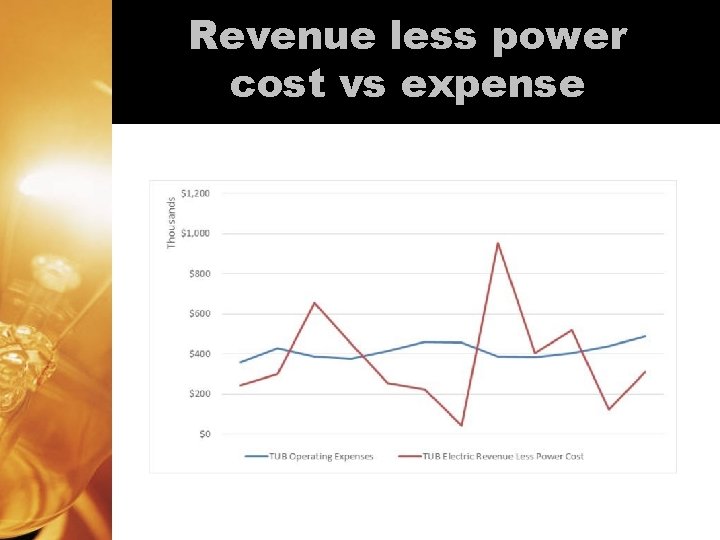
Is that enough? • We anticipated TVA rates changing again • We had customers that had large transformers that had shut down • We had a concern that we could no longer rely on guideline increases (partly because we are on-peak)
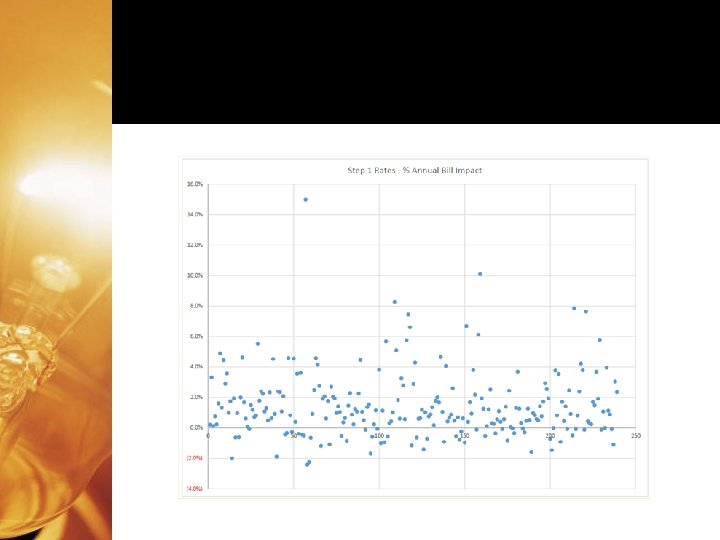
Revenue less power cost vs expense
Decoupling the phone bill • Remember long distance deregulation? • TUA wanted a way to evaluate its real distribution costs and couple that to a rate that is fair and recovers our cost equitably. • TVA rates (whatever form they were in) could then be added to bottom.
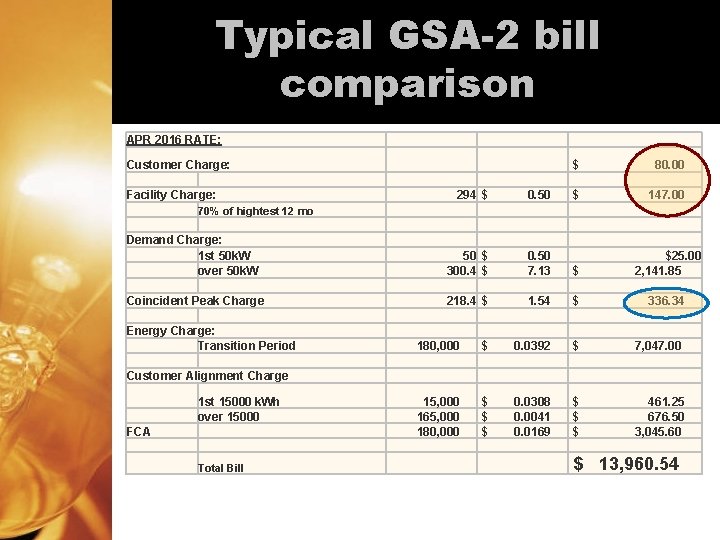
GSA-2 Rate Realignment – Continuing effort to move to a more appropriate correlation between wholesale and retail. – Split demand into two charges: • A facility charge with a 12 month ratchet • A coincident peak demand (TUB peak) – Added a customer realignment charge that phases out to avoid rate shock to low load factor customers.
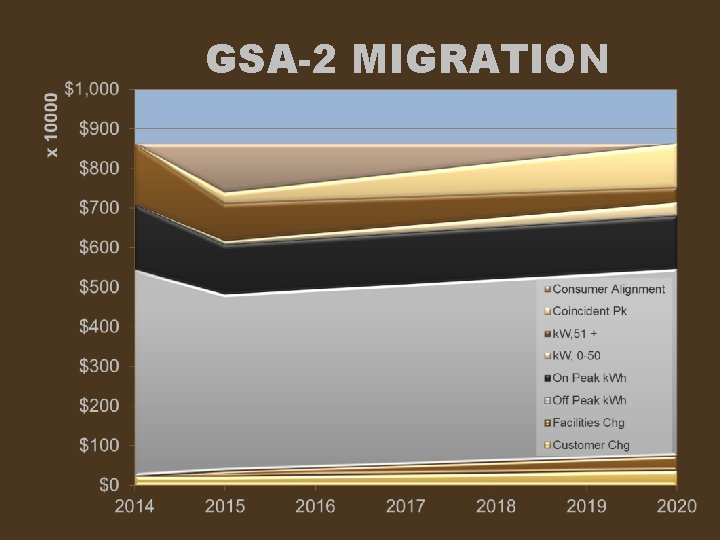
GSA-2 MIGRATION
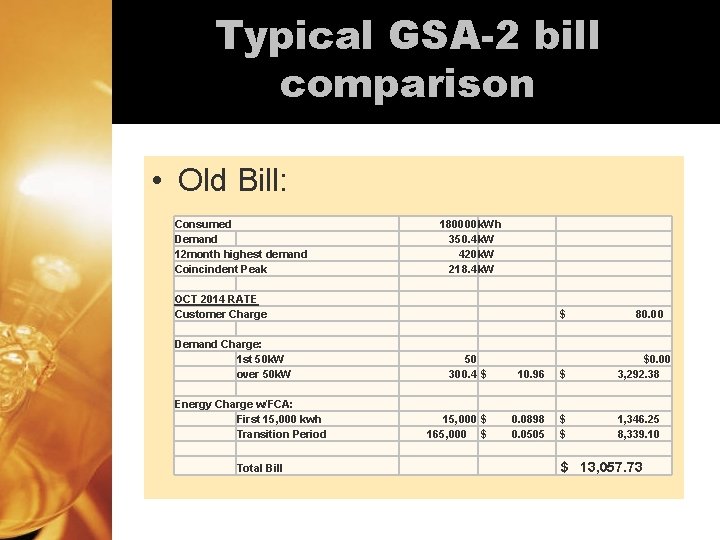
Typical GSA-2 bill comparison • Old Bill: Consumed Demand 12 month highest demand Coincindent Peak 180000 k. Wh 350. 4 k. W 420 k. W 218. 4 k. W OCT 2014 RATE Customer Charge Demand Charge: 1 st 50 k. W over 50 k. W Energy Charge w/FCA: First 15, 000 kwh Transition Period Total Bill $ 80. 00 50 300. 4 $ 10. 96 $ $0. 00 3, 292. 38 15, 000 $ 165, 000 $ 0. 0898 0. 0505 $ $ 1, 346. 25 8, 339. 10 $ 13, 057. 73
Typical GSA-2 bill comparison APR 2016 RATE: Customer Charge: Facility Charge: $ 80. 00 $ 147. 00 294 $ 0. 50 Demand Charge: 1 st 50 k. W over 50 k. W 50 $ 300. 4 $ 0. 50 7. 13 $ $25. 00 2, 141. 85 Coincident Peak Charge 218. 4 $ 1. 54 $ 336. 34 70% of hightest 12 mo Energy Charge: Transition Period 180, 000 $ 0. 0392 $ 7, 047. 00 15, 000 165, 000 180, 000 $ $ $ 0. 0308 0. 0041 0. 0169 $ $ $ 461. 25 676. 50 3, 045. 60 Customer Alignment Charge 1 st 15000 k. Wh over 15000 FCA Total Bill $ 13, 960. 54
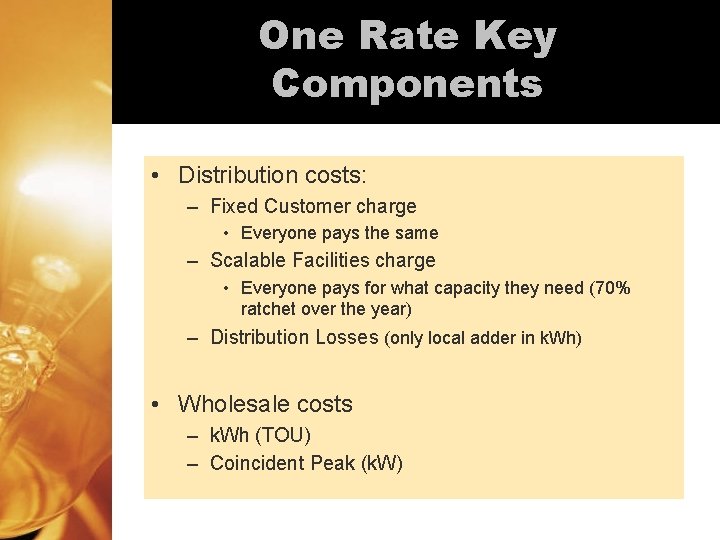
One Rate Key Components • Distribution costs: – Fixed Customer charge • Everyone pays the same – Scalable Facilities charge • Everyone pays for what capacity they need (70% ratchet over the year) – Distribution Losses (only local adder in k. Wh) • Wholesale costs – k. Wh (TOU) – Coincident Peak (k. W)
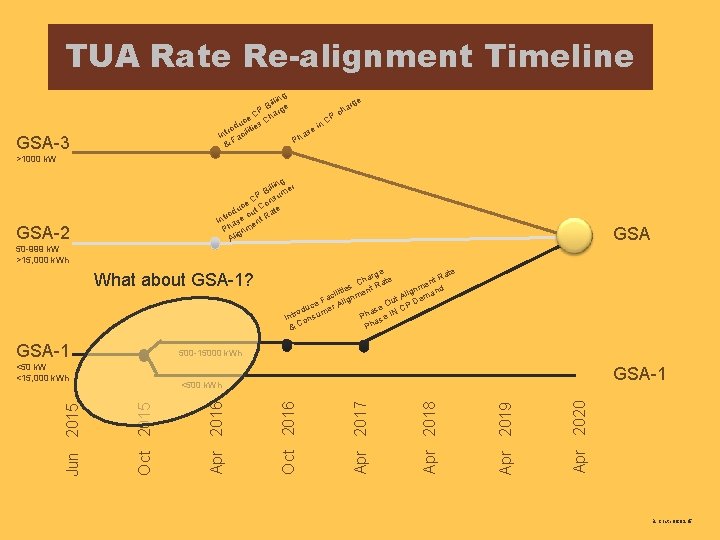
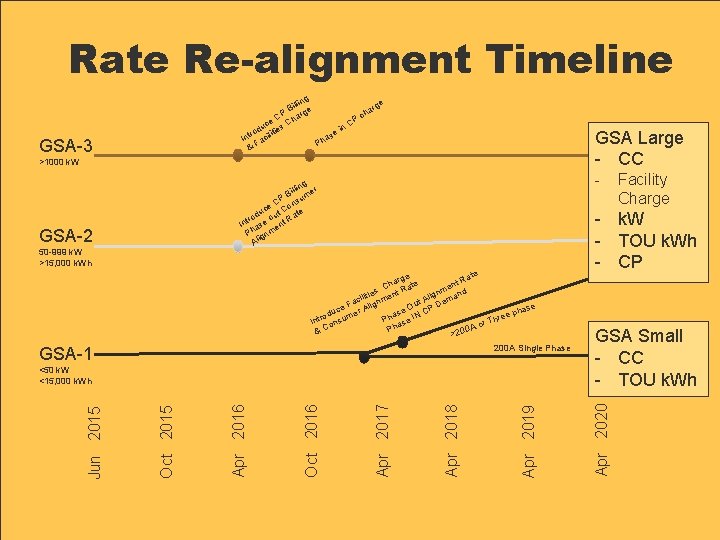
TUA Rate Re-alignment Timeline g e lin Bil ge arg h P r c P e C ha uc ies C n. C d o ilit ei r t s a In ac F Ph & GSA-3 >1000 k. W g lin r Bil ume P s e C on uc ut C ate d o ro R Int ase ent h m P gn Ali GSA-2 50 -999 k. W >15, 000 k. Wh What about GSA-1? GSA-1 ge ate t. R har ate n C e s m t. R d litie en lign man A aci lignm t e F u D e O A c r CP ase odu me Ph se IN Intr onsu a Ph &C 500 -15000 k. Wh <50 k. W <15, 000 k. Wh GSA-1 Apr 2020 Apr 2019 Apr 2018 Apr 2017 Oct 2016 Apr 2016 <500 k. Wh Oct 2015 Jun 2015 GSA B. Coate 06. 02. 15
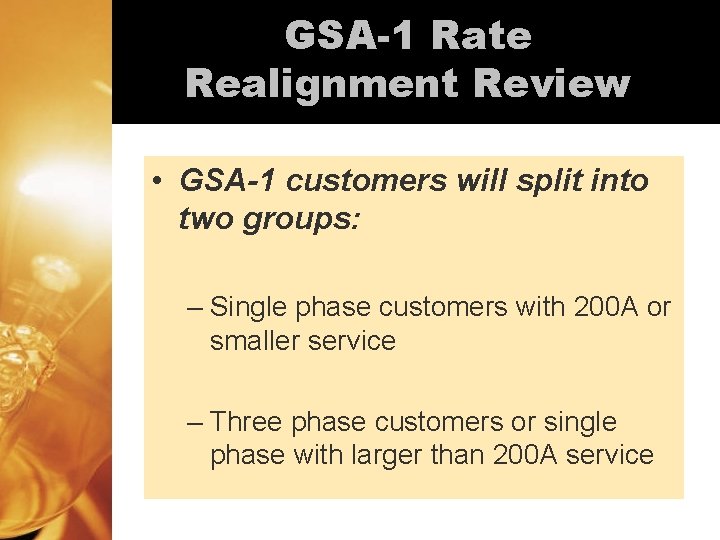
GSA-1 Rate Realignment Review • GSA-1 customers will split into two groups: – Single phase customers with 200 A or smaller service – Three phase customers or single phase with larger than 200 A service
Rate Re-alignment Timeline g e lin Bil ge arg h P r c a P e. C h uc ies C n. C i d o t e r li as Int Faci Ph & GSA Large - CC >1000 k. W - g lin r Bil ume CP ns ce t Co te u rod ou Ra Int ase ent Ph gnm Ali GSA-2 50 -999 k. W >15, 000 k. Wh te ge Ra har ate nt C e m s d t. R lign an litie en t A Dem aci lignm u F O P ase ce r A ase IN C e ph odu sume e h r r t h P e In on r. T as 0 A o Ph &C >20 200 A Single Phase GSA-1 Apr 2019 Apr 2018 Apr 2017 Oct 2016 Apr 2016 Oct 2015 Jun 2015 <50 k. W <15, 000 k. Wh Facility Charge - k. W - TOU k. Wh - CP GSA Small - CC - TOU k. Wh Apr 2020 GSA-3 B. Coate 06. 02. 15