Towards perfect water line intensities Lorenzo Lodi University


 and")


.")

- Slides: 16
Towards perfect water line intensities Lorenzo Lodi University College London, Dept of physics & Astronomy, London, UK
Talk summary • Theoretical methods. • Line positions. • Line intensities and their uncertainties. • Comparison of H 218 O and H 217 O linelists with HITRAN.
General scheme of solution • Born-Oppenheimer approximation. • Obtain potential energy surface (PES) and dipole moment surface (DMS). • Use PES for the motion of the nuclei. • From DMS and nuclear-motion wavefunctions calculate line intensities. L. Lodi and J. Tennyson, J. Phys. B: At. Mol. Opt. Phys. 43, 133001 (2010)
Energy levels from experiment • Fully labelled lines → energy levels by standard analyses. • Different experimental sources → different uncertainties, systematic errors, mislabelling / inconsistent labelling. • MARVEL program developed to deal with these issues [T. Furtenbacher, A. G. Csaszar, J. Tennyson, J Mol Spectr 245, 115 (2007)]. • MARVEL takes in (labelled) line positions and uncertainties and gives out energy levels and uncertainty bars.
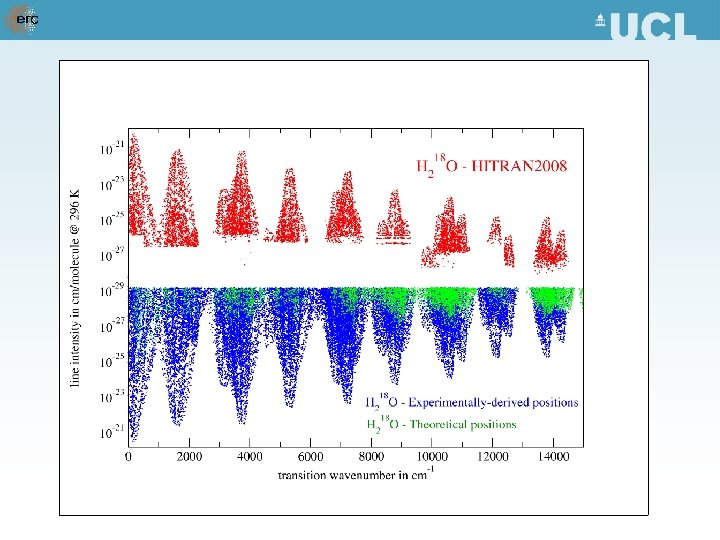
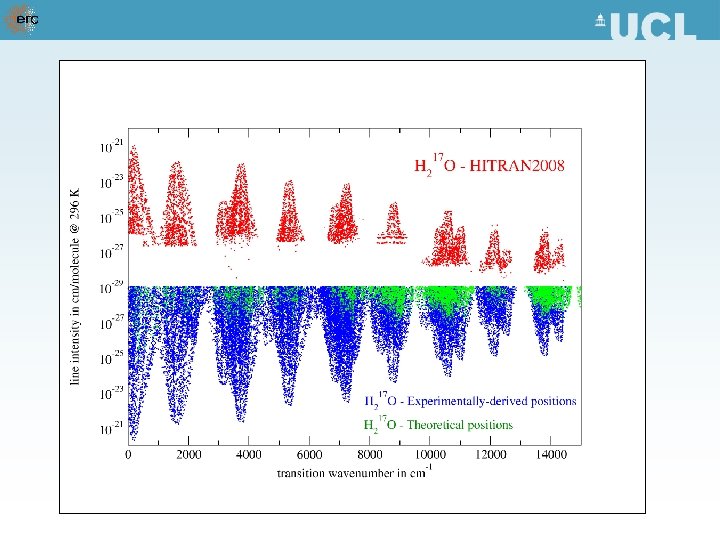
Energy levels from experiment • Using MARVEL a IUPAC-sponsored task group analysed all experimental data for H 218 O and H 217 O [J Tennyson et al, JQRST 110, 573 (2009)]. • Led respectively to 4839 and 2687 energy levels (and uncertainty bars). • Many more energy levels remain unknown (~26000 energy levels with energy up to 19000 cm-1 and J < 19). • Calculations necessary to supplement experimentally-derived data.
Energy levels from theory • PES by Shirin et al [S. V. Shirin et al, J Chem Phys 128, 224306 (2008)] to compute energy levels. • Comparing with experimentally-derived energy levels gives estimate of error, which is ~0. 1 cm-1.
Line position - summary • Line positions from experimentally-derived energy levels, if possible. • Theoretical line positions otherwise. • Appropriate uncertainty bars in all cases.
Line intensities • Absolute line intensities difficult to measure with accuracies < 5%. • The LTP 2011 ab initio DMS [L Lodi, J Tennyson and OL Polyansky, J. Chem. Phys 135, 034113 (2011)] provides 1% accurate line intensities for most lines. • Such 1% accuracy claim is supported, among others, by: 1. Recent Stark coefficient measurements [OL Polyansky et al, Phil Trans Royal Soc London A, 370, 2728 (2012)]. 2. Very accurate line intensities by [D Lisak, DK Harvey and JT Hodges, Phys Rev A, 79, 052707 (2009)].
Comparison with Lisak, Harvey and Hodges
Line intensities: resonances • Resonant transitions very sensitive to PES used. • For ~10% line intensities not accurate. • Strategy to identify such lines suggested in [L Lodi and J Tennyson, JQSRT 113, 850 (2012)].
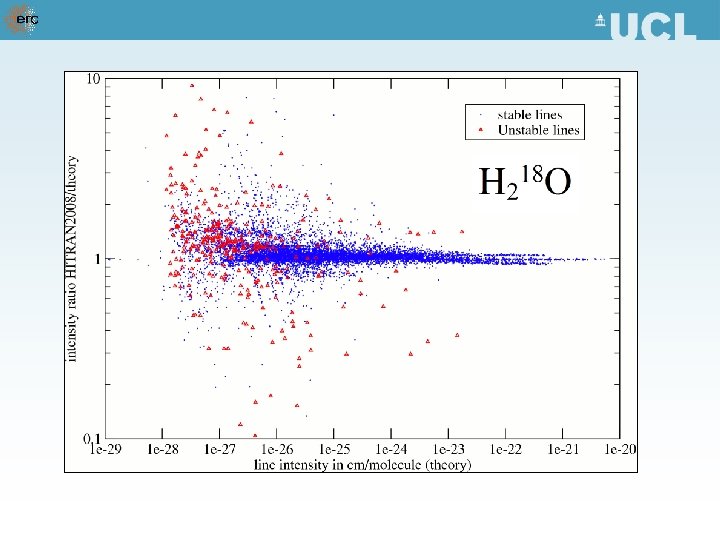
Line intensity error bars • Compute two sets of wave function using PES by Shirin et al and using ab initio PES by Barletta et al [P Barletta et al, J Chem Phys 125, 204307 (2006)]. • Use two high-quality DMS (LTP 2011 and LTP 2011 S) to get four sets of line intensities. • The scatter of line intensities gives an estimation of the error.
Line intensity statistics • ~45% of lines have scatter less than 1% (stable lines). • ~3% of lines have scatter greater than a factor of 2 (unstable lines). • All sensitive lines are very weak.
Conclusions and future work • Linelists complete down to 10 -29 cm/molecule for H 218 O and H 217 O. • Most line positions with errors of ~0. 002 cm-1. • Most line intensities have accuracies of 1 -2%. • Quantities have sensible error bars. • Corresponding linelist for H 216 O almost done. • Preliminary results with experimental line intensities by Geoffrey Toon from JPL are very encouraging.