The Regression Patterns of Pediatric Optic Pathway Glioma
- Slides: 1
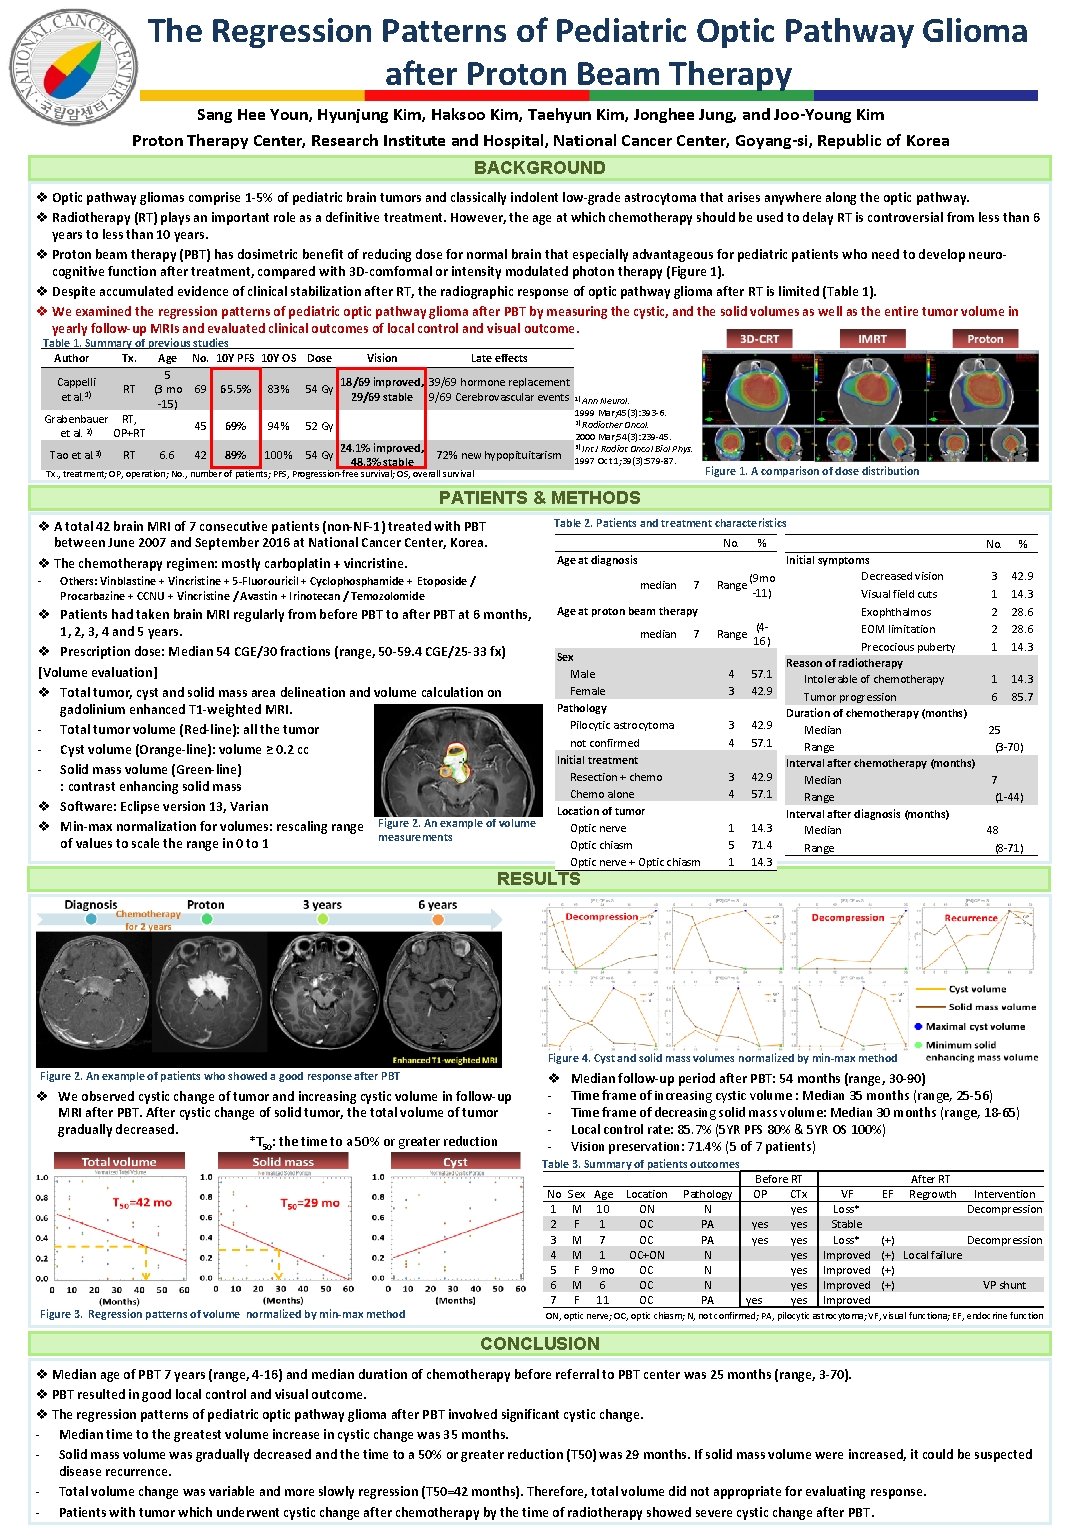
The Regression Patterns of Pediatric Optic Pathway Glioma after Proton Beam Therapy Sang Hee Youn, Hyunjung Kim, Haksoo Kim, Taehyun Kim, Jonghee Jung, and Joo-Young Kim Proton Therapy Center, Research Institute and Hospital, National Cancer Center, Goyang-si, Republic of Korea BACKGROUND v Optic pathway gliomas comprise 1 -5% of pediatric brain tumors and classically indolent low-grade astrocytoma that arises anywhere along the optic pathway. v Radiotherapy (RT) plays an important role as a definitive treatment. However, the age at which chemotherapy should be used to delay RT is controversial from less than 6 years to less than 10 years. v Proton beam therapy (PBT) has dosimetric benefit of reducing dose for normal brain that especially advantageous for pediatric patients who need to develop neurocognitive function after treatment, compared with 3 D-comformal or intensity modulated photon therapy (Figure 1). v Despite accumulated evidence of clinical stabilization after RT, the radiographic response of optic pathway glioma after RT is limited (Table 1). v We examined the regression patterns of pediatric optic pathway glioma after PBT by measuring the cystic, and the solid volumes as well as the entire tumor volume in yearly follow-up MRIs and evaluated clinical outcomes of local control and visual outcome. Table 1. Summary of previous studies Author Tx. Age No. 10 Y PFS 10 Y OS Dose Vision Late effects 5 Cappelli 18/69 improved, 39/69 hormone replacement RT (3 mo 69 65. 5% 83% 54 Gy 1) et al. 29/69 stable 9/69 Cerebrovascular events 1) Ann Neurol. -15) 1999 Mar; 45(3): 393 -6. Grabenbauer RT, 2) Radiother Oncol. 45 69% 94% 52 Gy et al. 2) OP+RT 2000 Mar; 54(3): 239 -45. 3) Int J Radiat Oncol Biol Phys. 24. 1% improved, Tao et al. 3) RT 6. 6 42 89% 100% 54 Gy 72% new hypopituitarism 1997 Oct 1; 39(3): 579 -87. 48. 3% stable Tx. , treatment; OP, operation; No. , number of patients; PFS, Progression-free survival; OS, overall survival Figure 1. A comparison of dose distribution PATIENTS & METHODS Table 2. Patients and treatment characteristics v A total 42 brain MRI of 7 consecutive patients (non-NF-1) treated with PBT between June 2007 and September 2016 at National Cancer Center, Korea. v The chemotherapy regimen: mostly carboplatin + vincristine. - No. Age at diagnosis Others: Vinblastine + Vincristine + 5 -Fluorouricil + Cyclophosphamide + Etoposide / Procarbazine + CCNU + Vincristine / Avastin + Irinotecan / Temozolomide median v Patients had taken brain MRI regularly from before PBT to after PBT at 6 months, 1, 2, 3, 4 and 5 years. v Prescription dose: Median 54 CGE/30 fractions (range, 50 -59. 4 CGE/25 -33 fx) [Volume evaluation] v Total tumor, cyst and solid mass area delineation and volume calculation on gadolinium enhanced T 1 -weighted MRI. - Total tumor volume (Red-line): all the tumor - Cyst volume (Orange-line): volume ≥ 0. 2 cc - Solid mass volume (Green-line) : contrast enhancing solid mass v Software: Eclipse version 13, Varian v Min-max normalization for volumes: rescaling range Figure 2. An example of volume measurements of values to scale the range in 0 to 1 7 Age at proton beam therapy median 7 Sex Male Female Pathology Pilocytic astrocytoma not confirmed Initial treatment Resection + chemo Chemo alone Location of tumor Optic nerve Optic chiasm Optic nerve + Optic chiasm RESULTS % Initial symptoms Decreased vision (9 mo Range -11) Visual field cuts Exophthalmos (4 EOM limitation Range 16) Precocious puberty Reason of radiotherapy 4 57. 1 Intolerable of chemotherapy 3 42. 9 Tumor progression Duration of chemotherapy (months) 3 42. 9 Median 4 57. 1 Range Interval after diagnosis (months) 1 14. 3 Median 5 71. 4 Range 1 14. 3 No. % 3 1 2 2 1 42. 9 14. 3 28. 6 14. 3 1 6 14. 3 85. 7 25 (3 -70) 7 (1 -44) 48 (8 -71) Figure 4. Cyst and solid mass volumes normalized by min-max method Figure 2. An example of patients who showed a good response after PBT v We observed cystic change of tumor and increasing cystic volume in follow-up MRI after PBT. After cystic change of solid tumor, the total volume of tumor gradually decreased. *T 50: the time to a 50% or greater reduction v - Median follow-up period after PBT: 54 months (range, 30 -90) Time frame of increasing cystic volume : Median 35 months (range, 25 -56) Time frame of decreasing solid mass volume: Median 30 months (range, 18 -65) Local control rate: 85. 7% (5 YR PFS 80% & 5 YR OS 100%) Vision preservation: 71. 4% (5 of 7 patients) Table 3. Summary of patients outcomes Figure 3. Regression patterns of volume normalized by min-max method No 1 2 3 4 5 6 7 Sex Age Location M 10 ON F 1 OC M 7 OC M 1 OC+ON F 9 mo OC M 6 OC F 11 OC Pathology N PA PA N N N PA Before RT OP CTx yes yes yes VF Loss* Stable Loss* Improved EF After RT Regrowth Intervention Decompression (+) Local failure (+) VP shunt ON, optic nerve; OC, optic chiasm; N, not confirmed; PA, pilocytic astrocytoma; VF, visual functiona; EF, endocrine function CONCLUSION v Median age of PBT 7 years (range, 4 -16) and median duration of chemotherapy before referral to PBT center was 25 months (range, 3 -70). v PBT resulted in good local control and visual outcome. v The regression patterns of pediatric optic pathway glioma after PBT involved significant cystic change. - Median time to the greatest volume increase in cystic change was 35 months. - Solid mass volume was gradually decreased and the time to a 50% or greater reduction (T 50) was 29 months. If solid mass volume were increased, it could be suspected disease recurrence. - Total volume change was variable and more slowly regression (T 50=42 months). Therefore, total volume did not appropriate for evaluating response. - Patients with tumor which underwent cystic change after chemotherapy by the time of radiotherapy showed severe cystic change after PBT.