The application of Value Engineering tools to risk


- Slides: 16
The application of “Value Engineering” tools to risk assess the outputs of an NSI Graham Sharp Manager, Continuous Improvement Zone ONS, UK graham. sharp@ons. gsi. gov. uk 0044 1633 456742
Problem & goal statements Problem Statement • No consistent means of assessing the risks of our statistical outputs in a standardised way • Need a strategic approach to be taken to prioritise improvements Goal Statement To develop a risk assessment methodology and deliver a scored risk assessment of ONS statistical outputs by the end of 2012.
Scope & solution requirements In Scope: Evaluate all statistical outputs and the statistical system(s)/tool(s) which are used to produce them • Consider the entire GSBPM • Consider a number of dimensions of risk • Solution requirements: • Measure the risk of each ONS output • Outputs to be compared against each other • Allow drill down capabilities to identify root causes of scores • Simple to apply • Capable of self-assessment by output managers
High level project stages • • Agree coverage/scope of project with Directors Communication with staff Design solution dimensions and weighting Set up solution template Pilot with business areas Refine tool if necessary Collect information from all business areas Collate into template tool and produce RAG status per system/output • QA results • Produce analysis output
Value Engineering Wikipedia Definition: “Value engineering (VE) is a systematic method to improve the "value" of goods or products and services by using an examination of function” Applied to statistical outputs, it provides a systematic risk assessment against a number of dimensions
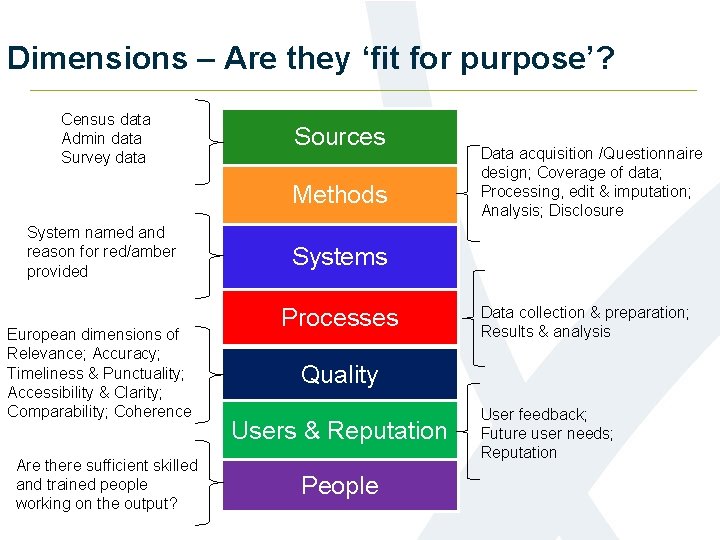
Dimensions – Are they ‘fit for purpose’? Census data Admin data Survey data Sources Methods System named and reason for red/amber provided European dimensions of Relevance; Accuracy; Timeliness & Punctuality; Accessibility & Clarity; Comparability; Coherence Are there sufficient skilled and trained people working on the output? Data acquisition /Questionnaire design; Coverage of data; Processing, edit & imputation; Analysis; Disclosure Systems Processes Data collection & preparation; Results & analysis Quality Users & Reputation People User feedback; Future user needs; Reputation
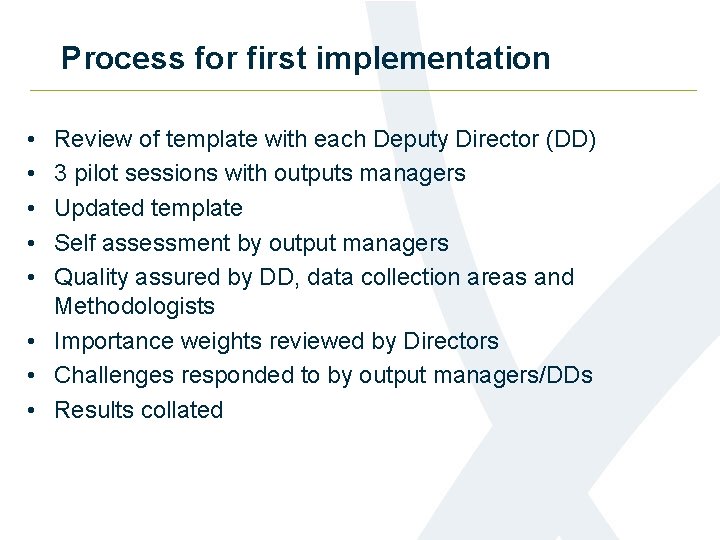
Process for first implementation • • • Review of template with each Deputy Director (DD) 3 pilot sessions with outputs managers Updated template Self assessment by output managers Quality assured by DD, data collection areas and Methodologists • Importance weights reviewed by Directors • Challenges responded to by output managers/DDs • Results collated
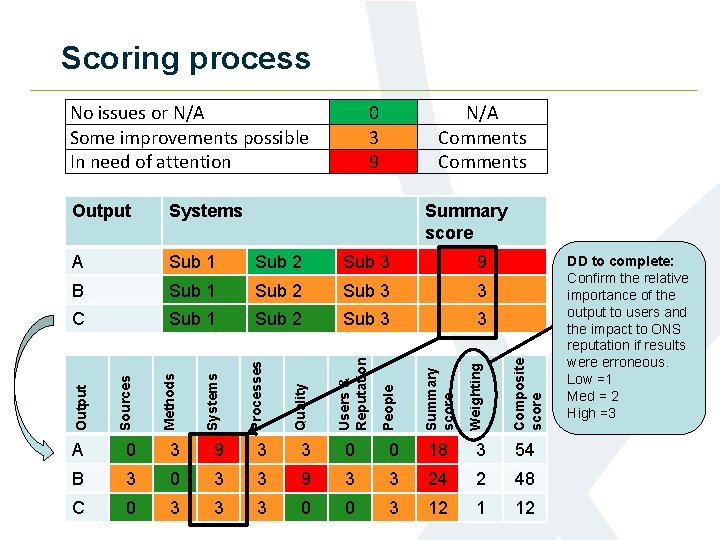
Scoring process No issues or N/A Some improvements possible In need of attention 0 3 9 N/A Comments Summary score A Sub 1 Sub 2 Sub 3 9 B Sub 1 Sub 2 Sub 3 3 C Sub 1 Sub 2 Sub 3 3 Quality 9 3 3 0 0 18 3 54 B 3 0 3 3 9 3 3 24 2 48 C 0 3 3 3 0 0 3 12 1 12 Weighting Processes 3 Summary score Systems 0 People Methods A Output Sources Composite score Systems Users & Reputation Output DD to complete: Confirm the relative importance of the output to users and the impact to ONS reputation if results were erroneous. Low =1 Med = 2 High =3
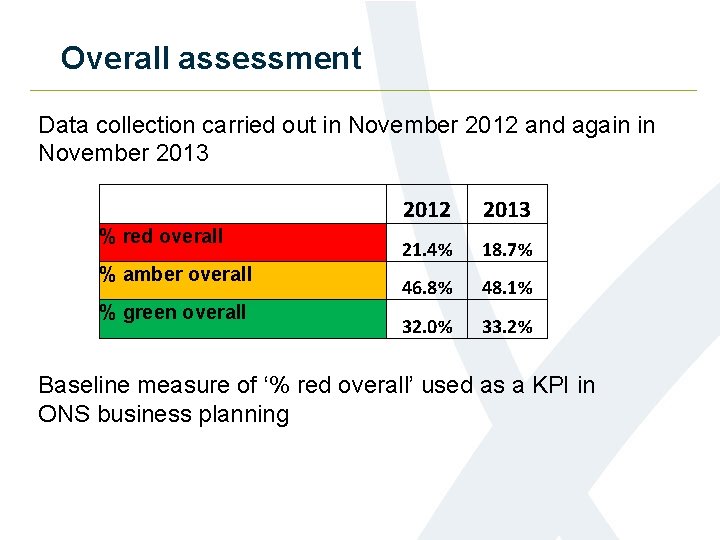
Overall assessment Data collection carried out in November 2012 and again in November 2013 % red overall % amber overall % green overall 2012 2013 21. 4% 18. 7% 46. 8% 48. 1% 32. 0% 33. 2% Baseline measure of ‘% red overall’ used as a KPI in ONS business planning
Highest scoring outputs Analysis of scores in November 2012 and November 2013 allowed identification of top ten scoring outputs – i. e. highest risk Reasons for movements over the year also analysed to identify existing mitigating actions and identification of what remains to be addressed
Analyse - Boxplots Comparison of scores after 1 year • Identify improvements made • Confirm new candidate surveys for improvement • Review cause of outliers and corrective action required
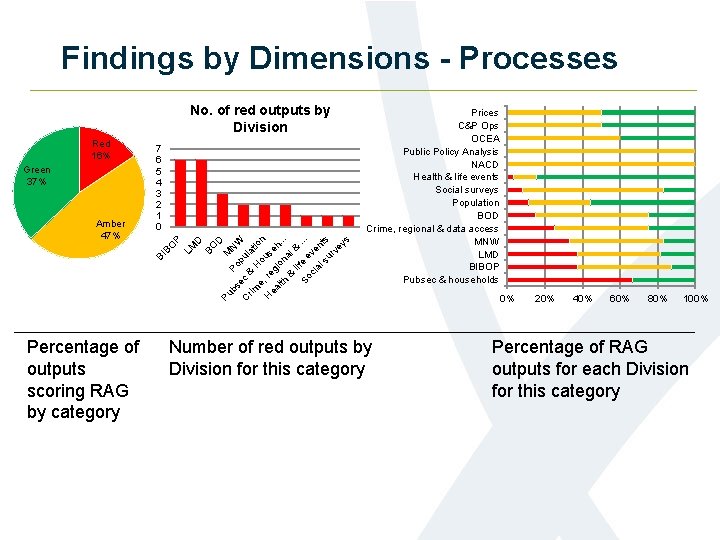
Findings by Dimensions - Processes No. of red outputs by Division Percentage of outputs scoring RAG by category D BO D Pu M bs Po NW C ec & pul rim at e, Ho ion u H r ea eg seh i lth on. . . & al & li So fe e. . . v ci al en su ts rv ey s BI BO Amber 47% P Green 37% 7 6 5 4 3 2 1 0 LM Red 16% Prices C&P Ops OCEA Public Policy Analysis NACD Health & life events Social surveys Population BOD Crime, regional & data access MNW LMD BIBOP Pubsec & households Number of red outputs by Division for this category 0% 20% 40% 60% 80% 100% Percentage of RAG outputs for each Division for this category
Use of analysis to date (1) • Prioritisation of National Statistics Quality Reviews • Input to survey action plans - identifying and prioritising key improvements required • Identifying local continuous improvement initiatives • Prioritising developments and influencing budget allocations • Sense checking where we are currently investing in developments
Use of analysis to date (2) • Deploying our skilled people to reduce risks in key areas • Improving communications on outputs • Highlighting where we need careful stakeholder handling
Conclusion • Model meets the intended purpose • Gaining in popularity and application • Has become a key tool in the risk assessment of ONS outputs • Need to be aware that this is based on self assessment, but mitigating actions in place • Should be used as part of a wider range of risk & quality assessment tools
Questions