Sutherland High Natural School Science Grade 8 2017


- Slides: 25
Sutherland High Natural School Science Grade 8 2017 Good scientific practices
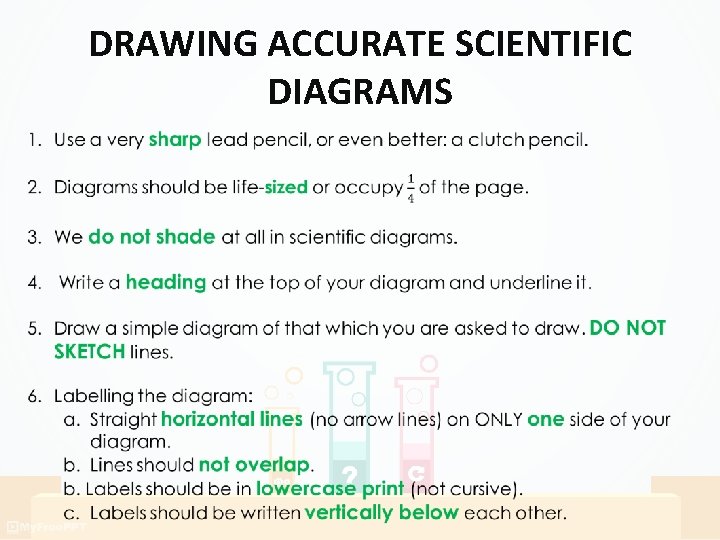
DRAWING ACCURATE SCIENTIFIC DIAGRAMS
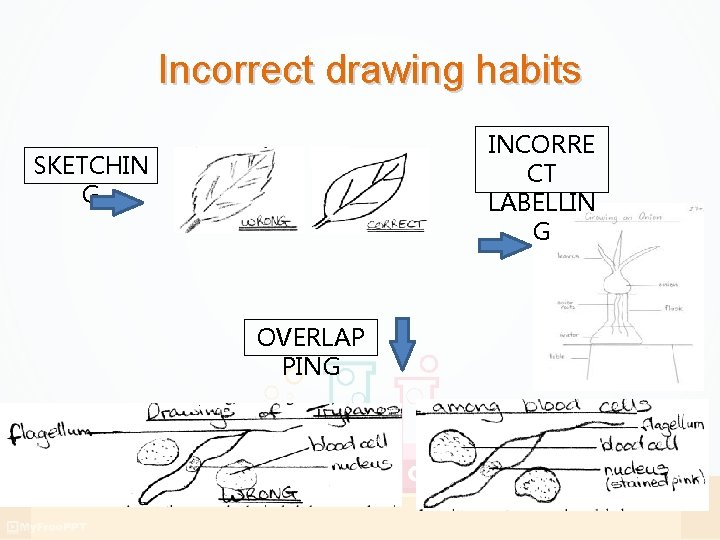
Incorrect drawing habits INCORRE CT LABELLIN G SKETCHIN G OVERLAP PING
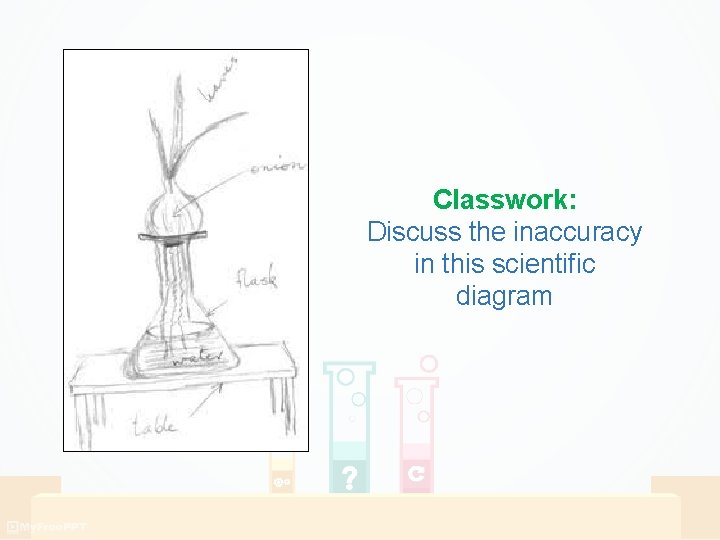
Classwork: Discuss the inaccuracy in this scientific diagram
WORKSHEET: Labelling Diagrams HOMEWORK
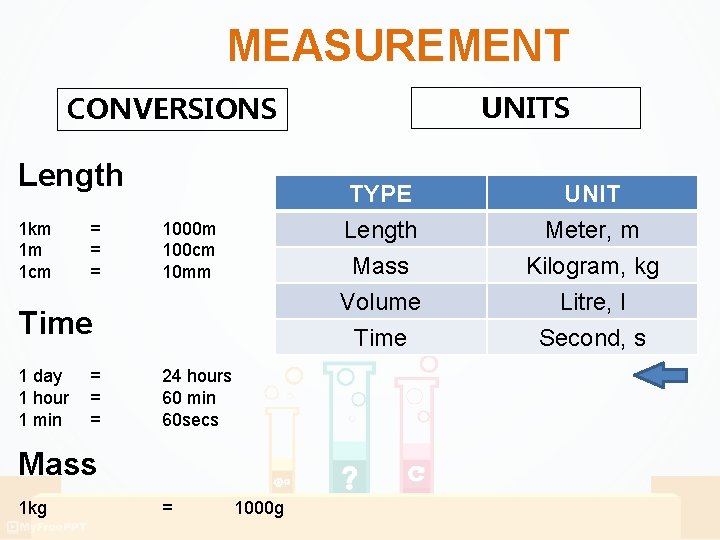
MEASUREMENT UNITS CONVERSIONS Length 1 km 1 m 1 cm = = = 1000 m 100 cm 10 mm Time 1 day 1 hour 1 min = = = 24 hours 60 min 60 secs Mass 1 kg = 1000 g TYPE Length Mass Volume UNIT Meter, m Kilogram, kg Litre, l Time Second, s
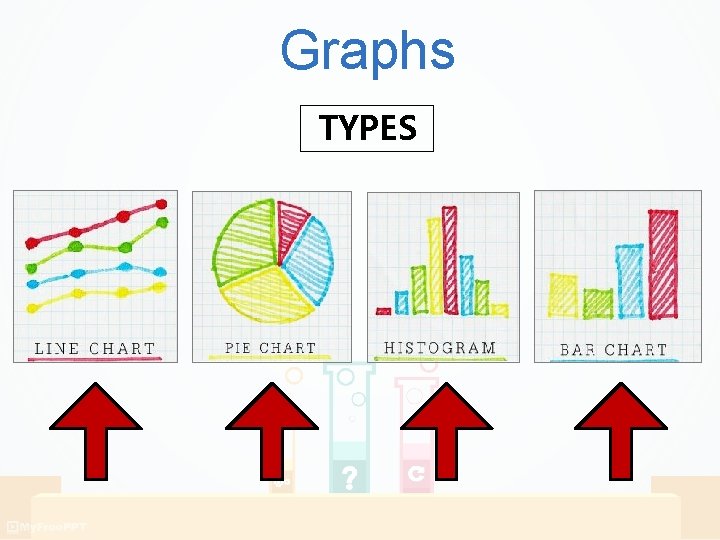
Graphs TYPES
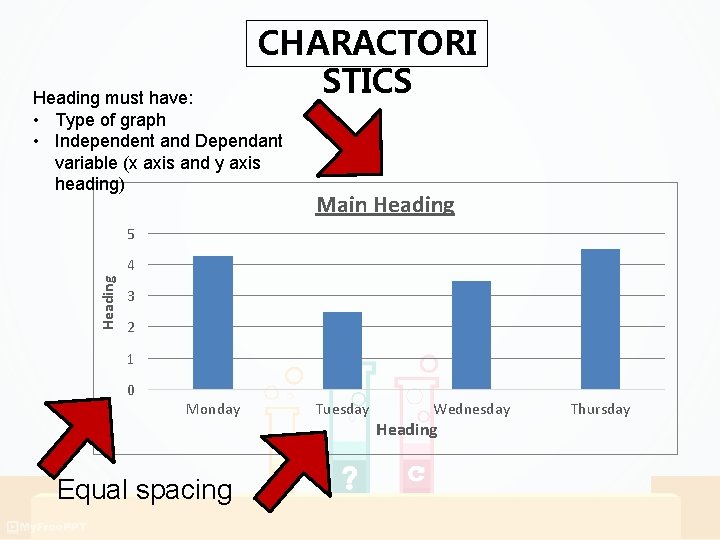
CHARACTORI STICS Heading must have: • Type of graph • Independent and Dependant variable (x axis and y axis heading) Main Heading 5 Heading 4 3 2 1 0 Monday Equal spacing Tuesday Wednesday Heading Thursday
WORKSHEET: Drawing Graphs HOMEWORK
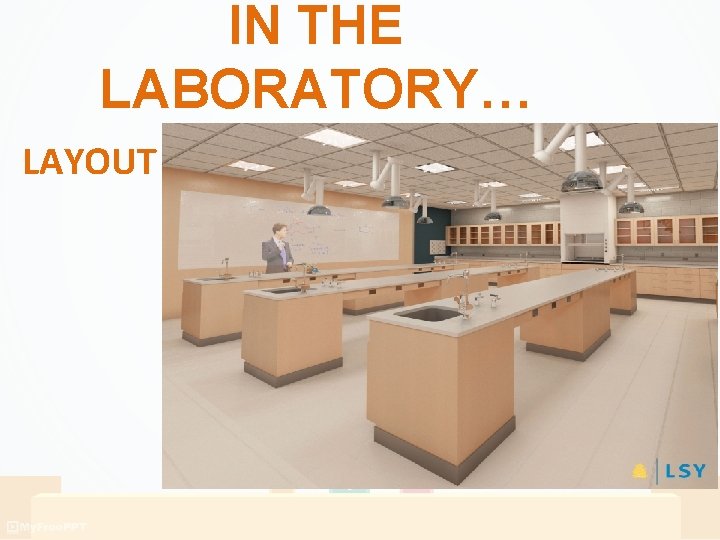
IN THE LABORATORY… LAYOUT
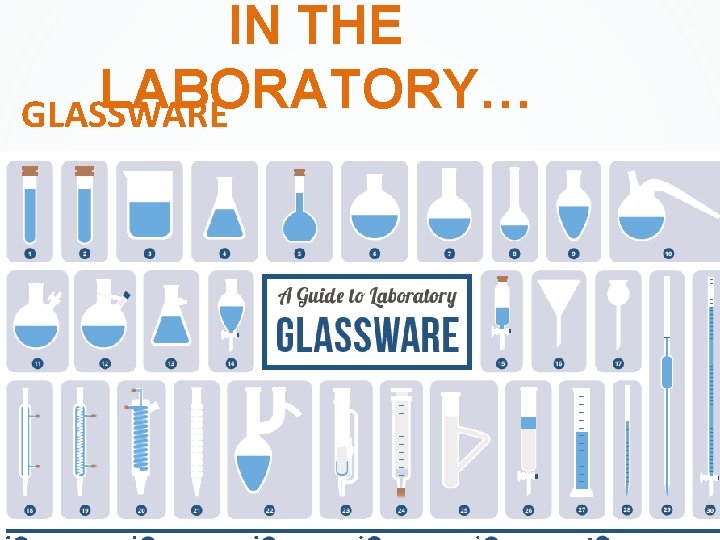
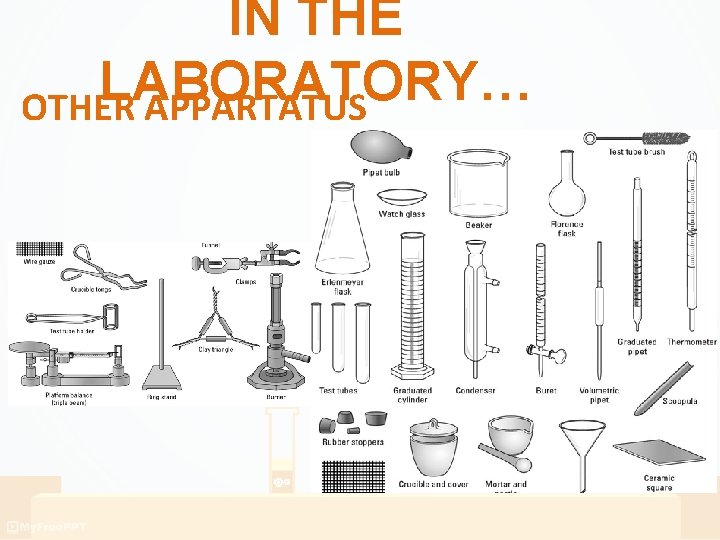
IN THE LABORATORY… GLASSWARE
IN THE LABORATORY… OTHER APPARTATUS
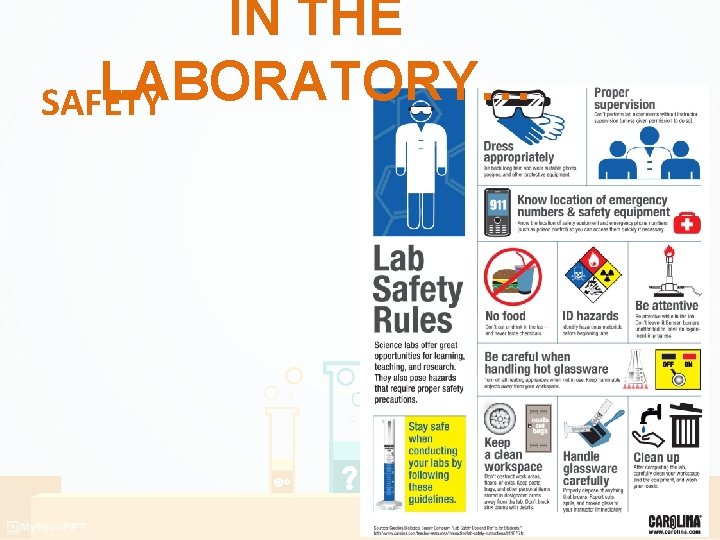
IN THE LABORATORY… SAFETY
IN THE LABORATORY… THE REPORT THE SCIENTIFIC METHOD
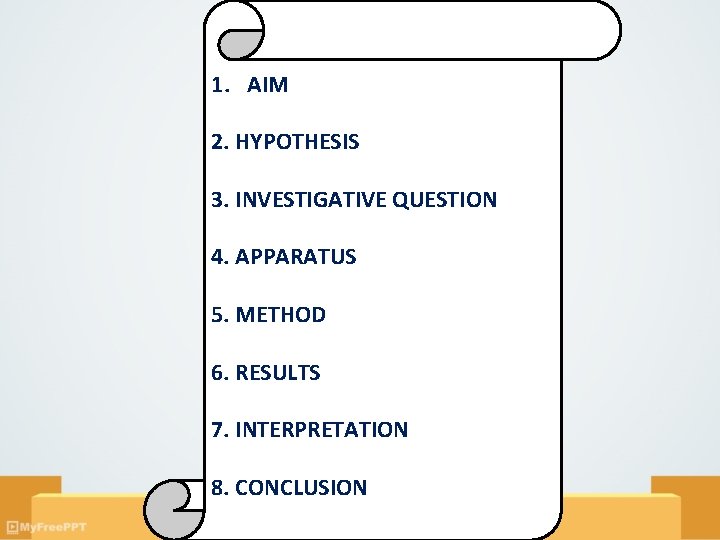
1. AIM 2. HYPOTHESIS 3. INVESTIGATIVE QUESTION 4. APPARATUS 5. METHOD 6. RESULTS 7. INTERPRETATION 8. CONCLUSION
1. AIM Why are you doing this experiment? This is not a question. It’s a statement.
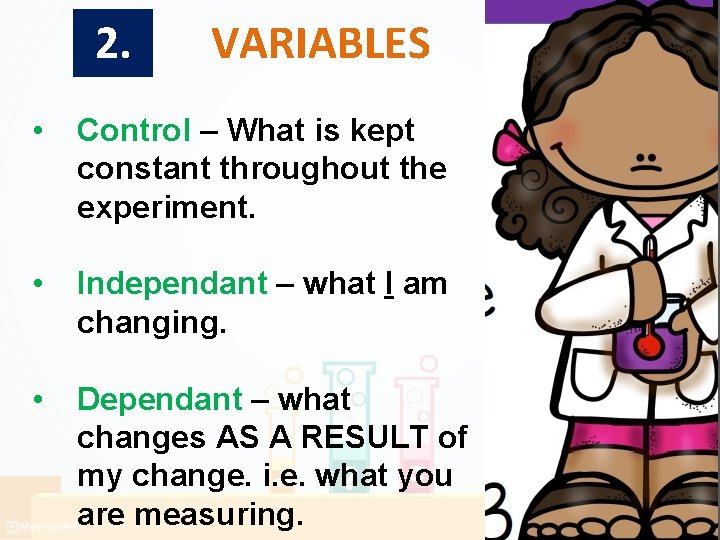
2. VARIABLES • Control – What is kept constant throughout the experiment. • Independant – what I am changing. • Dependant – what changes AS A RESULT of my change. i. e. what you are measuring.
3. APPARATUS All the tools and equipment that you have used. Also all the substances used in the experiment.
4. INVESTIGATIVE QUESTION • Question. ? ? • Must have all 3 variables • Must not have a “yes” or “no” answer. • E. g. “What is the relationship between…”
5. HYPOTHESIS What you PREDICT is going to happen.
6. METHOD Bullet point or Numbered. NOT a paragraph!
7. RESULTS Table (units must appear in the table HEADINGS)
8. OBSERVATION • What did you notice during the experiment? • It must be RELEVANT! It must bring you closer to answering your question. • What do you SEE (e. g. colour change, bubbles) SMELL etc.
9. INTERPRETATION • Graphs. • Interpret what you have observed. • e. g. Increase, decrease…“Inversely proportional ; directly proportional. ”
10. CONCLUSION Answer your investigative question. With all your VARIABLES.