Science Fair Project Planner Name Grade Teacher 120


- Slides: 19
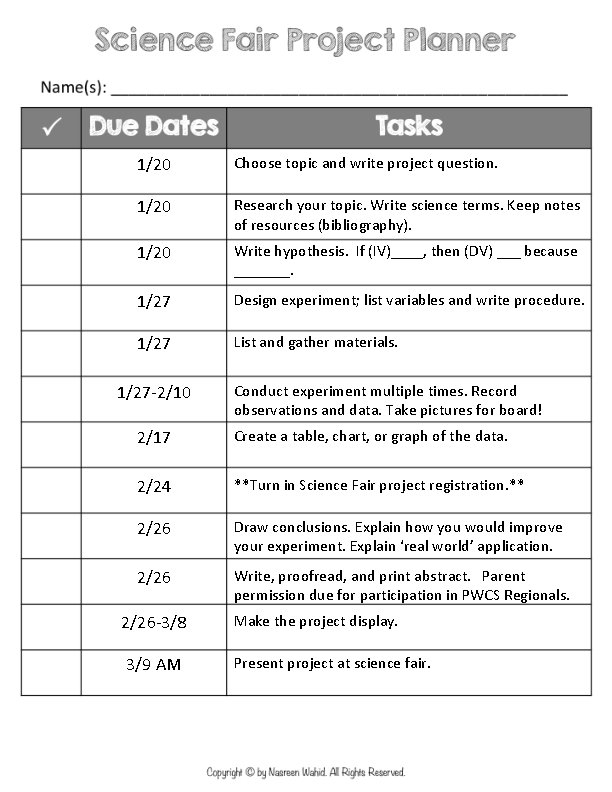
Science Fair Project Planner Name________ Grade____ Teacher______
1/20 Choose topic and write project question. 1/20 Research your topic. Write science terms. Keep notes of resources (bibliography). 1/20 Write hypothesis. If (IV)____, then (DV) ___ because _______. 1/27 Design experiment; list variables and write procedure. 1/27 List and gather materials. 1/27 -2/10 Conduct experiment multiple times. Record observations and data. Take pictures for board! 2/17 Create a table, chart, or graph of the data. 2/24 **Turn in Science Fair project registration. ** 2/26 Draw conclusions. Explain how you would improve your experiment. Explain ‘real world’ application. 2/26 Write, proofread, and print abstract. Parent permission due for participation in PWCS Regionals. 2/26 -3/8 3/9 AM Make the project display. Present project at science fair.
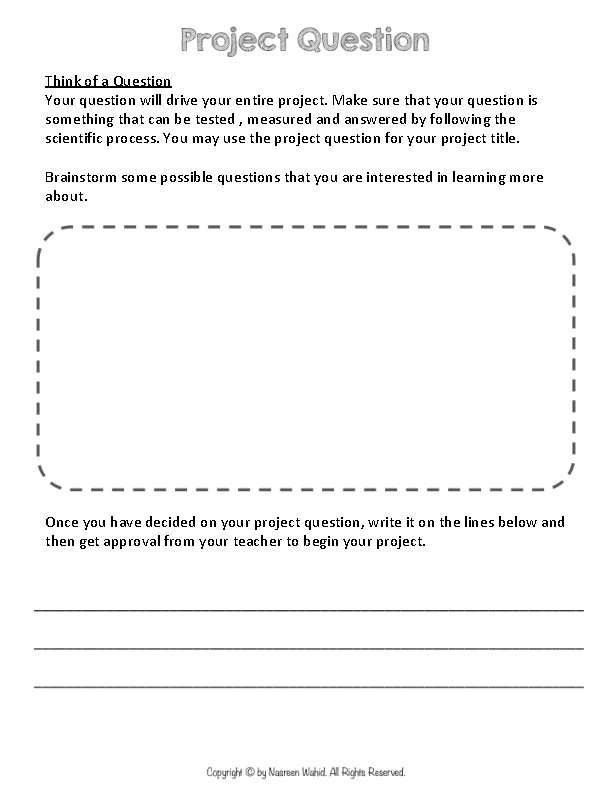
Think of a Question Your question will drive your entire project. Make sure that your question is something that can be tested , measured answered by following the scientific process. You may use the project question for your project title. Brainstorm some possible questions that you are interested in learning more about. Once you have decided on your project question, write it on the lines below and then get approval from your teacher to begin your project.
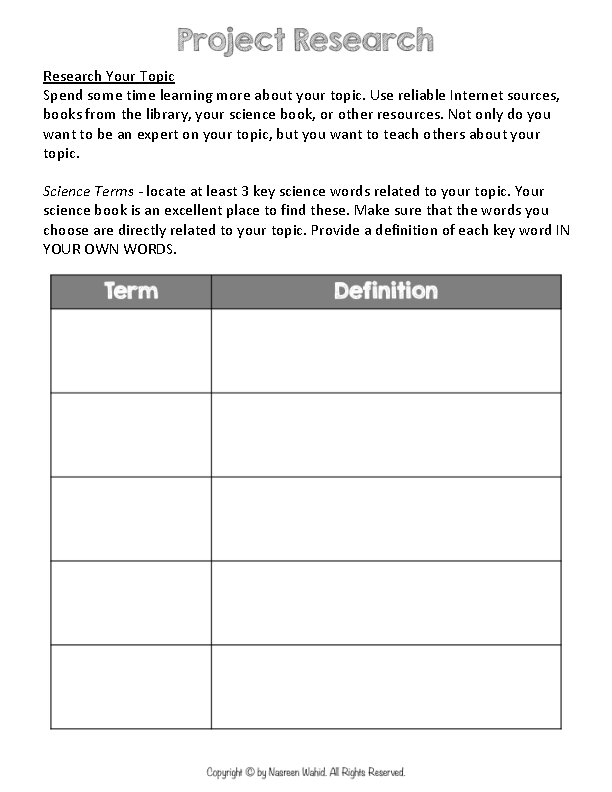
Research Your Topic Spend some time learning more about your topic. Use reliable Internet sources, books from the library, your science book, or other resources. Not only do you want to be an expert on your topic, but you want to teach others about your topic. Science Terms - locate at least 3 key science words related to your topic. Your science book is an excellent place to find these. Make sure that the words you choose are directly related to your topic. Provide a definition of each key word IN YOUR OWN WORDS.
A paragraph describing the science behind your project - after you have completed your research give us, your audience, some background information on your topic in a complete and well-written paragraph. Give us specific, rather than general information. Use the space provided to write a draft. You will edit a final copy to place on your display board.
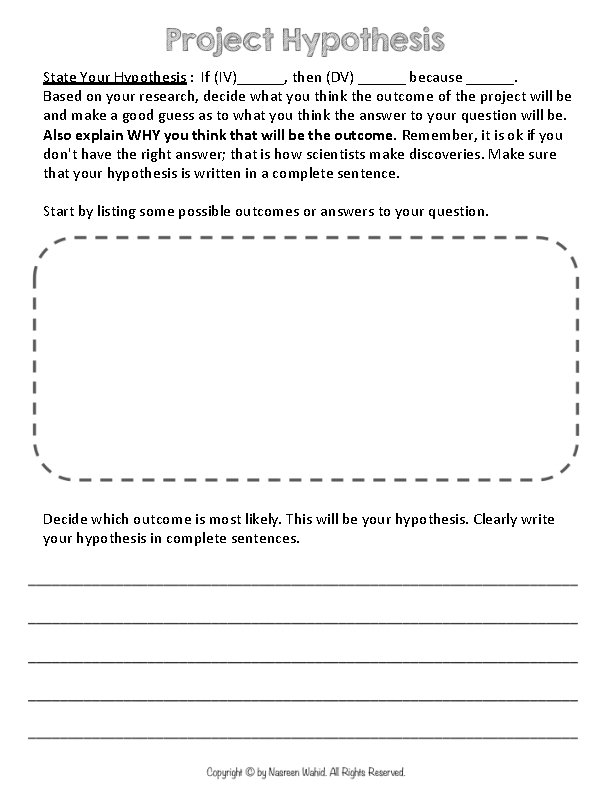
State Your Hypothesis : If (IV)______, then (DV) ______ because ______. Based on your research, decide what you think the outcome of the project will be and make a good guess as to what you think the answer to your question will be. Also explain WHY you think that will be the outcome. Remember, it is ok if you don't have the right answer; that is how scientists make discoveries. Make sure that your hypothesis is written in a complete sentence. Start by listing some possible outcomes or answers to your question. Decide which outcome is most likely. This will be your hypothesis. Clearly write your hypothesis in complete sentences.
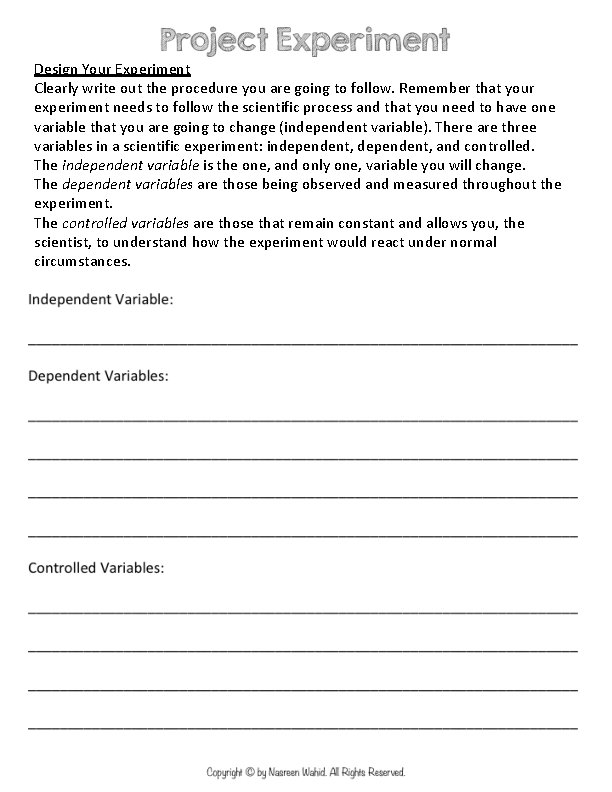
Design Your Experiment Clearly write out the procedure you are going to follow. Remember that your experiment needs to follow the scientific process and that you need to have one variable that you are going to change (independent variable). There are three variables in a scientific experiment: independent, and controlled. The independent variable is the one, and only one, variable you will change. The dependent variables are those being observed and measured throughout the experiment. The controlled variables are those that remain constant and allows you, the scientist, to understand how the experiment would react under normal circumstances.
Materials List all materials needed to complete the experiment. Be specific about type, size, brand, etc.
Procedure Write out each step of your experiment. Remember to number each step and clearly explain what to do. Other scientists should be able to follow the same steps and get similar results.
Conduct experiment Scientists conduct an experiment many times in order to get the most accurate data, so make sure you also conduct your experiment multiple times. During your experiment you need to collect data and make observations. You will record these in your Experiment Log. After you have completed the experiment use your log to write down the data and observations below. In your log you will need to: Collect Data - you will need to collect numerical data; that means you need to take measurements during the experiment. Measurements can be temperature, distance, height, etc. Creating a chart is a helpful way to organize your data. You will analyze the data later to determine the results of your experiment. Make Observations - as you conduct your experiment you will use your senses (sight, smell, touch, etc. ) and write down any observations you make during the process.
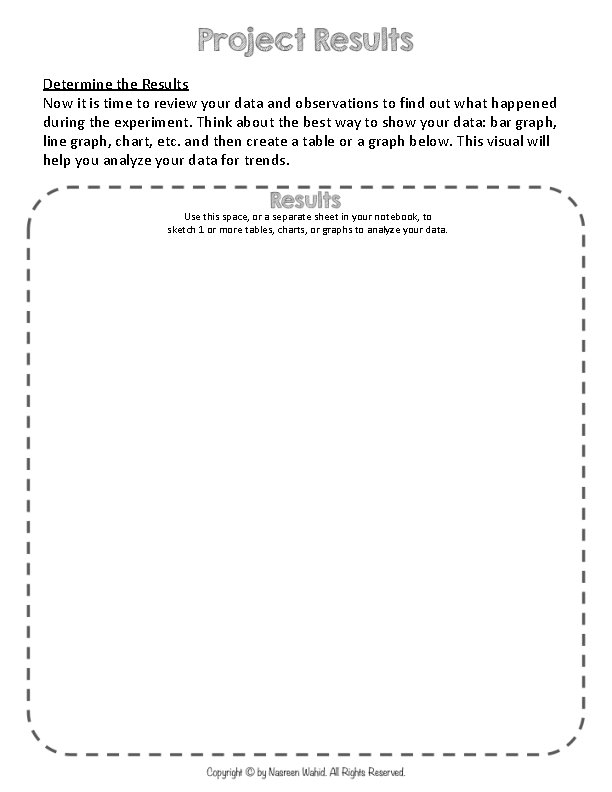
Determine the Results Now it is time to review your data and observations to find out what happened during the experiment. Think about the best way to show your data: bar graph, line graph, chart, etc. and then create a table or a graph below. This visual will help you analyze your data for trends. Use this space, or a separate sheet in your notebook, to sketch 1 or more tables, charts, or graphs to analyze your data.
Determine the Results You will also write out the results of each test in the experiment in paragraph form using complete sentences. Make sure that you include the numerical data (measurements) as well as any other important observations that you made.
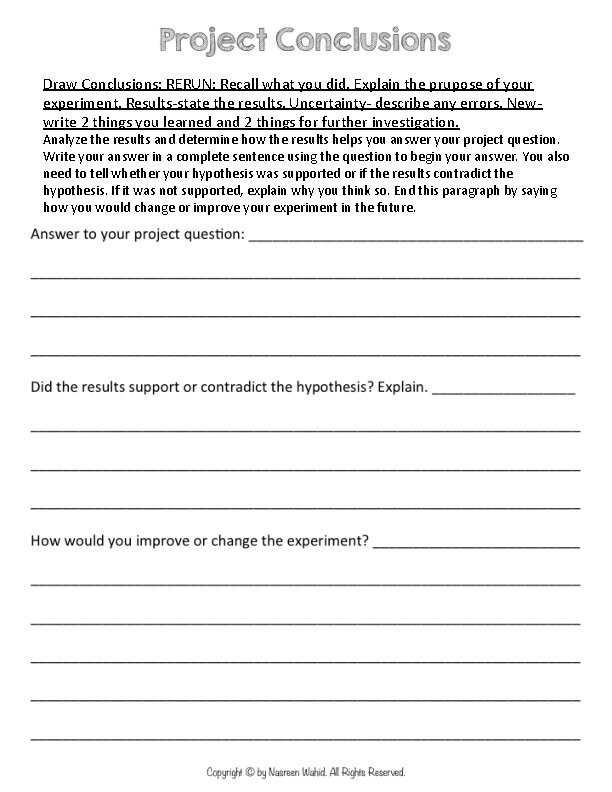
Draw Conclusions: RERUN: Recall what you did, Explain the prupose of your experiment, Results-state the results, Uncertainty- describe any errors, Newwrite 2 things you learned and 2 things for further investigation. Analyze the results and determine how the results helps you answer your project question. Write your answer in a complete sentence using the question to begin your answer. You also need to tell whether your hypothesis was supported or if the results contradict the hypothesis. If it was not supported, explain why you think so. End this paragraph by saying how you would change or improve your experiment in the future.
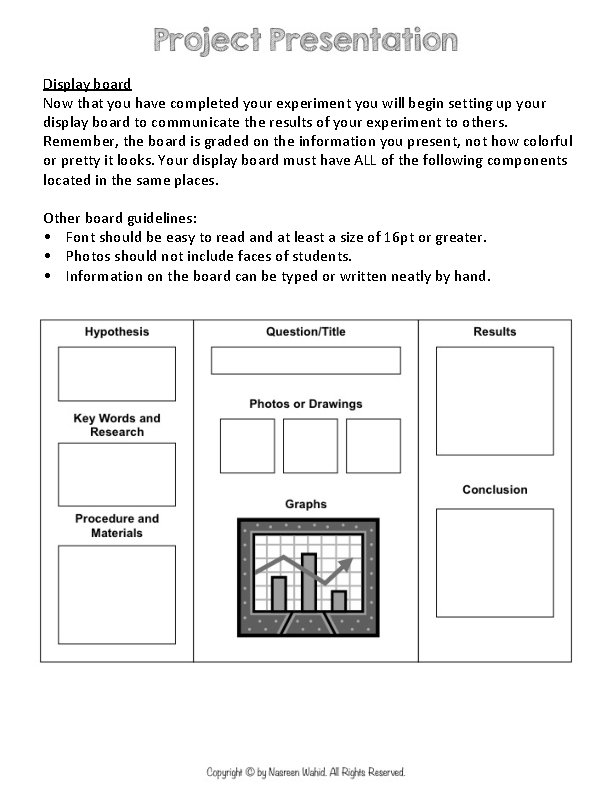
Display board Now that you have completed your experiment you will begin setting up your display board to communicate the results of your experiment to others. Remember, the board is graded on the information you present, not how colorful or pretty it looks. Your display board must have ALL of the following components located in the same places. Other board guidelines: • Font should be easy to read and at least a size of 16 pt or greater. • Photos should not include faces of students. • Information on the board can be typed or written neatly by hand.
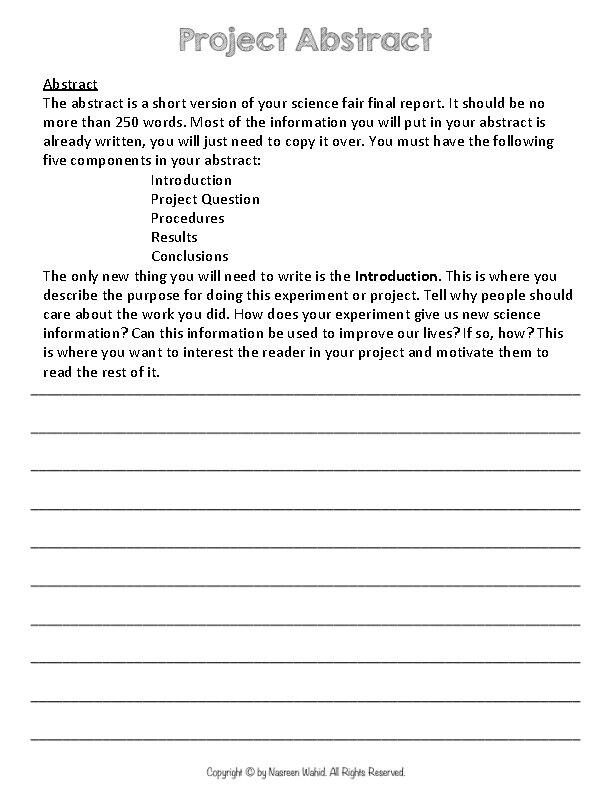
Abstract The abstract is a short version of your science fair final report. It should be no more than 250 words. Most of the information you will put in your abstract is already written, you will just need to copy it over. You must have the following five components in your abstract: Introduction Project Question Procedures Results Conclusions The only new thing you will need to write is the Introduction. This is where you describe the purpose for doing this experiment or project. Tell why people should care about the work you did. How does your experiment give us new science information? Can this information be used to improve our lives? If so, how? This is where you want to interest the reader in your project and motivate them to read the rest of it.
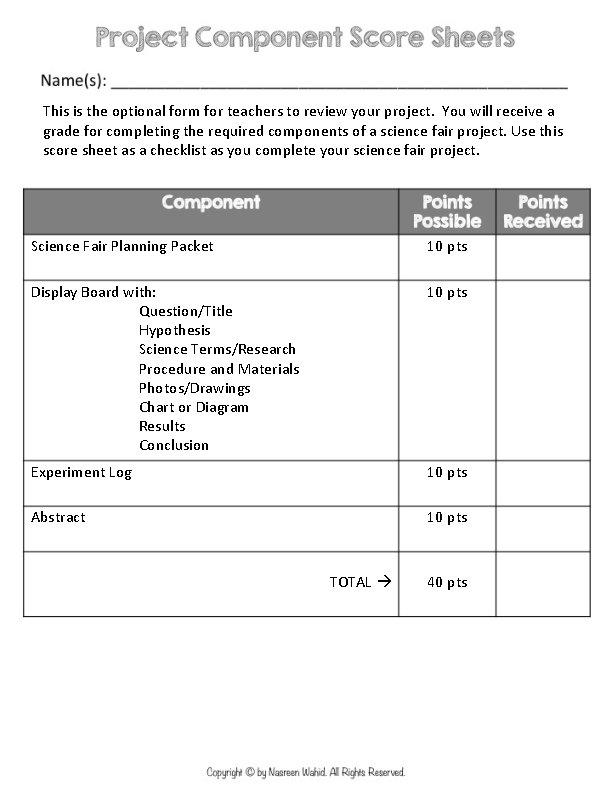
This is the optional form for teachers to review your project. You will receive a grade for completing the required components of a science fair project. Use this score sheet as a checklist as you complete your science fair project. Science Fair Planning Packet 10 pts Display Board with: Question/Title Hypothesis Science Terms/Research Procedure and Materials Photos/Drawings Chart or Diagram Results Conclusion 10 pts Experiment Log 10 pts Abstract 10 pts TOTAL 40 pts
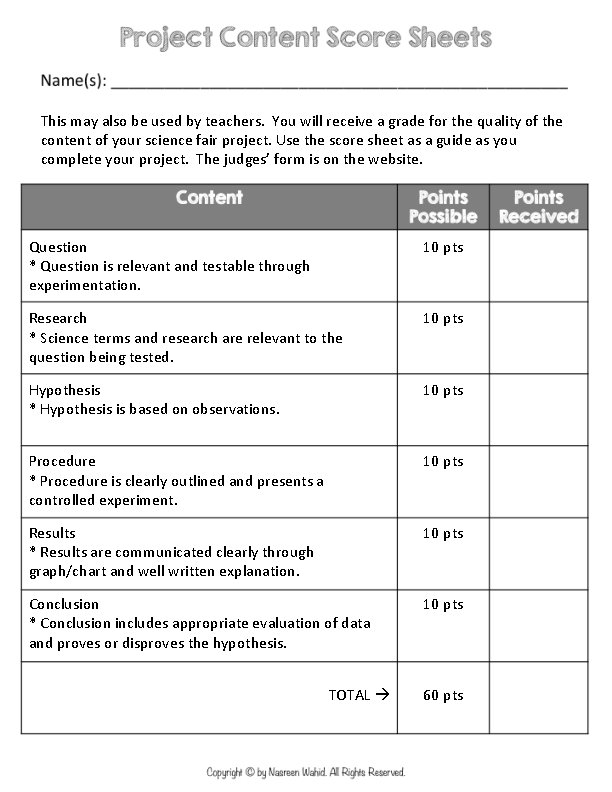
This may also be used by teachers. You will receive a grade for the quality of the content of your science fair project. Use the score sheet as a guide as you complete your project. The judges’ form is on the website. Question * Question is relevant and testable through experimentation. 10 pts Research * Science terms and research are relevant to the question being tested. 10 pts Hypothesis * Hypothesis is based on observations. 10 pts Procedure * Procedure is clearly outlined and presents a controlled experiment. 10 pts Results * Results are communicated clearly through graph/chart and well written explanation. 10 pts Conclusion * Conclusion includes appropriate evaluation of data and proves or disproves the hypothesis. 10 pts TOTAL 60 pts
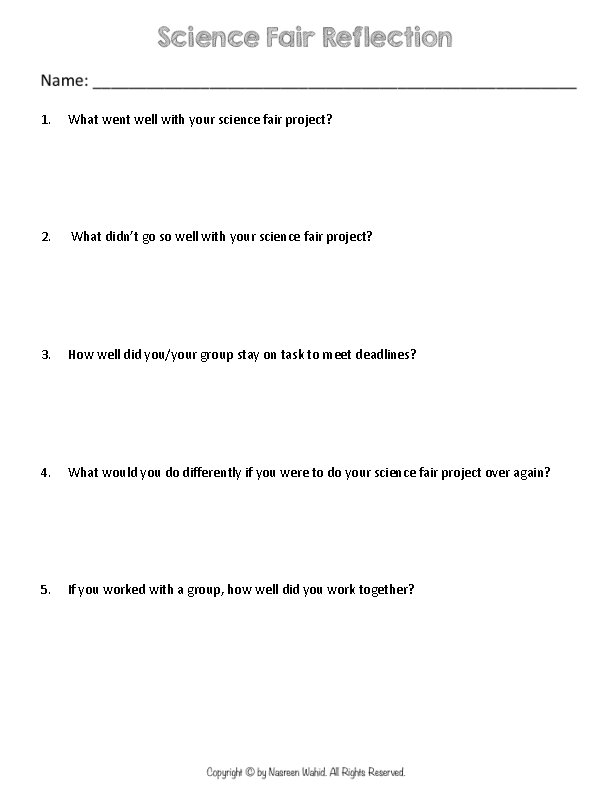
1. What went well with your science fair project? 2. What didn’t go so well with your science fair project? 3. How well did you/your group stay on task to meet deadlines? 4. What would you do differently if you were to do your science fair project over again? 5. If you worked with a group, how well did you work together?