Quality Assurance of Precision Optics Figures and Images
- Slides: 25
Quality Assurance of Precision Optics Figures and Images for Instructors Module 3 Specifications and Drawings for Precision Optics Series
© 2018 University of Central Florida This text was developed by the National Center for Optics and Photonics Education (OP-TEC), University of Central Florida, under NSF ATE grant 1303732. Any opinions, findings, and conclusions or recommendations expressed in this material are those of the author(s) and do not necessarily reflect the views of the National Science Foundation. Published and distributed by OP-TEC University of Central Florida http: //www. op-tec. org Permission to copy and distribute This work is licensed under the Creative Commons Attribution-Non. Commercial-No. Derivatives 4. 0 International License. http: //creativecommons. org/licenses/by-nc-nd/4. 0. Individuals and organizations may copy and distribute this material for non-commercial purposes. Appropriate credit to the University of Central Florida & the National Science Foundation shall be displayed, by retaining the statements on this page. 2
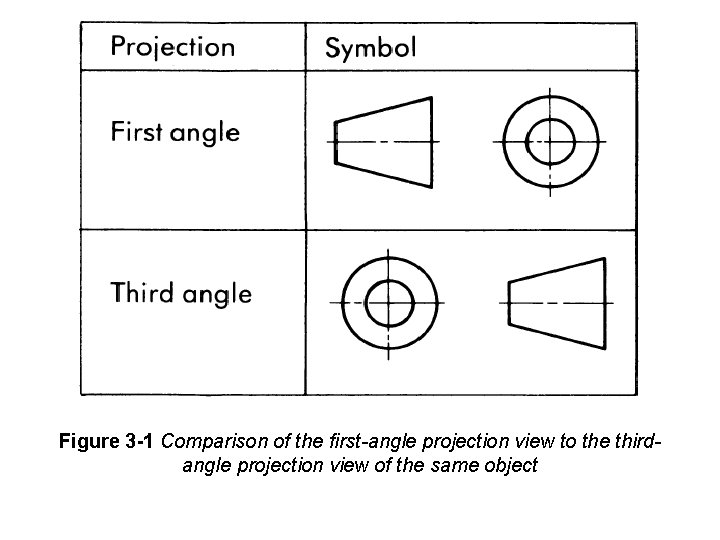
Figure 3 -1 Comparison of the first-angle projection view to the thirdangle projection view of the same object
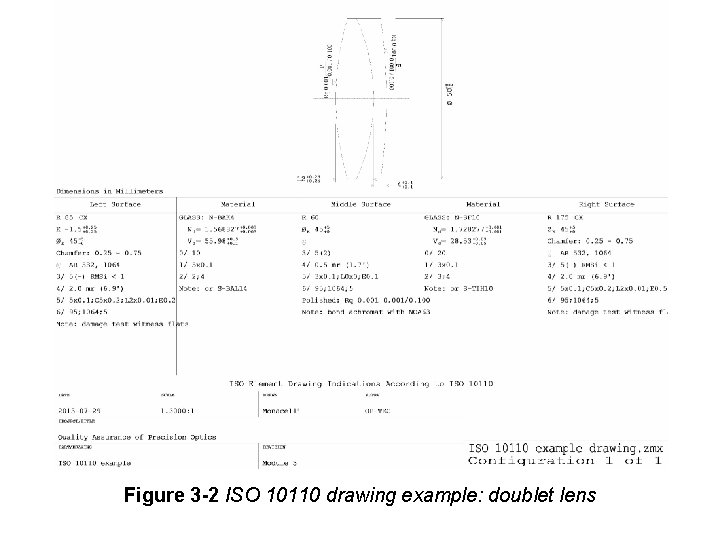
Figure 3 -2 ISO 10110 drawing example: doublet lens
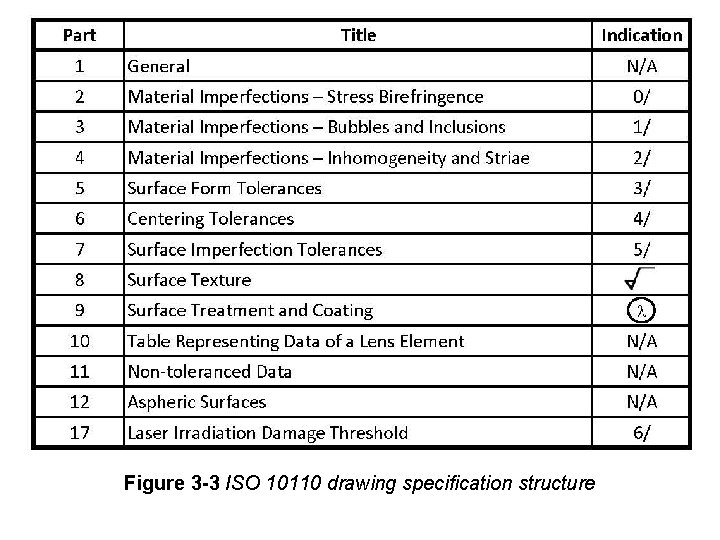
Figure 3 -3 ISO 10110 drawing specification structure
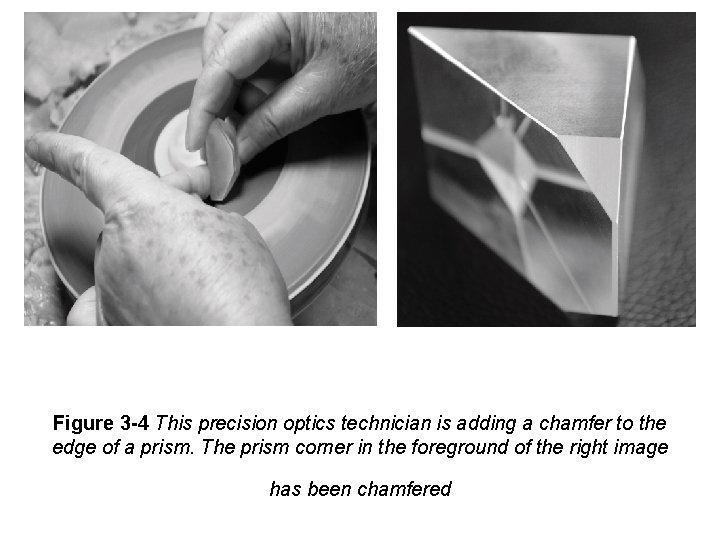
Figure 3 -4 This precision optics technician is adding a chamfer to the edge of a prism. The prism corner in the foreground of the right image has been chamfered
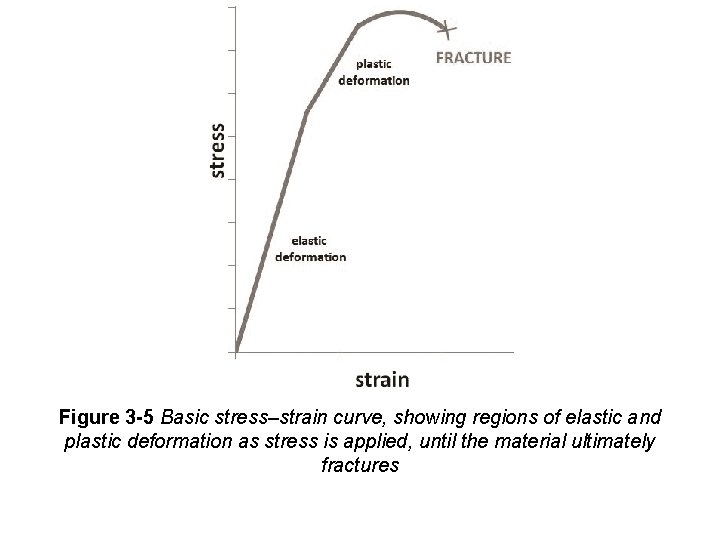
Figure 3 -5 Basic stress–strain curve, showing regions of elastic and plastic deformation as stress is applied, until the material ultimately fractures
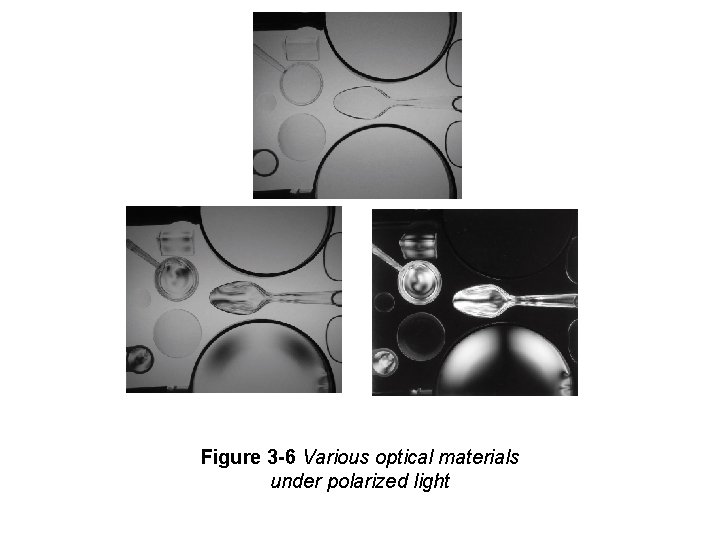
Figure 3 -6 Various optical materials under polarized light
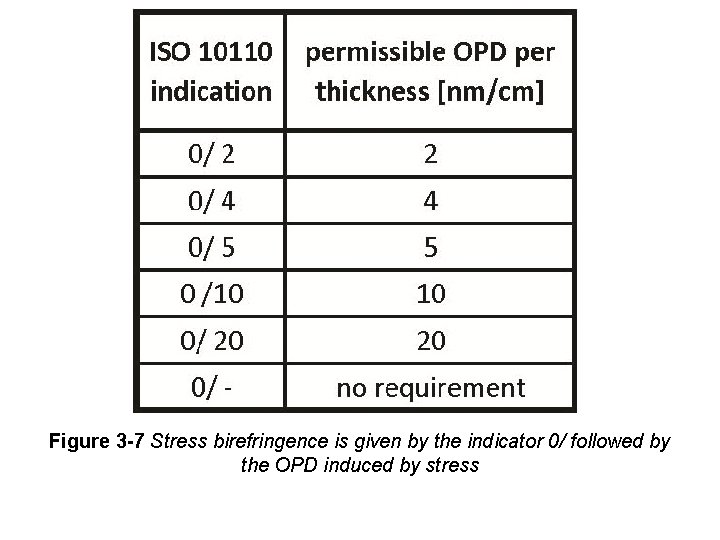
Figure 3 -7 Stress birefringence is given by the indicator 0/ followed by the OPD induced by stress
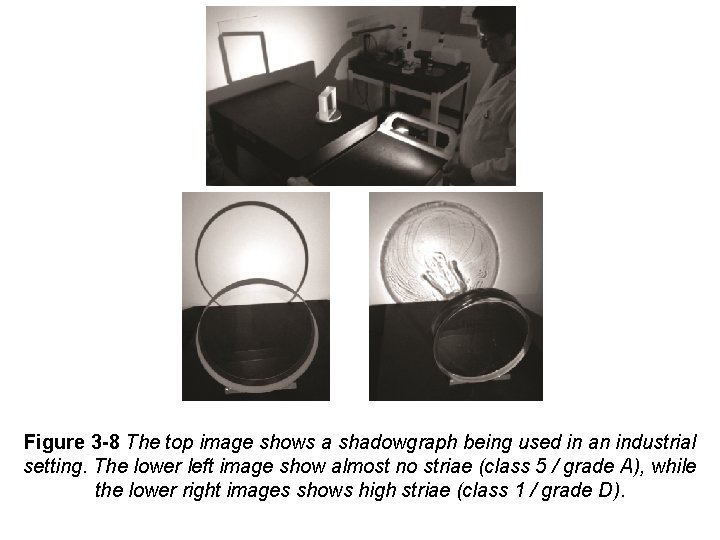
Figure 3 -8 The top image shows a shadowgraph being used in an industrial setting. The lower left image show almost no striae (class 5 / grade A), while the lower right images shows high striae (class 1 / grade D).
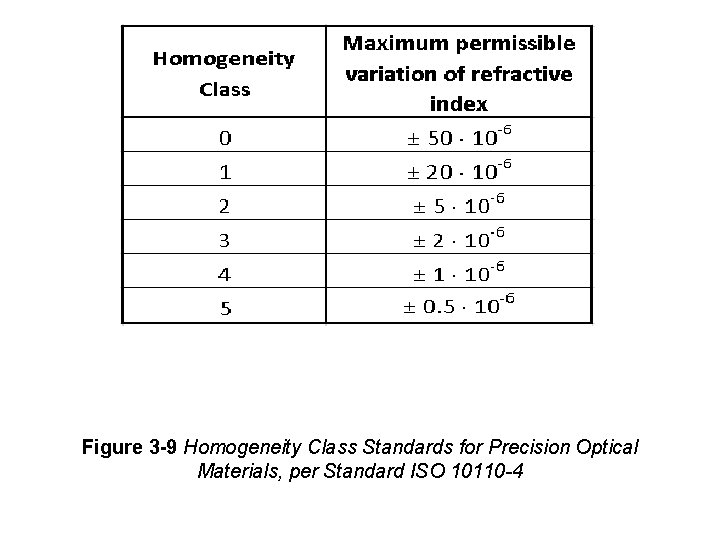
Figure 3 -9 Homogeneity Class Standards for Precision Optical Materials, per Standard ISO 10110 -4
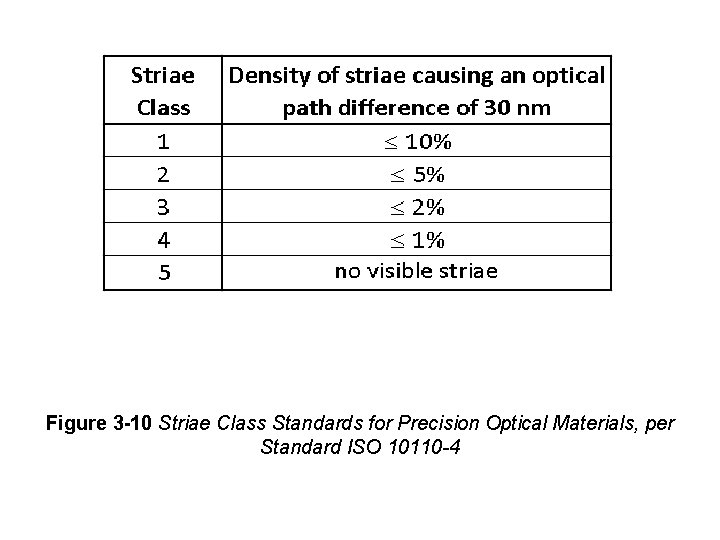
Figure 3 -10 Striae Class Standards for Precision Optical Materials, per Standard ISO 10110 -4
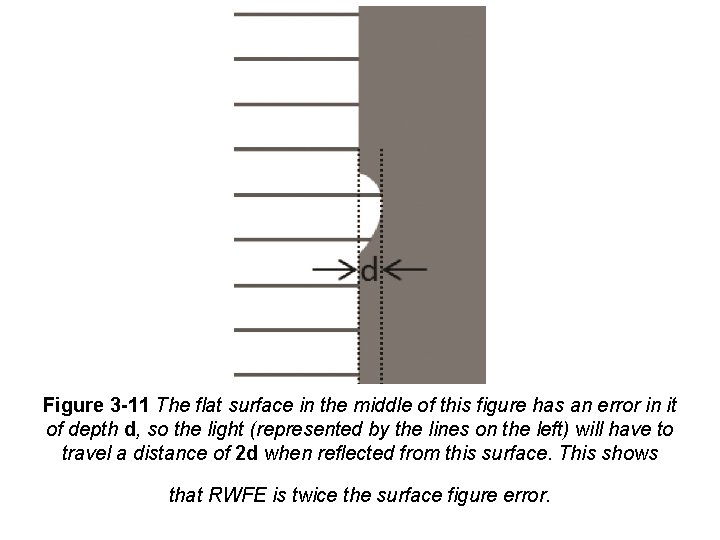
Figure 3 -11 The flat surface in the middle of this figure has an error in it of depth d, so the light (represented by the lines on the left) will have to travel a distance of 2 d when reflected from this surface. This shows that RWFE is twice the surface figure error.
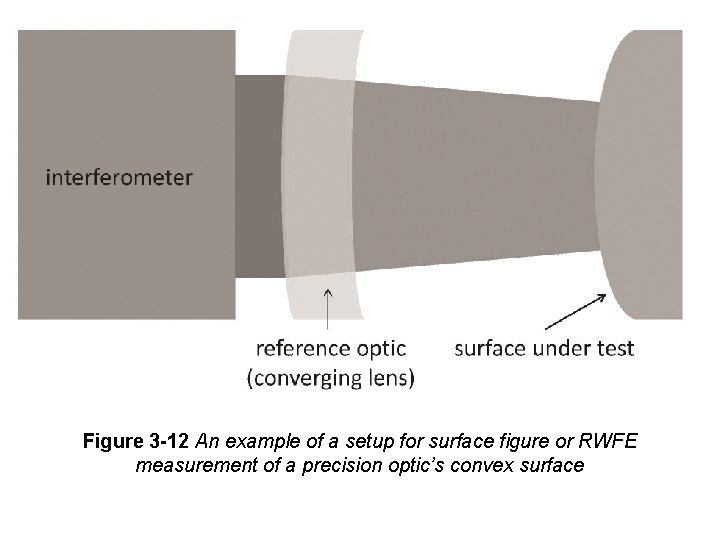
Figure 3 -12 An example of a setup for surface figure or RWFE measurement of a precision optic’s convex surface
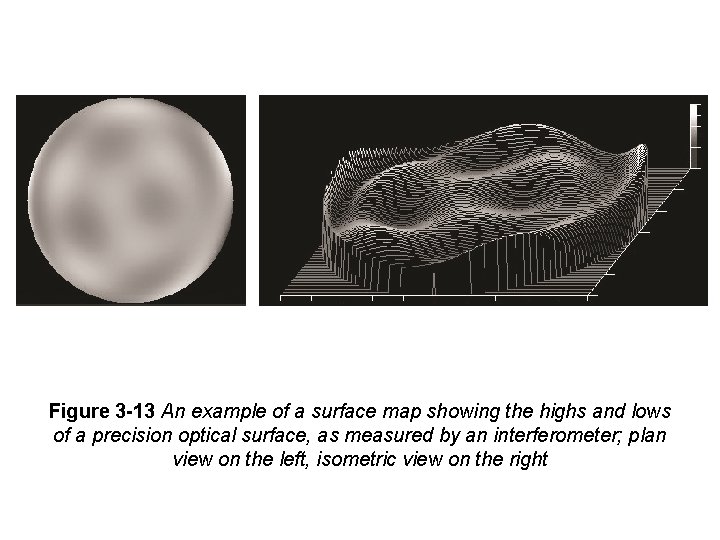
Figure 3 -13 An example of a surface map showing the highs and lows of a precision optical surface, as measured by an interferometer; plan view on the left, isometric view on the right
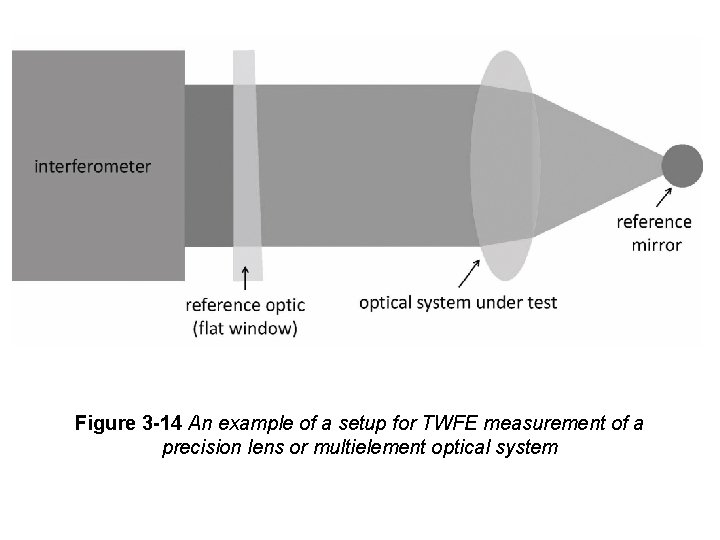
Figure 3 -14 An example of a setup for TWFE measurement of a precision lens or multielement optical system
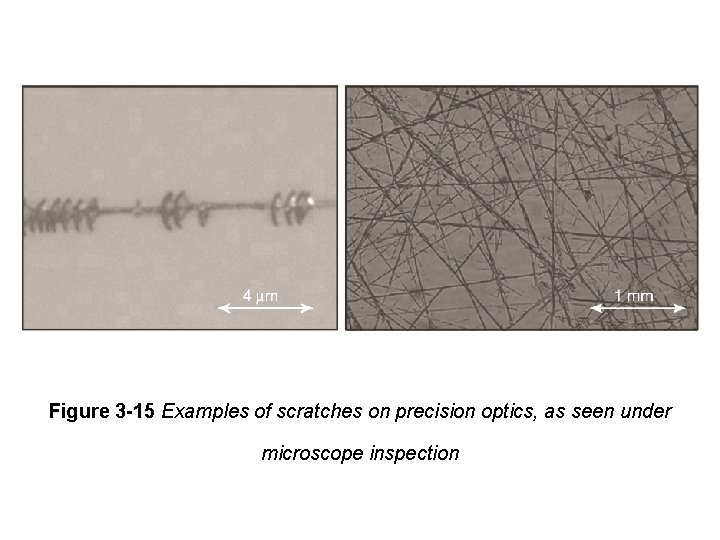
Figure 3 -15 Examples of scratches on precision optics, as seen under microscope inspection
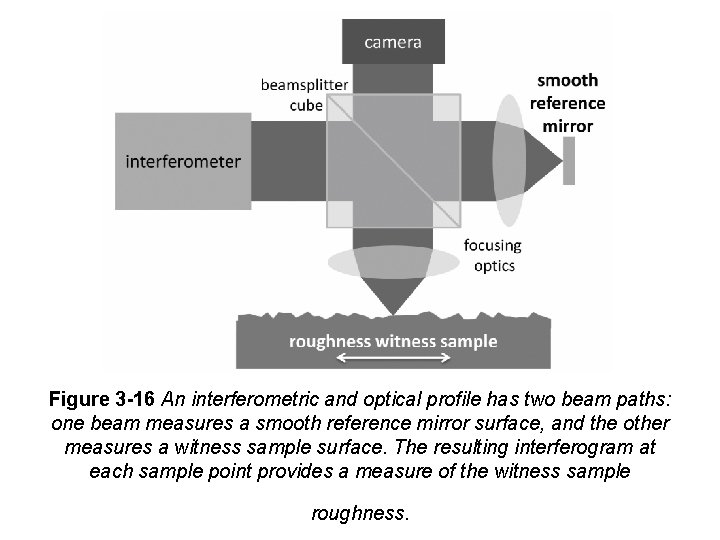
Figure 3 -16 An interferometric and optical profile has two beam paths: one beam measures a smooth reference mirror surface, and the other measures a witness sample surface. The resulting interferogram at each sample point provides a measure of the witness sample roughness.
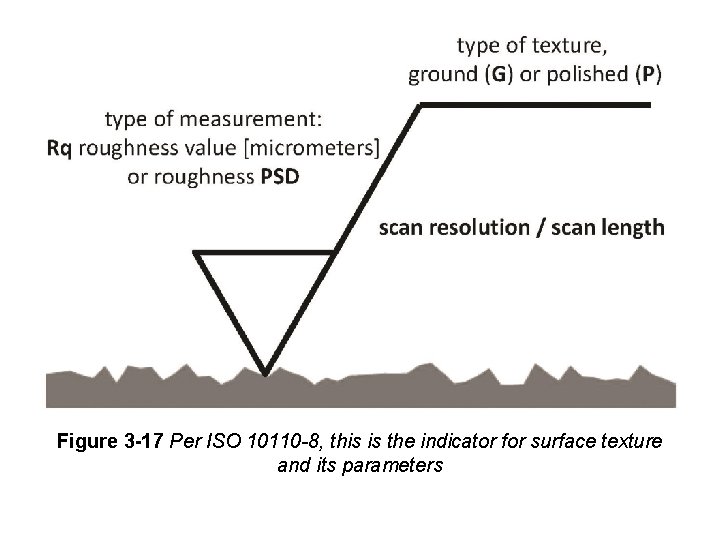
Figure 3 -17 Per ISO 10110 -8, this is the indicator for surface texture and its parameters
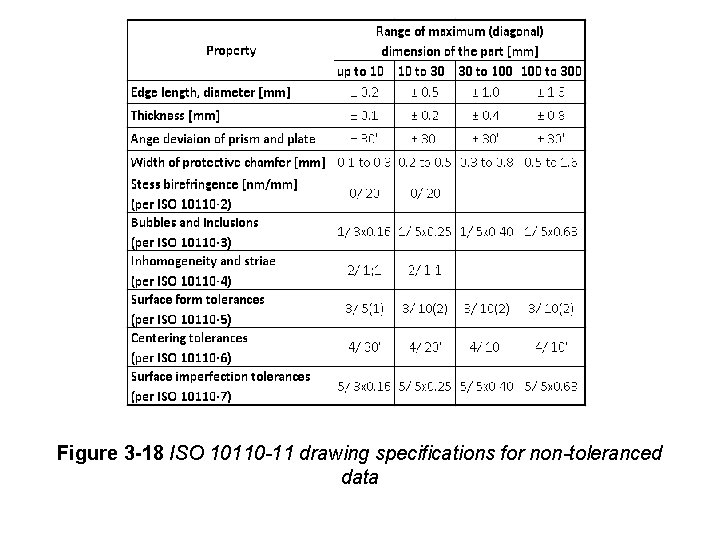
Figure 3 -18 ISO 10110 -11 drawing specifications for non-toleranced data
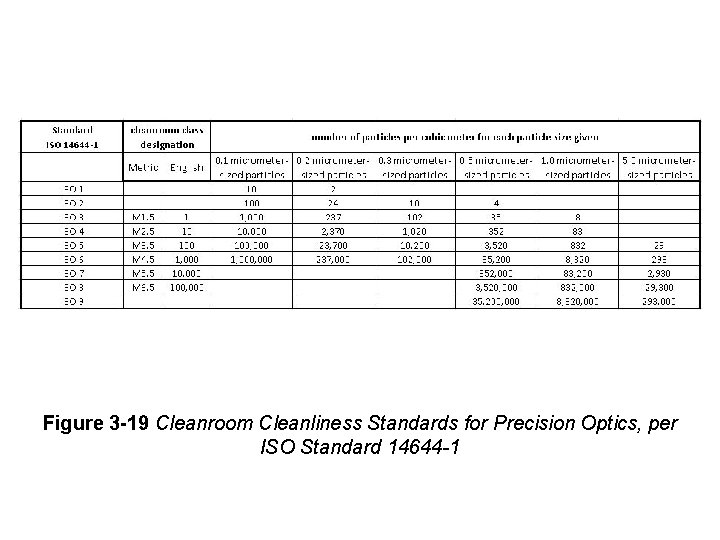
Figure 3 -19 Cleanroom Cleanliness Standards for Precision Optics, per ISO Standard 14644 -1
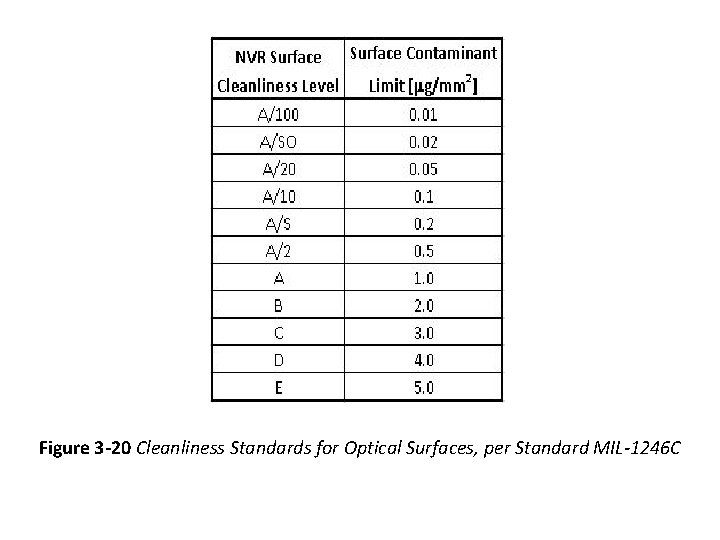
Figure 3 -20 Cleanliness Standards for Optical Surfaces, per Standard MIL-1246 C
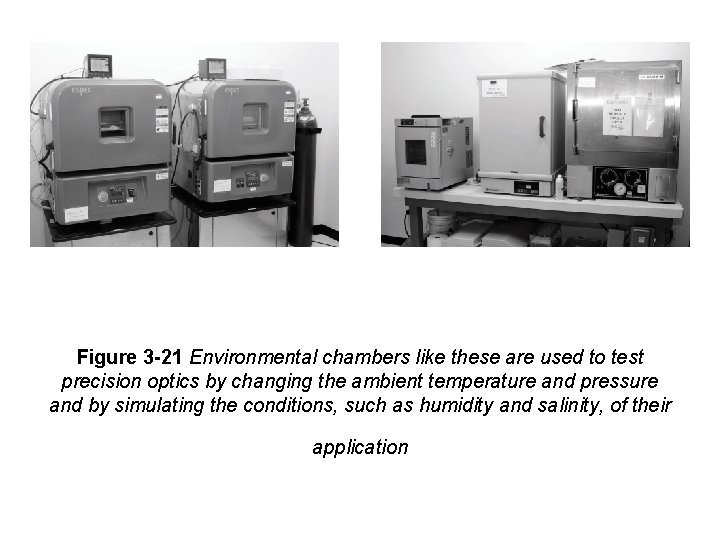
Figure 3 -21 Environmental chambers like these are used to test precision optics by changing the ambient temperature and pressure and by simulating the conditions, such as humidity and salinity, of their application
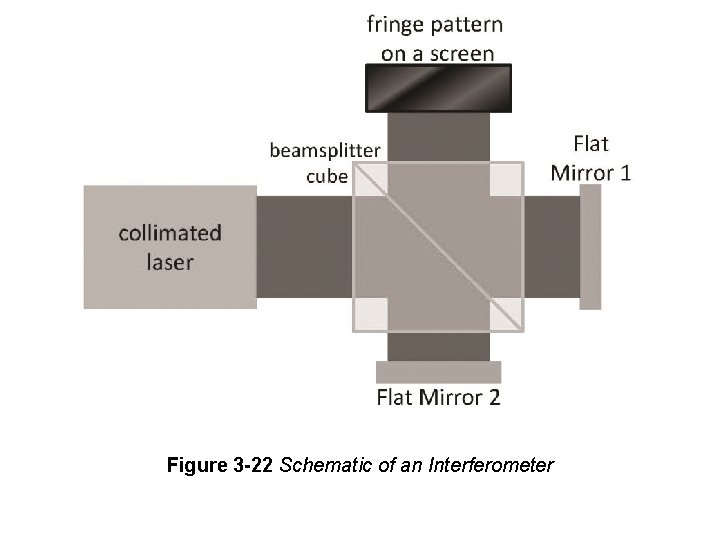
Figure 3 -22 Schematic of an Interferometer
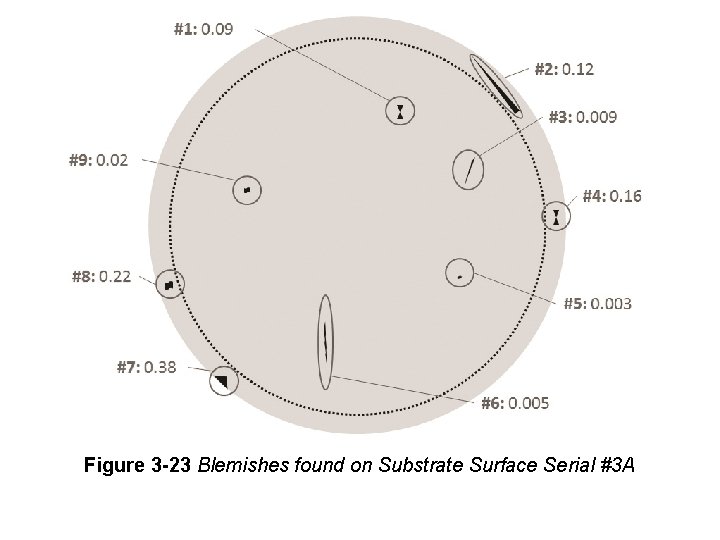
Figure 3 -23 Blemishes found on Substrate Surface Serial #3 A