Quadratic Equations Intersection Higher GCSE Questions These questions


- Slides: 7
Quadratic Equations – Intersection – Higher – GCSE Questions These questions are the same format as previous GCSE exams. COPY means they use the exact same numbers as the original GCSE question. Otherwise, they are clone questions using different numbers. The worksheets are provided in a variety of sizes.
Printing To print handouts from slides Select the slide from the left. Then click: File > Print > ‘Print Current Slide’ To print multiple slides Click on a section title to highlight all those slides, or press ‘Ctrl’ at the same time as selecting slides to highlight more than one. Then click: File > Print > ‘Print Selection’ To print double-sided handouts Highlight both slides before using ‘Print Selection’. Choose ‘Print on Both Sides’ and ‘Flip on Short Edge’.
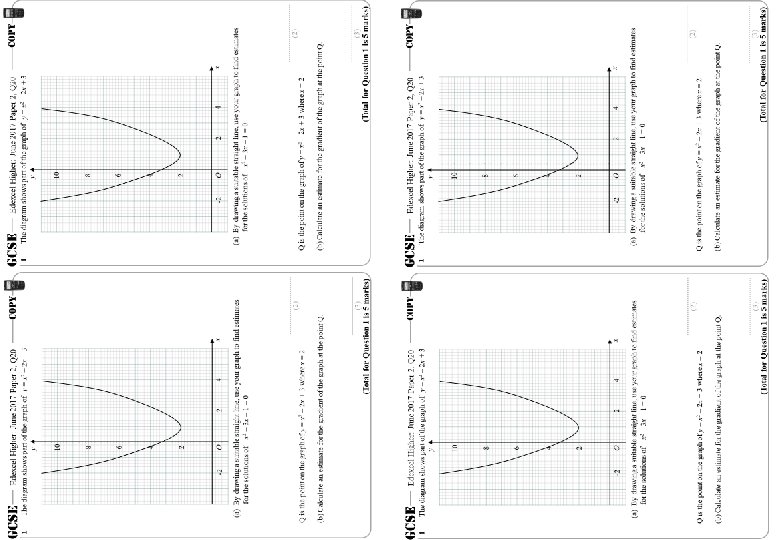
GCSE 1 GCSE Edexcel Higher: June 2017 Paper 2, Q 20 The diagram shows part of the graph of y = x 2 – 2 x + 3 y -2 1 Edexcel Higher: June 2017 Paper 2, Q 20 The diagram shows part of the graph of y = x 2 – 2 x + 3 y 10 10 8 8 6 6 4 4 2 2 O 2 4 x -2 (a) By drawing a suitable straight line, use your graph to find estimates for the solutions of x 2 – 3 x – 1 = 0 Q is the point on the graph of y = x 2 – 2 x + 3 where x = 2 (2) (b) Calculate an estimate for the gradient of the graph at the point Q. O 2 4 x (a) By drawing a suitable straight line, use your graph to find estimates for the solutions of x 2 – 3 x – 1 = 0 Q is the point on the graph of y = x 2 – 2 x + 3 where x = 2 (2) (b) Calculate an estimate for the gradient of the graph at the point Q. (3) (Total for Question 1 is 5 marks)
GCSE 1 Edexcel Higher: June 2017 Paper 2, Q 20 The diagram shows part of the graph of y = x 2 – 2 x + 3 y 10 8 6 4 2 -2 O 2 4 x (a) By drawing a suitable straight line, use your graph to find estimates for the solutions of x 2 – 3 x – 1 = 0 Q is the point on the graph of y = x 2 – 2 x + 3 where x = 2 (2) (b) Calculate an estimate for the gradient of the graph at the point Q. (3) (Total for Question 1 is 5 marks)
GCSE 1 Edexcel Higher: June 2017 Paper 2, Q 20 The diagram shows part of the graph of y = x 2 – 2 x + 3 y 10 y=x+4 8 6 4 Q 3. 6 2 -2 O 2 2 4 x (a) By drawing a suitable straight line, use your graph to find estimates for the solutions of x 2 – 3 x – 1 = 0 y = x 2 – 2 x + 3 Subtract 0 = x 2 – 3 x – 1 =y=x+4 x = -0. 2, 3. 4 Q is the point on the graph of y = x 2 – 2 x + 3 where x = 2 (2) (b) Calculate an estimate for the gradient of the graph at the point Q. (3) (Total for Question 1 is 5 marks)
Questions? Comments? Suggestions? …or have you found a mistake!? Any feedback would be appreciated . Please feel free to email: tom@goteachmaths. co. uk