Procedures in RFLP RFLP analysis can detect Point


 – Percentage of polymorphic loci,")
 – Observed heterozygosity per locus,")
 – Fixation index, Fis •")
 – Genetic similarity, I •")

- Slides: 12
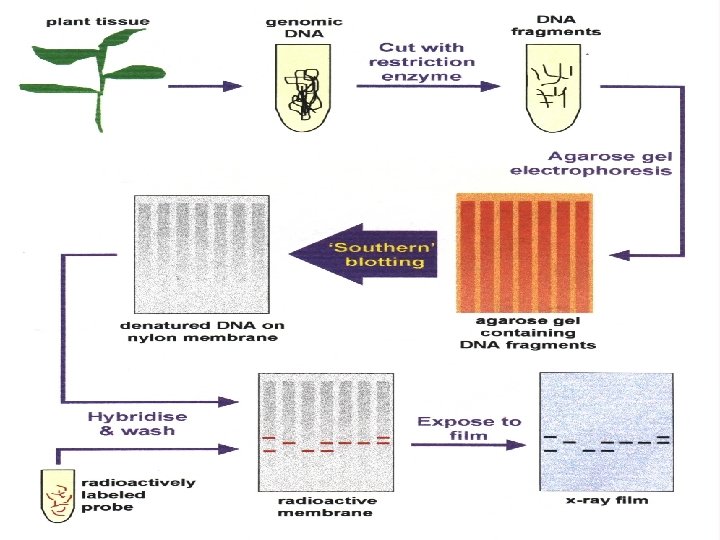
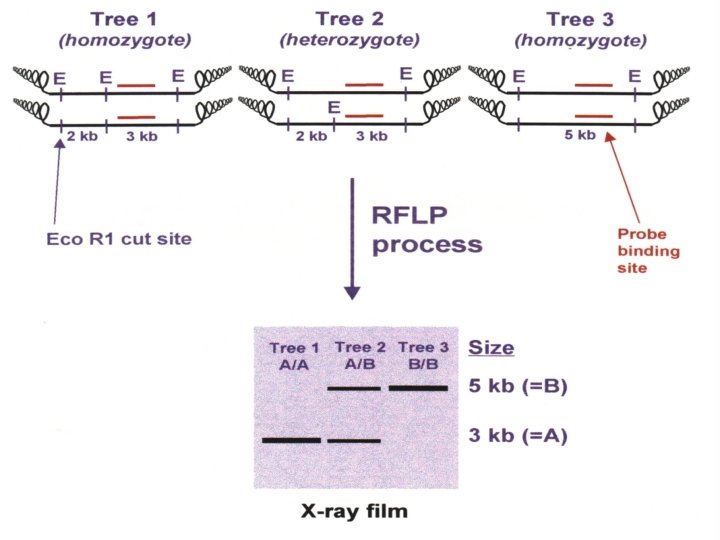
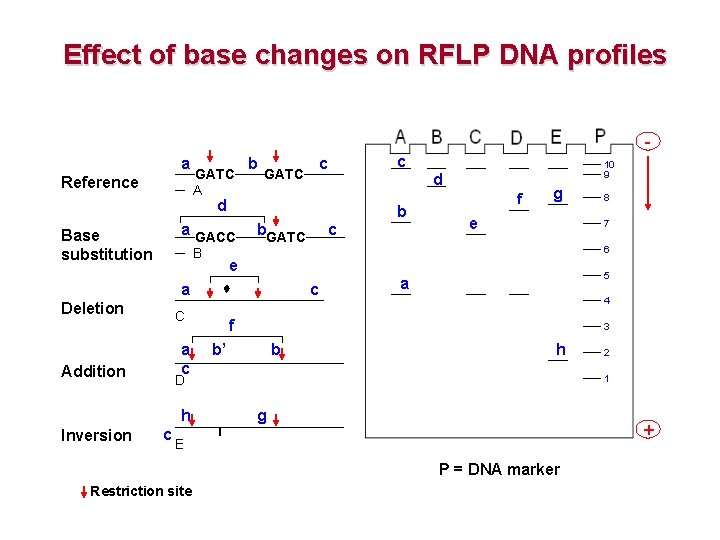
Procedures in RFLP
RFLP analysis can detect • Point mutations • Length mutations • Inversions
Limitations in RFLP • • Intensive work High cost High amount of DNA Use of radioactive
Genetic diversity parameters • Co-dominant data (isozymes, RFLPs, SSRs) – Percentage of polymorphic loci, P – Mean no. of alleles per locus, A – Effective no. of alleles per locus, Ae • Ae = 1/ i i 2 = 1/(1 - He) i is i-th allele frequency
Genetic diversity parameters • Co-dominant data (isozymes, RFLPs, SSRs) – Observed heterozygosity per locus, Ho – Expected heterozygosity per locus, He • He = (1 - i i 2 ) i is i-th allele frequency
Genetic diversity parameters • Co-dominant data (isozymes, RFLPs, SSRs) – Fixation index, Fis • Fis = 1 - Ho/He – Genetic differentiation, GST • GST = DST/HT where HT = Hs + DST HT is total gene diversity; HS is gene diversity within population; DST is gene diversity between population
Genetic diversity parameters • Co-dominant data (isozymes, RFLPs, SSRs) – Genetic similarity, I • Jxy / Jx. Jy where J = 1 - He, X = population X; Y = population Y – Genetic distance, D • D = -ln I
Genetic diversity parameters • VNTR used as probes in RFLP analysis – Percentage of polymorphic loci – Shannon diversity index, H • H = ni=1 - i ln i – Genetic similarity, F • F = 2 mxy / (mx+my) mxy is number of shared fragments by X and Y mx is number of fragments present in X my is number fragments present in Y – Genetic distance, 1 - F