Biol 3300 Objectives for Genomics Students will be

Biol 3300 Objectives for Genomics Students will be able to • describe map-based and whole genome sequencing approaches • explain how genetic and physical chromosome maps are prepared • access and use genetic information from public databases, given a particular problem in biotechnology, medicine, or biology

Lecture Outline I. III. IV. Three types of maps associated with the genome A. B. C. 1) 2) Cytogenetic mapping Banding pattern In situ hybridization—FISH and chromosome painting Linkage mapping (create a genetic map) Physical mapping Types of molecular markers A. B. C. D. E. RFLP AFLP Minisatellites and microsatellites SNPs STS A. B. Linkage mapping LOD mapping in human genetics I. III. IV. Creating a contig Examples of vectors that can take large chromosomal DNA fragments Early sequencing strategies An example of 2 nd generation sequencing-- Molecular markers can be mapped Methods of Physical mapping

")
Genomics--the study of the entire genome (not just one gene at a time)

G-banding and deletions used to map some genes/phenotypes Deleted region © Biophoto Assocates/Science Source/Photo Researchers (a) Chromosome 5 © Jeff Noneley (b) A child with cri-du-chat syndrome
")
Three types of maps associated with the Genome Cytogenetic map: sc (1 A 8) w (3 B 6) A B C D E FA 1 1 B C D 2 EF 2 A B C 3 3 Linkage map: sc w 1. 5 mu Results from each type of mapping technique may be slightly different Physical map: sc D E F A B w ~ 2. 4 x 10⁶ bp Brooker, Figure 21. 1 Copyright ©The Mc. Graw-Hill Companies, Inc. Permission required for reproduction or display 4 C
")
For cytogenetic mapping: fluorescence in situ hybridization (FISH)
 Sister chromatids Treat cells with agents")
For cytogenetic mapping: fluorescence in situ hybridization (FISH) Sister chromatids Treat cells with agents that make them swell and fixes them onto slide. Hybridized probe Denature chromosomal DNA. Denatured DNA (not in a doublehelix form) Add fluorescently labeled avidin, which binds to biotin. Add single-stranded DNA probes that have biotin incorporated into them. Fluorescent molecule bound to probe View with a fluorescence microscope. Brooker, Figure 21. 2 Copyright ©The Mc. Graw-Hill Companies, Inc. Permission required for reproduction or display
 RFLP Analysis of different individuals Individual 1")
(molecular marker for genetic and physical mapping) RFLP Analysis of different individuals Individual 1 Eco. RI 2000 bp Eco. RIEco. RI 5000 bp 1500 bp 3000 bp Eco. RI 2000 bp Eco. RI 5000 bp 1500 bp 2500 bp Eco. RI 3000 bp Eco. RI Homozygous for polymorphic Eco. R 1 site 2500 bp Individual 2 Eco. RI Homozygous for loss of Eco. R 1 site 2000 bp Eco. RI 2000 bp Brooker Fig 21. 4 5000 bp 4500 bp Eco. RI 5000 bp 2500 bp Eco. RI 4500 bp Eco. RI 2500 bp Copyright ©The Mc. Graw-Hill Companies, Inc. Permission required for reproduction or display
 RFLP Analysis, cont. Individual 3 Heterozygous for")
(molecular marker for genetic and physical mapping) RFLP Analysis, cont. Individual 3 Heterozygous for polymorphic Eco. R 1 site Eco. RI 2000 bp Eco. RI 5000 bp 1500 bp 3000 bp Eco. RI 5000 bp Eco. RI 2500 bp Eco. RI 4500 bp 2500 bp Cut the DNA from all 3 individuals with Eco. RI. (Most restriction sites are shared in the population if restriction segments are found in 99% of individuals then it is considered monomorphic. ) Separate the DNA fragments by gel electrophoresis. 1 2 3 5000 bp 4500 bp 3000 bp 2500 bp 2000 bp 1500 bp Brooker, Fig 21. 4 Copyright ©The Mc. Graw-Hill Companies, Inc. Permission required for reproduction or display Polymorphic bands indicated at arrows.
 Southern Blot only shows the polymorphic band")
(molecular marker for genetic and physical mapping) Southern Blot only shows the polymorphic band Probe must bind to a polymorphic site Figure not in Brooker
 SNP variation—Single Nucleotide Polymorphisms www. hapmap. org")
(molecular marker for genetic and physical mapping) SNP variation—Single Nucleotide Polymorphisms www. hapmap. org
 Microsatellites (or Short Tandem Repeats--STR) CA =")
(molecular marker for genetic and physical mapping) Microsatellites (or Short Tandem Repeats--STR) CA = (CA)1 2 bp repeat CACACA = (CA)5 CACACACACACACA = (CA)14 TTTTC = (TTTTC)1 5 bp repeat TTTTCTTTTC = (TTTTC)3 TTTTCTTTTCTTTTC = (TTTTC)5
1")
The same forward and reverse primers PCRamplify different allele lengths for a microsatellite (CA)1 allele 5’GGGAAA 3’ 5’-…gggaaacctg. CAtcgtgccagctg…-3’ 3’GTCGAC 5’ 5’GGGAAA 3’ (CA)5 allele 5’-…gggaaacctg. CACACAtcgtgccagctg…-3” 3’GTCGAC 5’ 5’GGGAAA 3’ (CA)8 allele 5’-…cgggaaacctg. CACACACAtcgtgccagctg…-3’ 3’GTCGAC 5’
 Set of chromosomes PCR of microsatellites Add")
(molecular marker for genetic and physical mapping) Set of chromosomes PCR of microsatellites Add PCR primers specific to polymorphic chromosome 2 STR 2 2 Many cycles of PCR produce a large amount of DNA fragment between the 2 primers. Brooker, Fig 21. 5 (CA)10 allele (CA)5 allele Gel electrophoresis
 Parents Sue Henry Offspring")
Electrophoretic gel of polymorphic microsatellite found in family (PCR amplified) Parents Sue Henry Offspring Fragment length (bp) Sue Brooker, Fig 20. 12 Henry Mary Joelle Hank 154 150 146 140 Copyright ©The Mc. Graw-Hill Companies, Inc. Permission required for reproduction or display
 can be mapped 16 recombinants/100 total offspring 16 mu Figure")
RFLPs (and other markers) can be mapped 16 recombinants/100 total offspring 16 mu Figure not in Brooker

Using markers to map BRCA 2 gene in humans Fig from Wooster et al. , 1995

In human genetics, computer algorithms are used to determine linkage The likelihood of linkage between two markers is determined by the lod (logarithm of the odds) score method – Computer programs analyze pooled data from a large number of pedigrees or crosses involving many markers – They determine probabilities that are used to calculate the lod score Probability of a certain degree of linkage Probability of independent assortment • lod score = log 10 Copyright ©The Mc. Graw-Hill Companies, Inc. Permission required for reproduction or display

Physical Mapping A B C D E F GH I J K L M NO P Q R Clone individual chromosome pieces into vectors A B C 1 D GH F 3 J I 5 NO M K 7 P 9 Vector B C 2 D E 4 F I GH 6 K L 8 M P Q R 10 Numbers denote chromosome order of clones Booker, fig 21. 7 Copyright ©The Mc. Graw-Hill Companies, Inc. Permission required for reproduction or display Collection of ordered, overlapping clones (contig)

Examples of different types of vectors and host organisms Genome of Interest Human genome Worm (nematode) genome Firefly genome Drosophila genome Host Organism Vector Size of Insert Yeast YAC (Yeast 100 - 2000 kb Artificial Chromosome) Bacteria Cosmid < 45 kb Virus l phage < 20 kb Bacteria Plasmid < 15 kb
 Eco. RI site CEN (yeast centromere) Chromosomal DNA Yeast")
ARS (yeast origin of replication) Eco. RI site CEN (yeast centromere) Chromosomal DNA Yeast Artificial Chromosomes ORI (E. coli origin of replication) Selectable marker gene TEL Bam. HI site Cut with Eco. RI and Bam. HI. TEL Bam. HI (yeast telomere) site Each arm has a different selectable marker. Therefore, it is possible to select for yeast cells with YACs that have both arms Left arm Right arm Fragment not needed in yeast Selectable Marker gene Cut (occasionally) with low concentration of Eco. RI to yield very large fragments. + + Mix and add DNA ligase. TEL Selectable marker gene Brooker, Fig 21. 9 ORI CEN ARS Large piece of chromosomal DNA Note: not drawn to scale. Chromosomal DNA is much larger than the YAC vector. Yeast artificial chromosome (YAC) Selectable TEL marker gene

Copyright © The Mc. Graw-Hill Companies, Inc. Permission required for reproduction or display. lac. Z cm R Hind. III Bam. HI Sph. I par. C par. B Bacterial Artificial Chromosome rep. E par. A ori. S

C A B D C 1 E K D GH F 3 J I 5 L M NO M K Which clones will the green probe detect? The red probe? 7 P 9 Vector B C 2 D E 4 F I GH 6 K L 8 M P Q R 10 Copyright ©The Mc. Graw-Hill Companies, Inc. Permission required for reproduction or display

C A B D C 1 E K D GH F 3 J I 5 L M NO M K Which clones will the green probe detect? The red probe? 7 P 9 Vector B C 2 D E 4 F I GH 6 K L 8 M P Q R 10 Copyright ©The Mc. Graw-Hill Companies, Inc. Permission required for reproduction or display

Linking the genetic map to physical map Region of chromosome 11 Gene A Gene B 1. 5 mu Gene A 1 2 Gene B 3 4 5 6 7 • Genes A and B mapped previously to specific regions of chromosome 11 – Gene A was found in the insert of clone #2 – Gene B was found in the insert of clone #7 • So Genes A and B can be used as reference points to align the members of the contig Figure 21. 8 Copyright ©The Mc. Graw-Hill Companies, Inc. Permission required for reproduction or display

Gene B Gene A 1 Gene B 2 3 4 5. . n Numbers indicate regions that are subcloned. (Starting clone) Cosmid vector The number of steps required to reach the gene of interest depends on the distance between the start and end points Subclone*. (with radiolabeled nucleotides) Screen a library. 1 2 (Second clone) Subclone*. 2 Screen a library. 2 3 (Third clone) n Figure 20. 18 Repeat subcloning and screening until gene A is reached. Gene A Copyright © The Mc. Graw-Hill Companies, Inc. Permission required for reproduction or displ

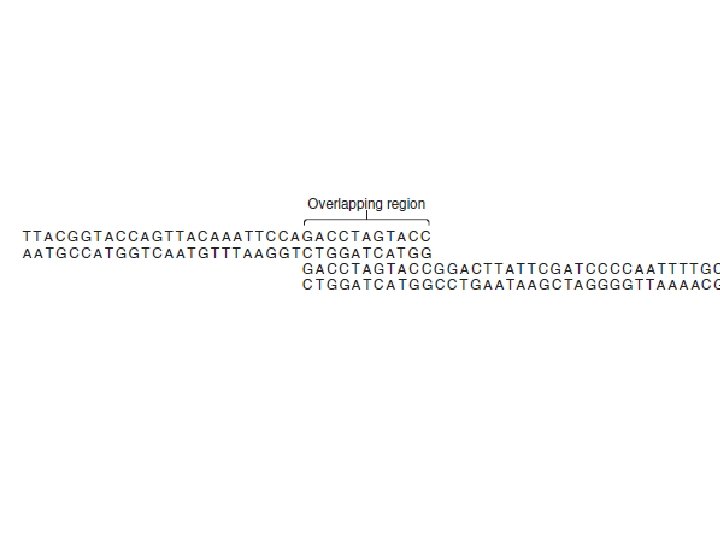
Isolate chromosomal DNA BAC contig Clone large chromosomal DNA fragments into BACs and create a contig for each chromosome. BAC vector Chromosomal DNA For each BAC, shear into smaller pieces and clone DNA pieces into vectors. Shear DNA into small and large pieces. Clone chromosomal DNA pieces into vectors. Vector Chromosomal DNA Vector Clones from one BAC insert: Chromosomal DNA From the clones of each BAC, determine the chromosomal DNA sequence, usually at one end, by shotgun sequencing. The results below show the sequences from three chromosomal DNA CCGACCTTACCGACCACCCGATTAAT clones. TTAATCGCGAATTG Based on overlapping regions, create one contiguous sequence. CCGACCTTACCGACCACCCGATTAATCGCGAATTG (a) Hierarchical genome shotgun sequencing Brooker, Fig 21. 14 Determine the chromosomal DNA sequence, usually at both ends, by shotgun sequencing. The results below show sequences of three chromosomal DNA clones. T T ACCGGT AGGCACCT GT T ACGGGT CAAACCT AGG Based on overlapping regions, create one contiguous sequence. T T ACC GGT AGGCACCT GT T ACGGGT CAAACCT AGG (b) Whole-genome shotgun sequencing

Isolate genomic DNA and break into fragments. Fragment of genomic DNA Deposit the beads into a picotiter plate. Only one bead can fit into each well. Covalently attach oligonucleotide adaptors to the 5′ and 3′ ends of the DNA. Adaptors Denature the DNA into single strands and attach to beads via the adaptors. Note: Only one DNA strand is attached to a bead. Add sequencing reagents: DNA polymerase, primers, ATP sulfurylase, luciferase, apyrase, adenosine 5′ phosulfate, and luciferin. Sequentially flow solutions containing A, T, G, or C into the wells. In the example below, T has been added to the wells. PPi (pyrophosphate) is released when T is incorporated into the growing strand. T T C AT GCA Primer Adenosine 5′ PPi+ phosulfate ATP sulfurylase ATP + luciferin Luciferase Emulsify the beads so there is only one bead per droplet. The droplets also contain PCR reagents that amplify the DNA. Brooker, Fig 21. 15 Light is detected by a camera in the sequencing machine. Copyright © The Mc. Graw-Hill Companies, Inc. Permission required for reproduction or display.

Chromosome 16 95 million bp Linkage map D 16 S 144 D 16 S 40 D 16 S 160 22. 1 22. 2 22. 3 23. 1 23. 2 23. 3 24. 1 24. 2 24. 3 21. 0 12. 2 13. 0 D 16 AC 6. 5 12. 1 n 50 (resolution of in situ hybridization 3– 5 megabases) (resolution 3– 5 c. M; not all linkage markers are shown) * sio pan x es e 0 tim * D 16 S 150 D 16 S 149 11. 2 11. 1 D 16 S 48 11. 2 13. 13 13. 12 13. 11 D 16 S 159 12. 3 12. 2 12. 1 13. 2 D 16 S 85 Cytogenetic map q D 16 S 60 Low resolution (3– 5 million bp) Linking all the maps p YAC N 16 Y 1 150, 000 bp * 310 C 4 N 16 Y 1 -29 = (GT)n Physical map of N 16 Y 1 -18 N 16 Y 1 -13 N 16 Y 1 -14 N 16 Y 1 -12 N 16 Y 1 -16 overlapping cosmid clones (resolution 5– 10 kilobases) N 16 Y 1 -30 High resolution (1– 100, 000 bp) Cosmid contig 211 5 F 3 312 F 1 309 G 11 N 16 Y 1 -19 N 16 Y 1 -10 * STS N 16 Y 1 -10 Primer 3′ 5′ 3′ AGTCAAACGTTTCCGGCCTA 5′ GATCAAGGCGTTACATGA TCAGTTTGCAAAGGCCGGAT 3′ CTAGTTCCGCAATGTACT AGTCAAACGTTTCCGGCCTA 5′ 5′— GATCAAGGCGTTACATGA — 3′ Sequence-tagged site (resolution 1 base) Primer 219 bp Brooker, Fig 21. 11 Copyright © The Mc. Graw-Hill Companies, Inc. Permission required for reproduction or display.
- Slides: 31