Preparation for the Performance Assessment Data Driven Decision


- Slides: 21
Preparation for the Performance Assessment Data Driven Decision Making ver. 20 -May-16
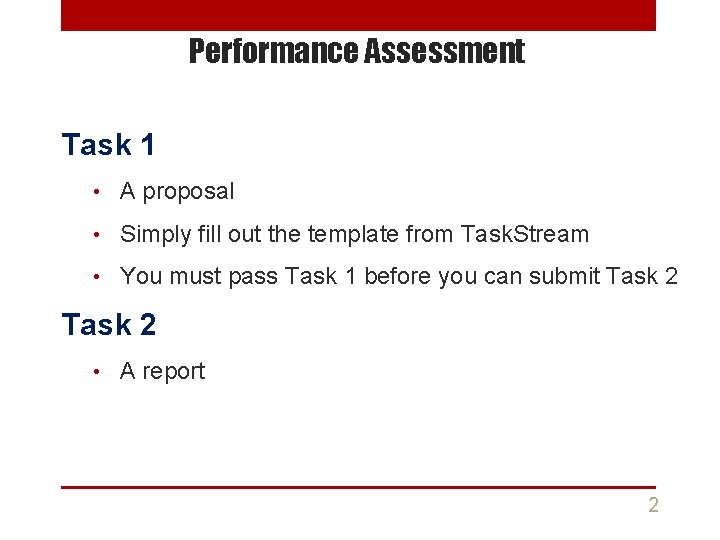
Performance Assessment Task 1 • A proposal • Simply fill out the template from Task. Stream • You must pass Task 1 before you can submit Task 2 • A report 2
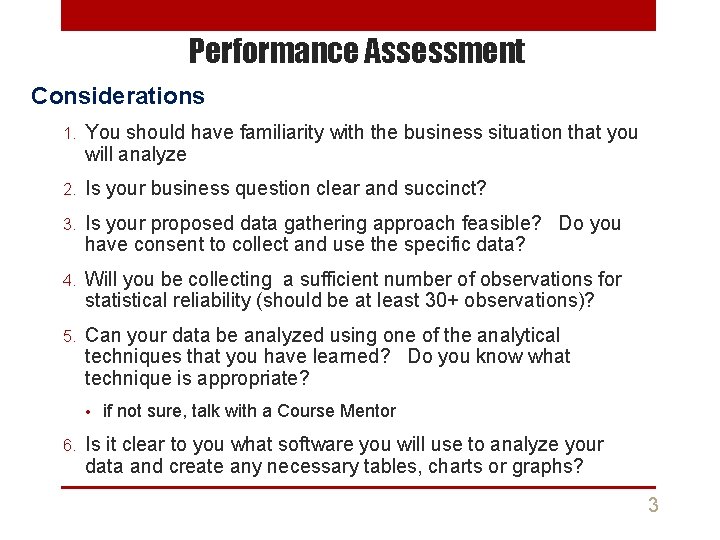
Performance Assessment Considerations 1. You should have familiarity with the business situation that you will analyze 2. Is your business question clear and succinct? 3. Is your proposed data gathering approach feasible? Do you have consent to collect and use the specific data? 4. Will you be collecting a sufficient number of observations for statistical reliability (should be at least 30+ observations)? 5. Can your data be analyzed using one of the analytical techniques that you have learned? Do you know what technique is appropriate? • 6. if not sure, talk with a Course Mentor Is it clear to you what software you will use to analyze your data and create any necessary tables, charts or graphs? 3
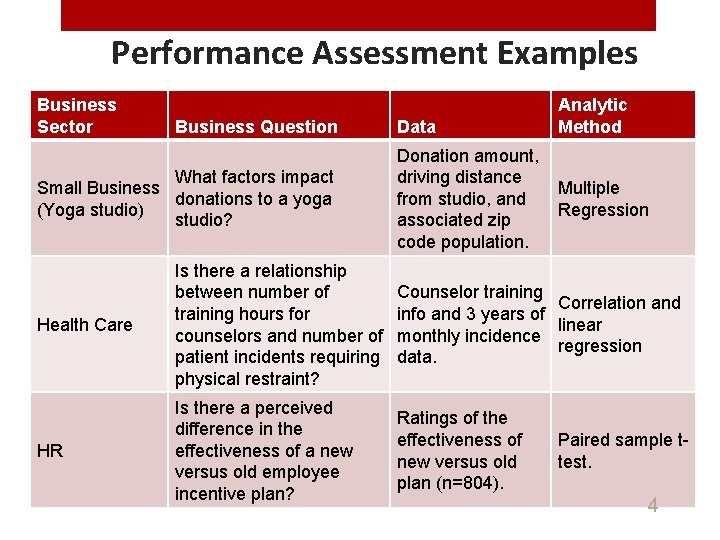
Performance Assessment Examples Business Sector Business Question What factors impact Small Business donations to a yoga (Yoga studio) studio? Data Donation amount, driving distance from studio, and associated zip code population. Analytic Method Multiple Regression Health Care Is there a relationship between number of training hours for counselors and number of patient incidents requiring physical restraint? Counselor training Correlation and info and 3 years of linear monthly incidence regression data. HR Is there a perceived difference in the effectiveness of a new versus old employee incentive plan? Ratings of the effectiveness of new versus old plan (n=804). Paired sample ttest. 4
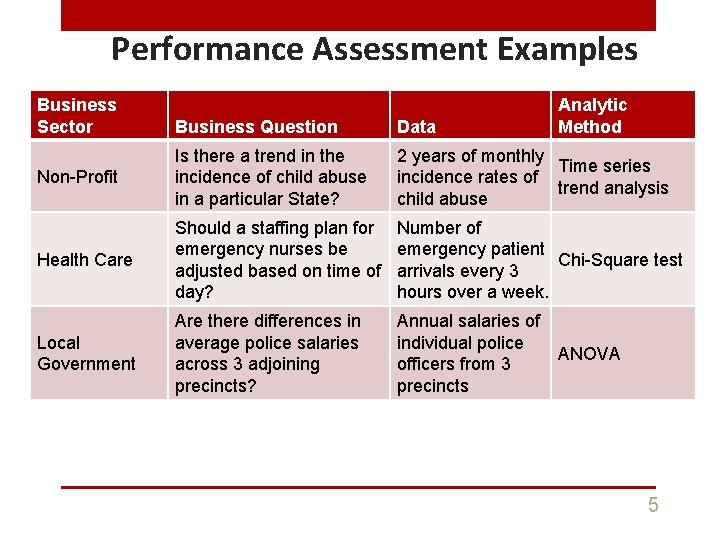
Performance Assessment Examples Business Sector Analytic Method Business Question Data Non-Profit Is there a trend in the incidence of child abuse in a particular State? 2 years of monthly Time series incidence rates of trend analysis child abuse Health Care Should a staffing plan for emergency nurses be adjusted based on time of day? Number of emergency patient Chi-Square test arrivals every 3 hours over a week. Local Government Are there differences in average police salaries across 3 adjoining precincts? Annual salaries of individual police officers from 3 precincts ANOVA 5
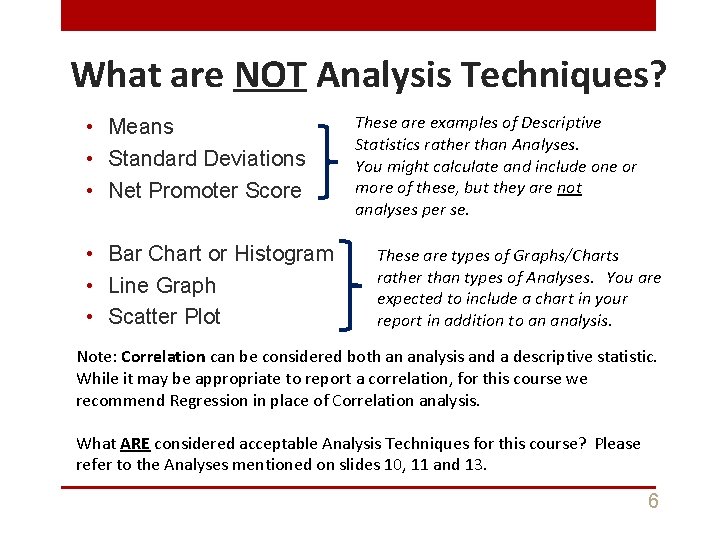
What are NOT Analysis Techniques? • Means • Standard Deviations • Net Promoter Score • Bar Chart or Histogram • Line Graph • Scatter Plot These are examples of Descriptive Statistics rather than Analyses. You might calculate and include one or more of these, but they are not analyses per se. These are types of Graphs/Charts rather than types of Analyses. You are expected to include a chart in your report in addition to an analysis. Note: Correlation can be considered both an analysis and a descriptive statistic. While it may be appropriate to report a correlation, for this course we recommend Regression in place of Correlation analysis. What ARE considered acceptable Analysis Techniques for this course? Please refer to the Analyses mentioned on slides 10, 11 and 13. 6
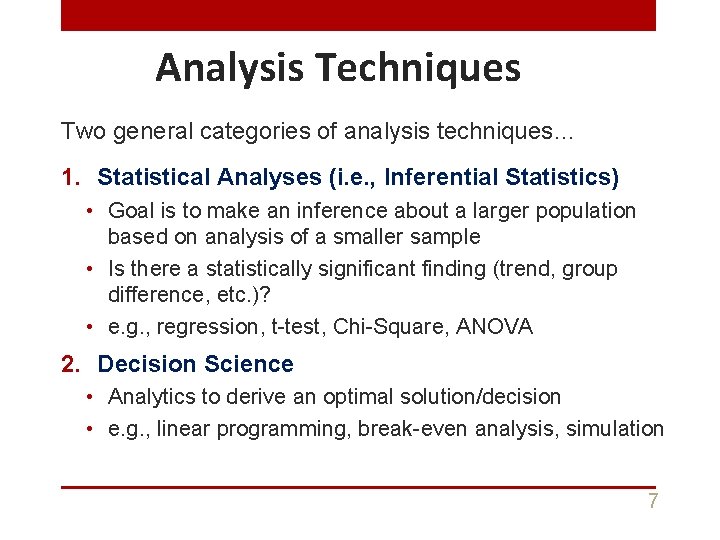
Analysis Techniques Two general categories of analysis techniques… 1. Statistical Analyses (i. e. , Inferential Statistics) • Goal is to make an inference about a larger population based on analysis of a smaller sample • Is there a statistically significant finding (trend, group difference, etc. )? • e. g. , regression, t-test, Chi-Square, ANOVA 2. Decision Science • Analytics to derive an optimal solution/decision • e. g. , linear programming, break-even analysis, simulation 7
Analysis Techniques 1. Statistical Analyses 2. Decision Science 8
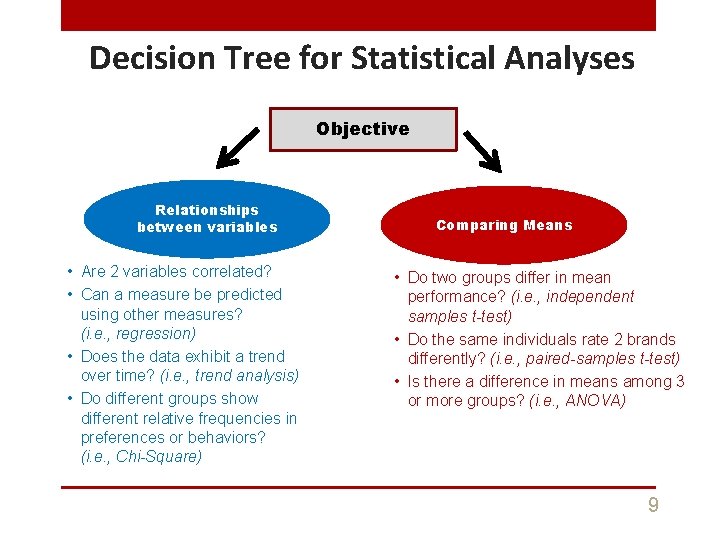
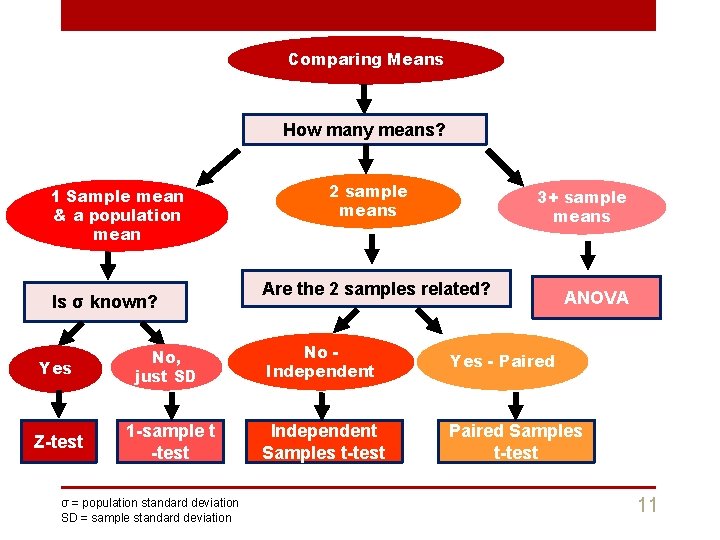
Decision Tree for Statistical Analyses Objective Relationships between variables • Are 2 variables correlated? • Can a measure be predicted using other measures? (i. e. , regression) • Does the data exhibit a trend over time? (i. e. , trend analysis) • Do different groups show different relative frequencies in preferences or behaviors? (i. e. , Chi-Square) Comparing Means • Do two groups differ in mean performance? (i. e. , independent samples t-test) • Do the same individuals rate 2 brands differently? (i. e. , paired-samples t-test) • Is there a difference in means among 3 or more groups? (i. e. , ANOVA) 9
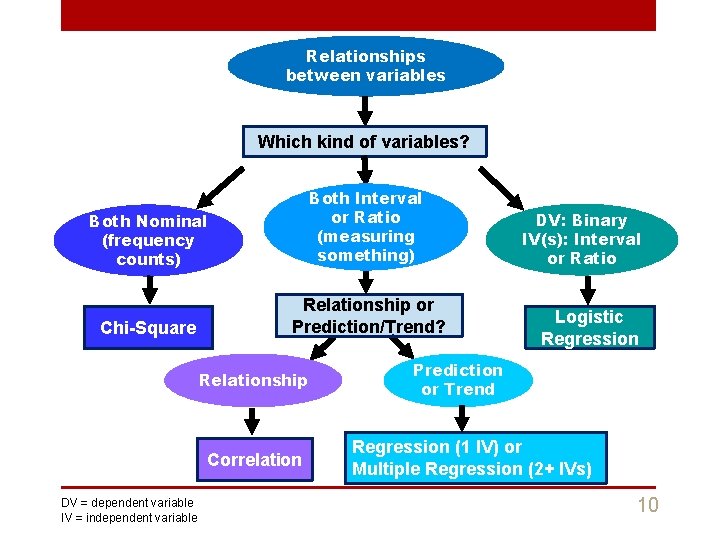
Relationships between variables Which kind of variables? Both Nominal (frequency counts) Both Interval or Ratio (measuring something) Chi-Square Relationship or Prediction/Trend? Relationship Correlation DV = dependent variable IV = independent variable DV: Binary IV(s): Interval or Ratio Logistic Regression Prediction or Trend Regression (1 IV) or Multiple Regression (2+ IVs) 10
Comparing Means How many means? 1 Sample mean & a population mean Is σ known? 2 sample means 3+ sample means Are the 2 samples related? ANOVA Yes No, just SD No Independent Yes - Paired Z-test 1 -sample t -test Independent Samples t-test Paired Samples t-test σ = population standard deviation SD = sample standard deviation 11
Analysis Techniques 1. Statistical Analyses 2. Decision Science 12
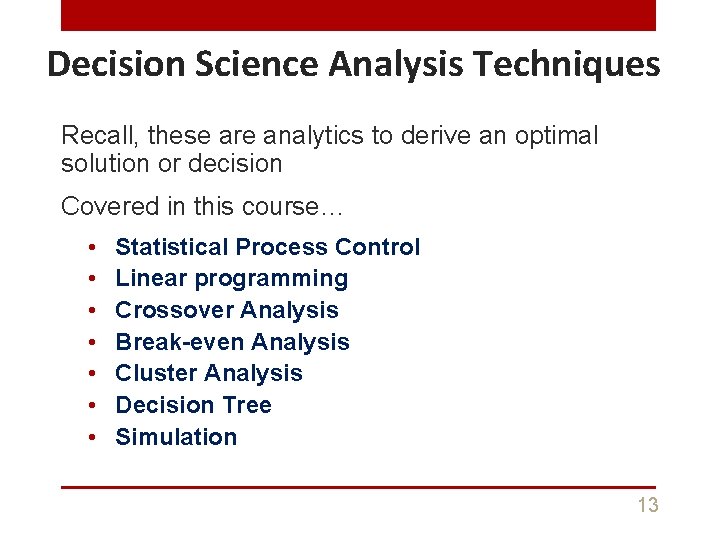
Decision Science Analysis Techniques Recall, these are analytics to derive an optimal solution or decision Covered in this course… • • Statistical Process Control Linear programming Crossover Analysis Break-even Analysis Cluster Analysis Decision Tree Simulation 13
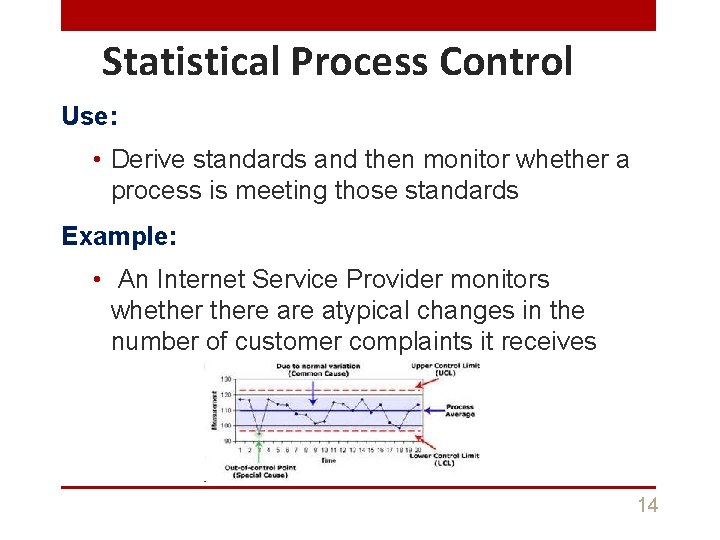
Statistical Process Control Use: • Derive standards and then monitor whether a process is meeting those standards Example: • An Internet Service Provider monitors whethere atypical changes in the number of customer complaints it receives 14
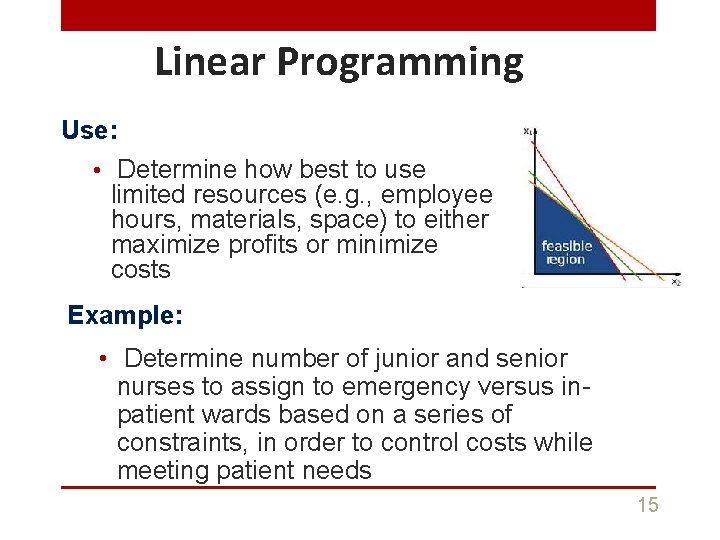
Linear Programming Use: • Determine how best to use limited resources (e. g. , employee hours, materials, space) to either maximize profits or minimize costs Example: • Determine number of junior and senior nurses to assign to emergency versus inpatient wards based on a series of constraints, in order to control costs while meeting patient needs 15
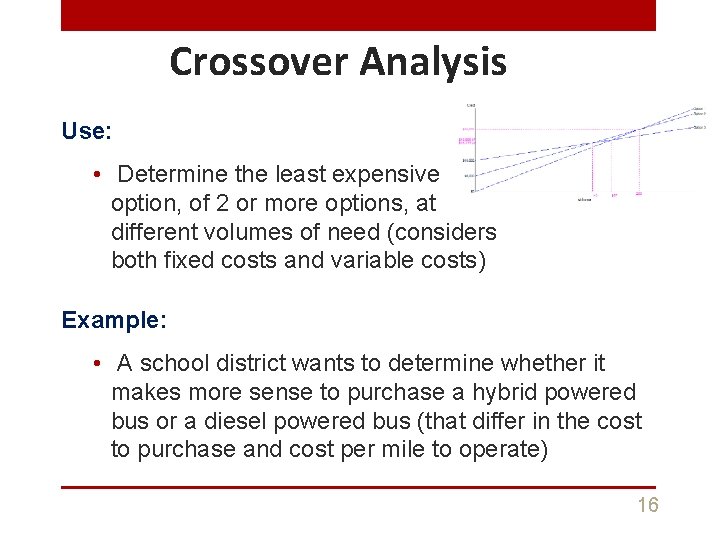
Crossover Analysis Use: • Determine the least expensive option, of 2 or more options, at different volumes of need (considers both fixed costs and variable costs) Example: • A school district wants to determine whether it makes more sense to purchase a hybrid powered bus or a diesel powered bus (that differ in the cost to purchase and cost per mile to operate) 16
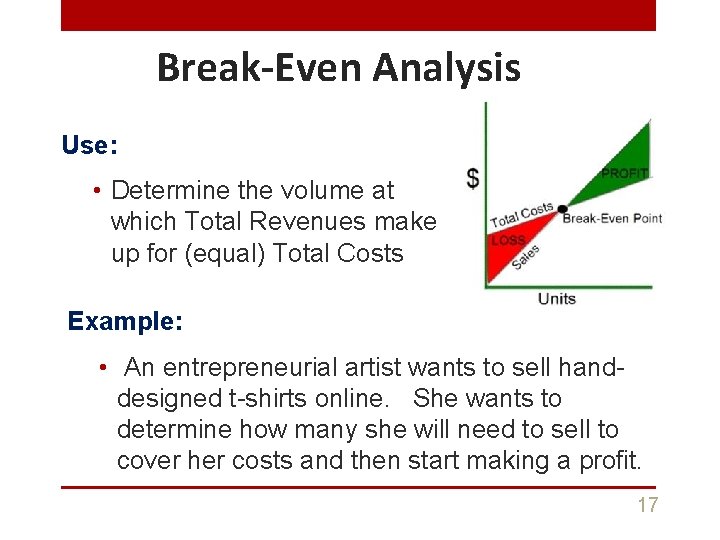
Break-Even Analysis Use: • Determine the volume at which Total Revenues make up for (equal) Total Costs Example: • An entrepreneurial artist wants to sell handdesigned t-shirts online. She wants to determine how many she will need to sell to cover her costs and then start making a profit. 17
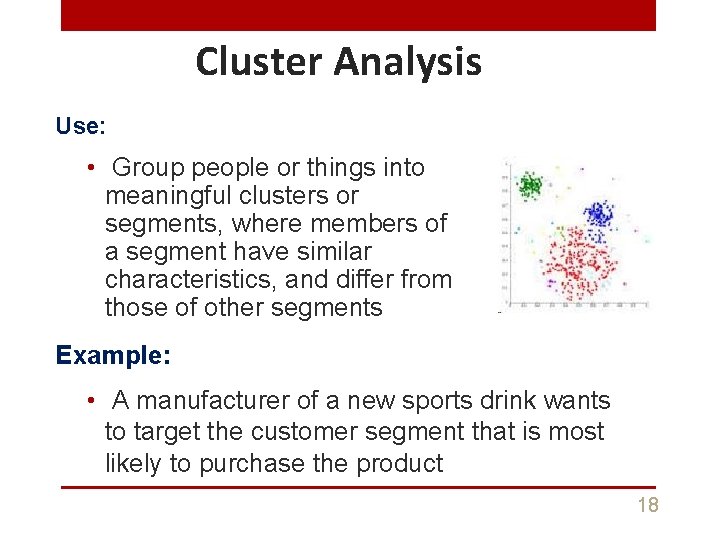
Cluster Analysis Use: • Group people or things into meaningful clusters or segments, where members of a segment have similar characteristics, and differ from those of other segments Example: • A manufacturer of a new sports drink wants to target the customer segment that is most likely to purchase the product 18
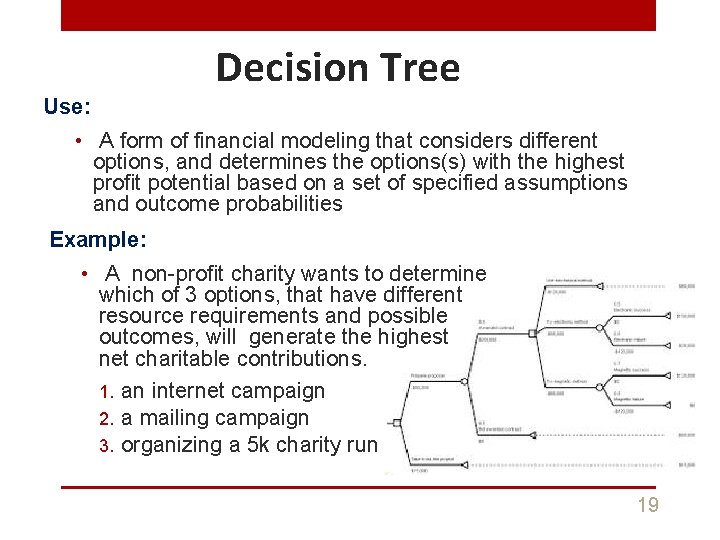
Decision Tree Use: • A form of financial modeling that considers different options, and determines the options(s) with the highest profit potential based on a set of specified assumptions and outcome probabilities Example: • A non-profit charity wants to determine which of 3 options, that have different resource requirements and possible outcomes, will generate the highest net charitable contributions. 1. an internet campaign 2. a mailing campaign 3. organizing a 5 k charity run 19
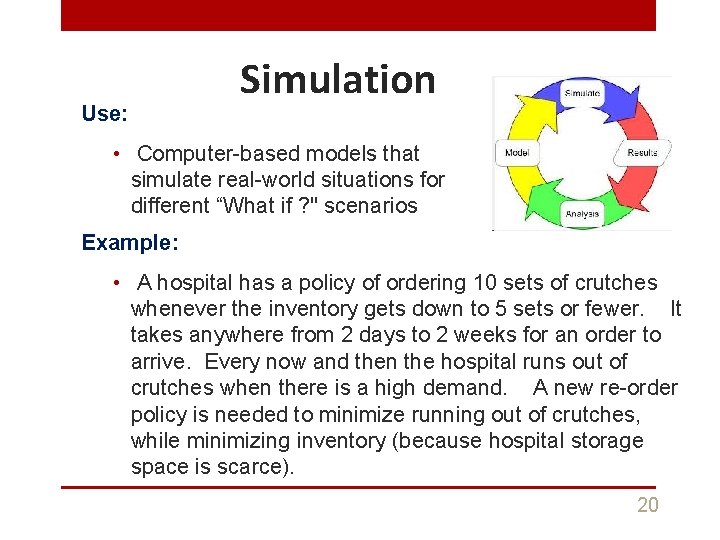
Use: Simulation • Computer-based models that simulate real-world situations for different “What if ? " scenarios Example: • A hospital has a policy of ordering 10 sets of crutches whenever the inventory gets down to 5 sets or fewer. It takes anywhere from 2 days to 2 weeks for an order to arrive. Every now and then the hospital runs out of crutches when there is a high demand. A new re-order policy is needed to minimize running out of crutches, while minimizing inventory (because hospital storage space is scarce). 20
Remember that Course Mentors are available to help you if you should have any questions about your chosen business situation, type of data that you will collect, and/or the type of analysis that you should use. • e-mail us at MBAQuant@WGU. edu • make an appointment https: //wgu-c 207. youcanbook. me 21