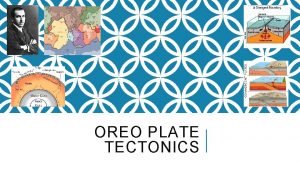
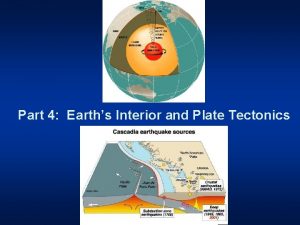
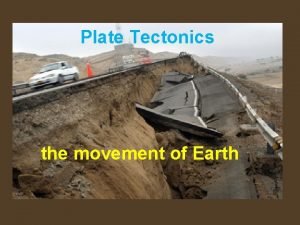
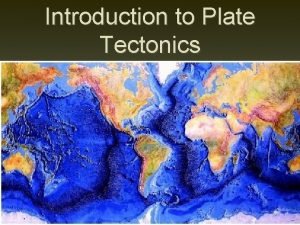
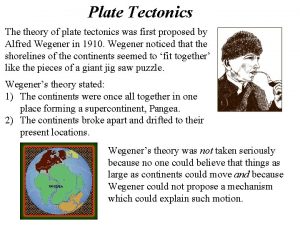
Part 4 Earths Interior and Plate Tectonics Whats


- Slides: 59

Part 4: Earth’s Interior and Plate Tectonics

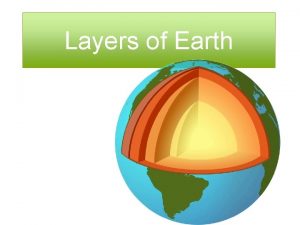
What’s Inside the Earth? Direct methods: • drill cores • volcanic xenoliths • large uplifts along faults Indirect methods: • average density (heft) • shape • magnetic field • seismology (using Earthquakes)

Drill Cores • Deepest drill hole is 12. 3 km (7. 6 miles) deep. This is about 0. 2% the distance to the center of the Earth (diameter 12742 km). • The topmost part of the continents is made up of a variety of lightcolored, low density rocks. • The upper part of the ocean floor is made up of a dark-colored rock known as basalt.

Crust and Mantle Rocks Left to right: Gneiss and Granite are both lightcolored, low-density, “granitic”-composition rocks of the continental crust. Basalt is the dark-colored rock that makes up the ocean crust. Greenishcolored Peridotite is a denser rock and comes from the upper mantle (Earth layer below the crust)

Xenoliths and Faults Top left: Hawaiian basalt (dark rock solidified from lava) containing a xenolith (strange stone) composed of peridotite. Xenoliths sample down to about 400 km (out of a radius of 6371 km) Bottom left: contact between rocks of the ocean floor (diabase dike) and denser rocks from below the ocean crust (peridotite). Rocks have been uplifted many 10 s of kms.

Average Density (Heft) • average density of Earth = 5. 51 g/cm 3 (so a 1 cm 3 piece of “average Earth” weighs 5. 51 grams. • the rocks that we have from the Earth’s surface, deep drill cores, xenoliths, etc. are all <= 3. 5 g/cm 3. • there must be some denser material deep inside the Earth • based on meteorites and seismic data, this should be metallic iron • Earth about 2/3 rock and 1/3 metallic iron

Shape and Magnetic Field • The shape of the Earth is oblate (bulges at the equator) rather than a perfect sphere. This requires a “soft” interior (a solid that can flow plastically). • The earth generates a substantial magnetic field. This requires a “conducting” liquid in the planet’s interior. • In the Earth’s case, the conducting liquid is liquid metallic iron.

P and S wave velocities • P and S wave velocities depend on density of material through which wave passes. • If the Earth’s interior was a single constant density, seismic waves would travel in straight lines from focus to seismometer. • We observe that seismic waves travel in curved paths, indicating density is changing gradually with depth over the region where direct P and S waves are recorded, which would be expected for a single material that compresses (becomes denser) depth.

Seismic Wave Paths • a curved path indicates a single material, which compress, becoming gradually denser with depth. • where material changes abruptly from one density to another, there is a corresponding abrupt change in seismic velocities, and P and S waves reflect and refract. • the boundary between the two layers is called a seismic discontinuity

Shadow Zones Direct P waves PKP waves • one of the earliest discoveries in the field of seismology was of a major seismic discontinuity 2900 km below the surface, indicating that the planet had a core with significantly different physical and chemical properties from the rocks above the discontinuity. • P waves are refracted so that there is a “shadow zone” where seismographs don’t pick up either direct P waves or the refracted PKP waves. • following shortly was the discovery that S waves did not travel through the core. This indicated that the core was liquid, rather than solid.

Major Seismic Discontinuities Three major seismic discontinuities have been identified: • the Moho is the boundary between the low-density rocks of the crust and the denser rocks of the mantle • the core-mantle boundary separates the rocks of the mantle from the liquid metal in the outer core. • the third is the boundary between the inner solid metal core and the outer core

Seismic Velocity and Density We can model density of material inside the Earth. Find that inner core, outer core, and lower part of mantle have gradual density increases indicating a roughly uniform composition material being compressed (solid metal, liquid metal, and dense rock).

Complexity in the Upper Mantle Immediately beneath the MOHO (boundary with crust), seismic velocities increase as expected for solid, brittle peridotite being compressed. This layer, along with the crust above it is referred to as the lithosphere (the rocky sphere). The rocks of the lithosphere are brittle because they are much colder than their melting temperatures.

Complexity in the Upper Mantle Roughly 100 km down, seismic velocities start to decrease because of the presence of small amounts of molten rock, causing this layer to be soft and malleable. Velocities reach a minimum, and then gradually return to their prior values at about 300 km depth. This layer of the Earth is known as the low velocity zone, an also the asthenosphere (weak sphere). The rocks of the asthenosphere are the same composition as the lower part of the lithosphere, but the asthenospheric mantle is much closer to its melting temperature.

Complexity in the Upper Mantle The mantle beneath the asthenosphere is a rigid plastic solid and is called the mesosphere (middle sphere). There is a transition zone containing a couple of small seismic discontinuities in the upper part of the mesosphere caused by changes in mineral structure in the rocks of the mantle.

Defining Earth’s Layers

Geothermal Gradient • Seismic velocity data coupled with laboratory data on the densities of rock and metal as a function of pressure and temperature allow scientists to model the pressure and temperature in the Earth as a function of depth (the geothermal gradient, or geotherm). • Temperature increases with depth to approximately 6000 C at the center.

Heat Transport: Conduction • Interior of Earth is about 6000 C, surface is about 16 C • Must have heat transport – two options for solids • Conduction: atom by atom transport of heat in the form of atomic vibration • Rock is a very poor conductor • Only way to transmit heat through a brittle solid

Heat Transport: Convection • Convection can occur in plastic or ductile solids, liquids, and gases, but not brittle solids. • Heat causes expansion of material, which becomes less dense than its surroundings, and therefore buoyant. The less dense material flows upward into cooler surroundings. The hot material cools and contracts, becoming denser, and then sinks. So, hot stuff rises, cold stuff sinks. • There are two ways for ductile rock to convect: large rolling convection currents (where the rock makes a big loop, similar to the liquid in the image to the right), or narrow columns of rising rock known as plumes that reflect thermal jostling. Do we see any evidence for either convection currents or plumes by looking at the surface of the Earth? YES

Earth’s Surface Motion GPS measurements of the various movements of the Earth’s surface suggest that there are large rolling convection currents beneath the surface. But the surface rocks (lithosphere = crust plus upper mantle) are brittle and can’t flow.

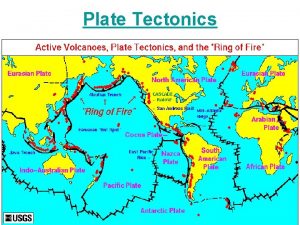
Global Seismicity • Global distribution of earthquakes shows that most are located where surface motions change direction abruptly. • Indicate that the rigid lithosphere is broken at places where rolling convection currents are causing stress (tension, compression, shear)

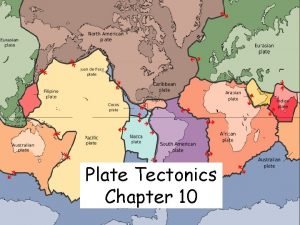
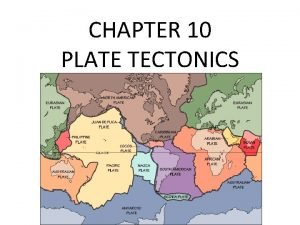
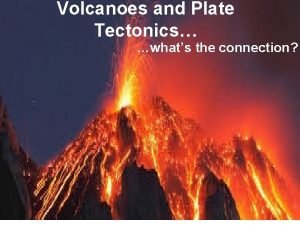
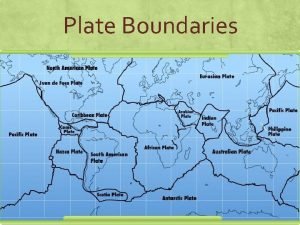
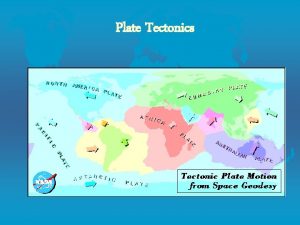
Plate Tectonics Basic Ideas: • Earth’s surface broken into pieces, called plates • Each lithospheric plate has crustal rocks on top, and brittle mantle rocks on bottom • Each plate moves relative to every other plate at a rate of a few cm per year. • Geological activity (earthquakes, volcanoes, mountain formation) is concentrated at plate boundaries (the place where two plates are in contact).

Plates Float on Asthenosphere The concept of isostasy. Blocks of different density placed in a fluid will sink until they are “buoyed up” by the surrounding fluid pressure, such that the pressure is constant at any depth in the fluid. Isostatic compensation surface (constant pressure)

Mantle Convection • It is clear that the entire Earth’s mantle transports heat mainly by rolling convection currents. • It is not clear whether different regions in the mantle have individual convective layers. • Most scientists think that reality is a comple hybrid between the two models shown at left, with the option of additional small local currents in the asthenosphere.

Rising Convection Currents • Rising convection currents create tension in the lithosphere. • The lithosphere breaks, with pieces dropping along normal faults to create a rift valley (also called a graben). • The center of the rift valley marks the plate boundary. • The two plates on either side of the boundary diverge (move away from each other). • Hot rock from the asthenosphere moves upward and melts producing magma. • Magma erupts in the rift valley. • Repetition of this process creates new ocean floor.

Divergent Plate Boundary Left to right and top to bottom: A single plate breaks to form two plates, which spread apart to create a rift valley which eventually widens into a new ocean basin. http: //www. wwnorton. com/college/geo/egeo 2/content/animations/2_7. htm

Mid-Ocean Ridge • Once an ocean basin forms, the top of a mid-ocean ridge is at the plate boundary. • Reminder – the mantle part of the lithosphere differs from asthenosphere only in being much colder. • At the ridge, the mantle rocks are hot. The lithosphere is almost entirely just ocean crust. • As the plate moves away from the ridge, the mantle just below the crust cools, and becomes brittle, so becomes part of the lithosphere. • The lithosphere as a whole is now thicker and denser and sinks further into the asthenosphere.

Young Divergent Boundary • Initial upwelling causes spherical bulge in continental crust, which breaks at three points creating triple junction. • See this today where Arabia has separated from Africa, and Africa is splitting along East African Rift Valley Left: Purple regions in Red Sea and Gulf of Aden are new ocean crust

Mature Divergent Boundary Mid-Atlantic Ridge: A graben at the top of the ridge marks the actual plate boundary.

Age of Ocean Crust

Divergent Boundary - Summary • Area of rising mantle convection current creates tension • Breaks one plate into two separate plates • Shallow earthquakes occur along normal faults • Plate boundary marked initially by rift valley (graben) • Plate boundary marked by mid-ocean ridge • New ocean floor created at center of mid-ocean ridge

Sinking Convection Currents • Sinking convection currents create compression in the lithosphere. • The lithosphere folds and breaks, with sections rising along thrust and reverse faults. • The two plates on either side of the boundary converge (move toward each other). • If the edge of one of the two plates has oceanic crust, that plate will be subducted. • Subduction destroys old ocean floor. • If both plate edges are continental crust, a folded mountain belt will form. http: //www. wwnorton. com/college/geo/egeo 2/content/animations/2_5. htm

Ocean-Ocean Convergence • One of the two oceanic plates will be subducted (descend into the mantle) • A trench marks the actual convergent boundary (due to bending of the edges of both plates) • Only place where deep earthquakes occur • Wadati-Benioff zone is zone of earthquakes in subducted lithosphere

Island Arcs • Ocean crust is destroyed by subduction. • A trench marks the actual plate boundary. • Melting occurs above the subducted plate when it reaches about 150 km inside the Earth. • Lava reaches the surface and creates volcanic islands on the non-subducting plate. • Islands and trenches are arcshaped due to curvature of Earth.

Ocean-Continent Convergence Similar to ocean-ocean convergence: • A trench marks the boundary. • Melting at depth leads to a chain of volcanoes on the non-subducting plate

Deformation at Plate Boundary The edges of the continent in an ocean-continent boundary deform noticeably between quakes. All of that is released suddenly during an earthquake, resulting in large elevation changes. 4 -1: https: //www. youtube. com/watch? v=6 w. Wn. Wt. FQp. NE

Continent-Continent Convergence • When two continents collide, neither can be subducted. • The already subducted oceanic portion of the plate breaks away from the continental portion and descends below the melting depth. • Volcanism stops. • The continental lithosphere folds and rises along thrust faults, creating huge folded mountain belts.

Folded Mountains As the Arabian Plate moves away from Africa, it is colliding with the Eurasian Plate. Top right: Satellite image of the Zagros Mountains of Iran. Left: Ground view of Zagros Mountains showing folding of rock layers. In addition to folding, rocks have reverse and thrust faults.

Convergent Boundary - Summary • Area of sinking mantle convection current creates compression • Combines two plates into one eventually • If one plate has oceanic crust on edge, will get subduction (plate descends into mantle), accompanied by volcanism • Plate boundary marked by a trench (if subduction) • Plate boundary marked by a folded mountain range (if no subduction) • Old ocean floor destroyed by subduction

Transform Boundary • The third type of boundary does not involve mantle currents rising or sinking, but rather is caused by shear stresses at the edges of plates as they move relative to other plates. • Strike-slip faults mark transform boundaries. • Segments of mid-ocean ridges (divergent boundaries) are connected by transform boundaries. • Transform boundaries can connect any type of boundary to any other boundary.

Compression and Tension Transform boundaries are not completely straight. Where there are bends, there can be localized compression or tension

Localized Compression • The San Andreas fault is a transform boundary between the Pacific plate and the North American Plate. It is a right-lateral strike-slip fault. • The San Andreas fault bends near Los Angeles, creating localized compression.

Localized Tension • The Dead Sea-Jordan transform is a leftlateral strike-slip fault with jogs creating localized tension. • The Sea of Galilee and the Dead Sea are sag ponds caused where segments have pulled apart.

Transform Boundary - Summary • Area of shear stress • Connects other plate boundary segments. • Shallow earthquakes • Plate boundary marked by a strike-slip fault • Can have localized areas of tension and compression

Reminder: Two Ways to Convect • There are two ways for ductile rock to convect: large rolling convection currents (where the rock makes a big loop, similar to the liquid in the image to the right), or narrow columns of rising rock known as plumes that reflect thermal jostling. Do we see any evidence for either convection currents or plumes by looking at the surface of the Earth? YES Convection currents drive plate tectonics. But we also see plumes hot spots

Islands in the Pacific • There are several chains of islands and undersea mountains in the Pacific • The longest and most studied chain is the Hawaiian-Emperor chain. • Not at or near a plate boundary • Only the eastern side of the Big Island volcanically and seismically active.

Mantle Plumes • Seismic waves slow down in warmer lower-density mantle plumes. • Recent research using S wave velocity has mapped several plumes beneath Pacific Islands • Mapping down to 1000 km (about 1/3 of the way down to the core-mantle boundary).

Hot Spots • The mantle plumes that create the Hawaiian Islands are believed to originate at the core-mantle boundary. • Convection in the liquid metal core should cause some regions of the lower mantle to be hotter than their surroundings, leading to hot spots in the core-mantle boundary, giving rise to mantle plumes. • Some mantle plumes may not reach the surface, but stall out in the Earth’s interior.

Stationary Hot Spots • Comparing hot spot island chains suggests that the individual hot spots are relatively stationary. • The chains are created when the Pacific plate moves over the hot spot. • We can use the locations and ages of hot spot volcanoes to calculate the rates and directions of past plate motions. • Plates change direction and speed over time. http: //www. wwnorton. com/college/geo/egeo 2/content/animations/2_6. htm

References • • Title page: Earth from NASA at http: //www. nasa. gov/sites/default/files /images/608134 main_world-orig_full. jpg. Cascadia Subduction zone from USGS at https: //pnsn. org/outreach/earthquakesources/csz What’s Inside the Earth? Image adapted from a NASA image obtained from http: //science. nasa. gov/medialibrary/2004/03/15/16 mar_sedna_resources/com parison. jpg Drill cores – core comparison found on several website, including educational sites and blogs. Could not determine origin. This copy from http: //teachersites. schoolworld. com/webpages/tclause/science. cfm? subpage=1121205. Drill core samples also found at multiple sites—origin unclear. This copy from http: //www. damninteresting. com/the-deepest-hole/ Crust and Mantle Rocks: Images from http: //www. pitt. edu/~cejones/Geo. Images/ 6 Metamorphic. Rocks/Gneiss 1 Rail. Road. jpg; http: //www. pitt. edu/~cejones/ Geo. Images/2 Igneous. Rocks/Igneous. Compositions/6 Granite/Granite. CUp. jpg; http: //www. pitt. edu/~cejones/Geo. Images/2 Igneous. Rocks/Igneous. Compositions/3 Bas alt/Basalt. Olivine. Pheno. CUp. jpg; http: //www. pitt. edu/~cejones/Geo. Images/ 2 Igneous. Rocks/Igneous. Compositions/1 Ultramafic/Peridotite 418 a. jpg. Diagram from http: //www. geolsoc. org. uk/Plate-Tectonics/Chap 2 -What-is-a-Plate/Chemicalcomposition-crust-and-mantle

References • • • Xenoliths and faults: Xenolith image from AGU blog at http: //3. bp. blogspot. com/Q 6 U 7 Fn. Xzet 8/Tcvj. F 6 ADr. FI/AAAAA 70/Pxg. Xs. Le. Rxcg/s 1600/Einat_Xenolith_1. J PG. Photo caption: “A small peridotite xenolith in basalt, Hawaii, 2009. Photo credit: Einat Lev”. Ophiolite from AGU blog at https: //blogs. agu. org/mountainbeltway/ 2010/10/26/tavsanli-zone-field-trip-part-3/ Average Density (Heft): Equation from http: //hyperphysics. phy-astr. gsu. edu/ hbase/dens. html. Cubes adapted by Melinda Hutson from several different versions available on line. Shape and Magnetic Field: Image of shape from http: //www. ucl. ac. uk/Earth. Sci/ people/lidunka/GEOL 2014/Geophysics 2%20 -%20 Gravity/gravity. htm. Earth’s magnetic field from http: //science. nasa. gov/medialibrary/2008/04/16/ 17 apr_magnetotail_resources/magnetotail. jpg P and S wave velocities: Equation image attributed to IRIS and found at http: //topex. ucsd. edu/es 10/lectures/lecture 11/wave. speed. gif. Travel paths from http: //eqseis. geosc. psu. edu/~cammon/HTML/ Classes/Intro. Quakes/Notes/waves_and_interior. html Seismic Wave Paths: Earth image from http: //web. ics. purdue. edu/~braile/ edumod/as 1 lessons/Interp. Seis. htm. Seismic discontinuity from http: //www. ucl. ac. uk/Earth. Sci/people/lidunka/GEOL 2014/Geophysics 4%20%20 Seismic%20 waves/SEISMOLOGY%20. htm

References • • Shadow Zones: Images from http: //earthsci. org/education/teacher/ basicgeol/earthq. html Major Seismic Discontinuities: Moho image from http: //www. geolsoc. org. uk/Plate. Tectonics/Chap 2 -What-is-a-Plate/Chemical-composition-crust-and-mantle. Other two images from http: //www. ucl. ac. uk/Earth. Sci/people/lidunka/GEOL 2014/ Geophysics 4%20 -%20 Seismic%20 waves/SEISMOLOGY%20. htm Seismic Velocity and density: Depth profile from http: //cseligman. com/text/planets/ innerstructure. htm. Equation from http: //hyperphysics. phy-astr. gsu. edu/ hbase/dens. html. Complexity in the Upper Mantle: Image from http: //earthsci. org/education/ teacher/basicgeol/earthq. html Defining Earth’s Layers: Image drawn by Melinda Hutson, Portland Community College. Geothermal Gradient: Image from http: //neo. eps. utk. edu/310/Geology_310/ Gems/Entries/2013/9/13_Geothermal_Gradient. html Heat Transport - Conduction: Image from http: //www. mstworkbooks. co. za/naturalsciences/gr 7 -ec-03. html

References • • • Heat Transport - Convection: Candle and beaker image from http: //www. mstworkbooks. co. za/natural-sciences/gr 7 -ec-03. html. Thermal jostling vs rolling cells found on several sites talking about Benard cells. Image from http: //www. dichotomistic. com/hierarchies_fractals. html Earth’s Surface Motion: Image from https: //www. iris. edu/hq/files/programs/ education_and_outreach/aotm/14/1. GPS_Background. pdf Global Seismicity: Global seismicity map from http: //eqseis. geosc. psu. edu/~cammon/ HTML/Classes/Intro. Quakes/Notes/plate_tect 01. html Plate Tectonics: Image from http: //eqseis. geosc. psu. edu/~cammon/HTML/ Classes/Intro. Quakes/Notes/plate_tect 01. html Plates Float on Asthenosphere: Isostasy diagram found at several sights and downloaded from http: //www. geographylive. com/wp-content/uploads/2014/02/Airy. Isostasy 1. jpg. Lithosphere/asthenosphere adapted from https: //www. uwgb. edu/ dutchs/Earth. SC 102 Notes/102 Orogeny. htm Mantle Convection: Image from http: //www. see. leeds. ac. uk/structure/ dynamicearth/convection/models. htm

References • • • Rising Convection Currents: Image adapted from http: //web. ics. purdue. edu/ ~braile/edumod/convect. htm Divergent Plate Boundary: Images from http: //www. le. ac. uk/geology/ art/gl 209/lecture 3/lect 3 -3. html Mid-Ocean Ridge: Images from http: //www. tulane. edu/~sanelson/eens 1110/ oceans. htm Sinking Convection Currents: Convection image adapted from http: //web. ics. purdue. edu/~braile/edumod/convect_files/image 018. jpg Young Divergent Boundary: Map of Africa with inset from http: //pubs. usgs. gov/gip/ dynamic/East_Africa. html. Closeup of Afar triangle and Arabia adapted from http: //www. caperi. com/changing-face-of-the-red-sea/ Mature Divergent Boundary: Ridge with focal spheres from http: //www. geosci. usyd. edu. au/users/prey/Teaching/Geos-2111 GIS/FMS/Sld 031 c. html. Topographic map from http: //www. virginiaplaces. org/geology/rocksdui 4. html, which cites NOAA as original source. Close-up of central graben found at a several sites, attributed to both NOAA and Woods Hole, and downloaded from http: //www. whoi. edu/oceanus/feature/mid-atlantic-ridge-volcanic-processes

References • • • Divergent Boundary: Map of Africa with inset from http: //pubs. usgs. gov/gip/ dynamic/East_Africa. html. Closeup of Afar triangle and Arabia adapted from http: //www. caperi. com/changing-face-of-the-red-sea/ Age of Ocean Crust: Image from https: //www. ngdc. noaa. gov/mgg/ocean_age/ data/2008/image/age_oceanic_lith. jpg Ocean-Ocean Convergence: Block diagram from USGS at http: //pubs. usgs. gov/gip/ dynamic/understanding. html. Map and wadati benioff zone from http: //www. theliving moon. com/45 jack_files/03 files/Endangered_Earth_Subduction_Zone_01. html Island Arcs: Block diagram from USGS at http: //pubs. usgs. gov/gip/ dynamic/understanding. html. EQ map of Indonesia from http: //papuaweb. org/gb/ peta/g-bumi/_misc/indonesia. gif (unable to locate original source). Volcano map of Indonesia originally USGS and on multiple sites. This copy from http: //volcano. si. edu/volcanoes/region 06/java/papanday/3706 pap 1. jpg Ocean-Ocean Convergence: Block diagram from USGS at http: //pubs. usgs. gov/gip/ dynamic/understanding. html. Map with Cascade volcanoes from http: //geomaps. wr. usgs. gov/parks/province/cascadearc. gif. Map of Cascadia earthquakes from https: //pnsn. org/outreach/earthquakesources/csz

References • • • Deformation at Plate Boundary: Image of deformation in 3 parts with boat from http: //www. tectonics. caltech. edu/outreach/highlights/sumatra/why. html, All other images originally from a USGS site that is no longer on-line (URL lost). Continent-Continent Convergence: Image at bottom from https: //geosociety. files. wordpress. com/2013/08/jessup_gsa_fig_2. jpg. All other image from http: //pubs. usgs. gov/gip/dynamic/understanding. html Folded Mountains: Top left image from http: //www. geoexpro. com/articles/ 2012/05/the-zagros-uplift. Top center image from: http: //africa-arabiaplate. weebly. com/arabian-plate. html. Other two images from http: //fas. org/irp/imint/ docs/rst/Sect 2_6. html Transform Boundary: Image from http: //pubs. usgs. gov/gip/dynamic/ understanding. html Compression and Tension: Image from http: //myweb. cwpost. liu. edu/ vdivener/notes/structure_landforms. htm Localized Compression: Image from http: //pubs. usgs. gov/gip/dynamic/ understanding. html. Closeup of fault adapted from http: //geology. gsapubs. org/ content/35/9/855/F 3. large. jpg. Focal mechanisms from http: //www. bssaonline. org/ content/103/1/131/F 1. large. jpg

References • • • Localized Tension: NASA image from http: //www. members. tripod. com/ bibleclass/israel. jpg. Other two images from USGS at http: //woodshole. er. usgs. gov/project-pages/dead_sea/tectonic. html Reminder: Two Ways to Convect: Image from Thermal jostling vs rolling cells found on several sites talking about Benard cells. Image from http: //www. dichotomistic. com/hierarchies_fractals. html Islands in the Pacific: Large map from http: //www. appstate. edu/~abbottrn/ vlcns/vlcns 1. jpg. Small map of Hawaiian Islands found at several sites. This one from http: //www. roebuckclasses. com/105/images/oceania/ages_of_islands. gif. Seismicity of Big Island from http: //hvo. wr. usgs. gov/earthquakes/seismicity/ 2000_med. gif Mantle Plumes: Image from http: //cdn. phys. org/newman/gfx/news/hires/2013/1 newmodelofea. jpg Hot Spots: Image from http: //www. eos. ubc. ca/research/wrangellia/5 mantle. html Stationary Hot Spots: Image from http: //www. accuracyingenesis. com/seamount. html. It is attributed to a USGS site, but the link is broken.


 Earths interior
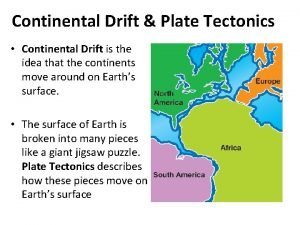
 Continental drift vs plate tectonics
 Compare continental drift and plate tectonics
 Plate tectonics
 Plate tectonics vs continental drift
 Convergent boundary oreo
 Oreo tectonics
 Whats earths moon called
 Whats earths moon called
 Whats the name of earths moon
 Plate tectonics vs continental drift
 What are four types of plate boundaries
 Plate motion calculator
 Plate tectonics theory states that
 Plate tectonics webquest pdf
 Inner core vocabulary
 Rodinia
 Plate tectonics definition
 Driving force of plate tectonics
 Concept map plate tectonics
 Summarize the theory of plate tectonics
 Harry hess and seafloor spreading
 Mantle magma
 Constructive plate boundary diagram
 Pangaea
 The ocean floor revealing plate tectonics
 Fossils as evidence of continental drift
 Plate tectonics definition apes
 Francis bacon plate tectonics
 Plate tectonics interactive lab
 Convergent plate boundary
 Two regions of the mantle
 Types of volcanoes
 Plate tectonics game board
 Types of plate boundaries
 Candy bar plate tectonics
 Plate tectonics
 Plate tectonics
 Plate tectonics
 Plate tectonics
 San andreas fault
 Boundaries of plate tectonics
 Plate tectonics
 Earth rotation
 Future plate tectonics
 Theory of plate tectonics
 Strombolian eruption
 Plate tectonics jeopardy
 Kesler science plate tectonics
 Chapter 8 plate tectonics
 Chapter 8 plate tectonics
 Pour plate method vs spread plate method
 Isolation of pure cultures
 Pour plate vs streak plate
 A denser oceanic plate collides with a continental plate
 The earths layer foldable
 Earths roation
 Home sweet biome crossword
 Pnitogens
 How thick is the earths crust
