Natural selection and disease resistance in the cocoa

- Slides: 22
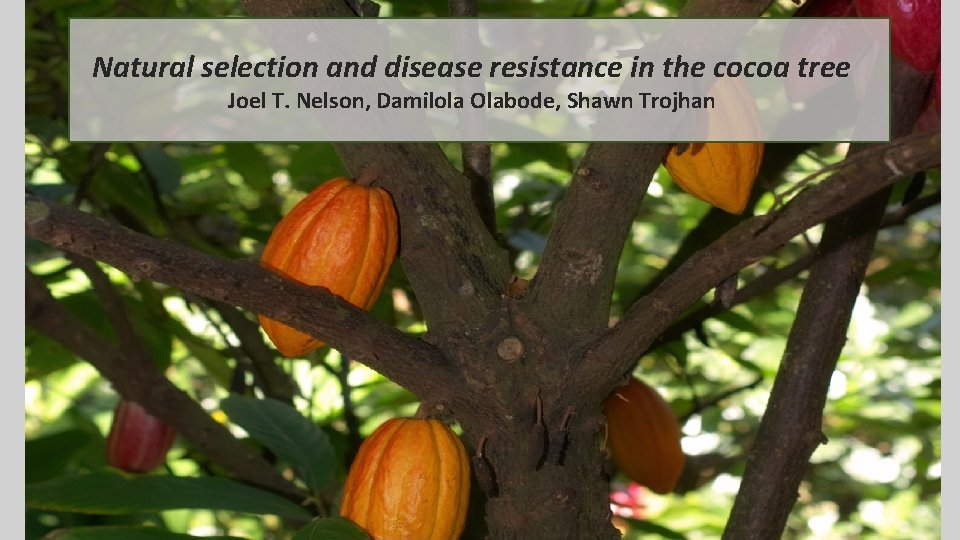
Natural selection and disease resistance in the cocoa tree Joel T. Nelson, Damilola Olabode, Shawn Trojhan
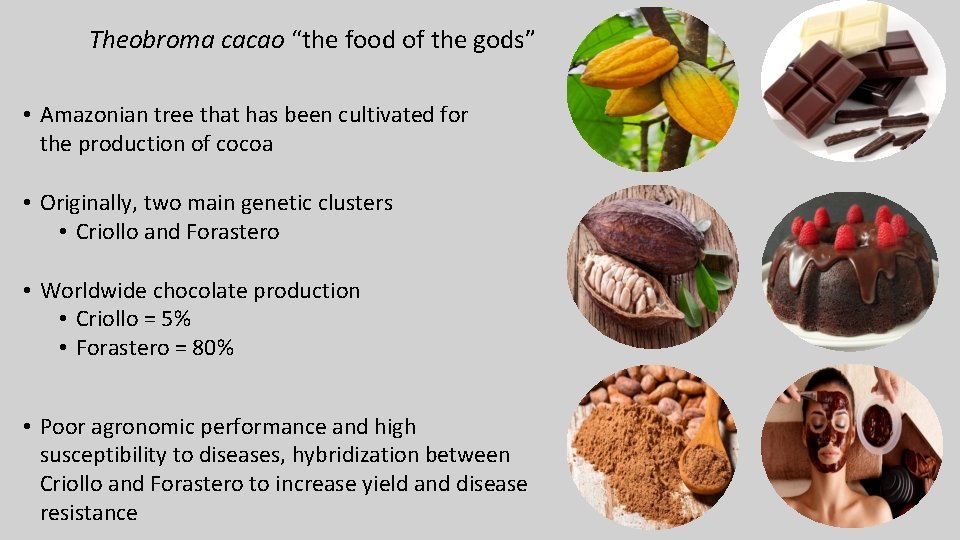
Theobroma cacao “the food of the gods” • Amazonian tree that has been cultivated for the production of cocoa • Originally, two main genetic clusters • Criollo and Forastero • Worldwide chocolate production • Criollo = 5% • Forastero = 80% • Trinitario (Criollo/Forastero hybrid) = 15% • Poor agronomic performance and high susceptibility to diseases, hybridization between Criollo and Forastero to increase yield and disease resistance
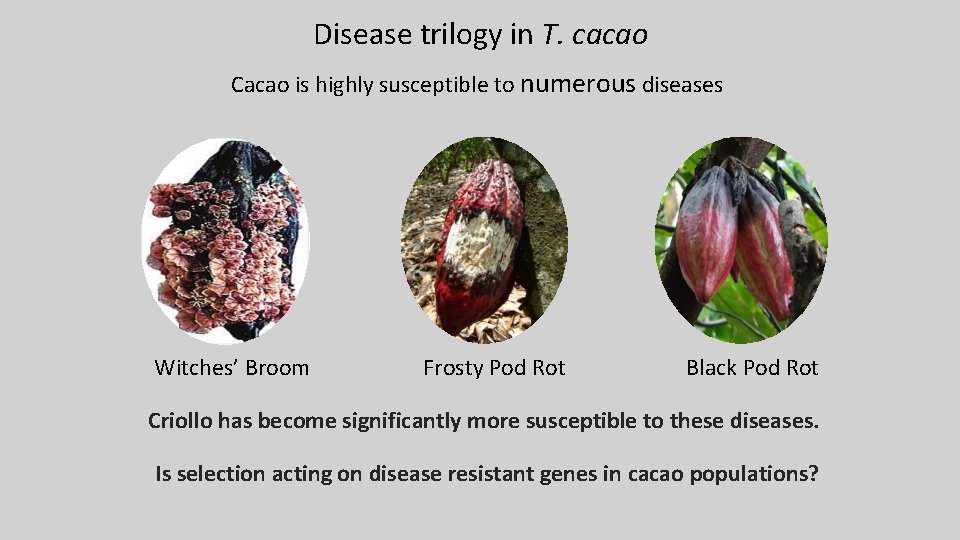
Disease trilogy in T. cacao Cacao is highly susceptible to numerous diseases Witches’ Broom Frosty Pod Rot Black Pod Rot Criollo has become significantly more susceptible to these diseases. Is selection acting on disease resistant genes in cacao populations?
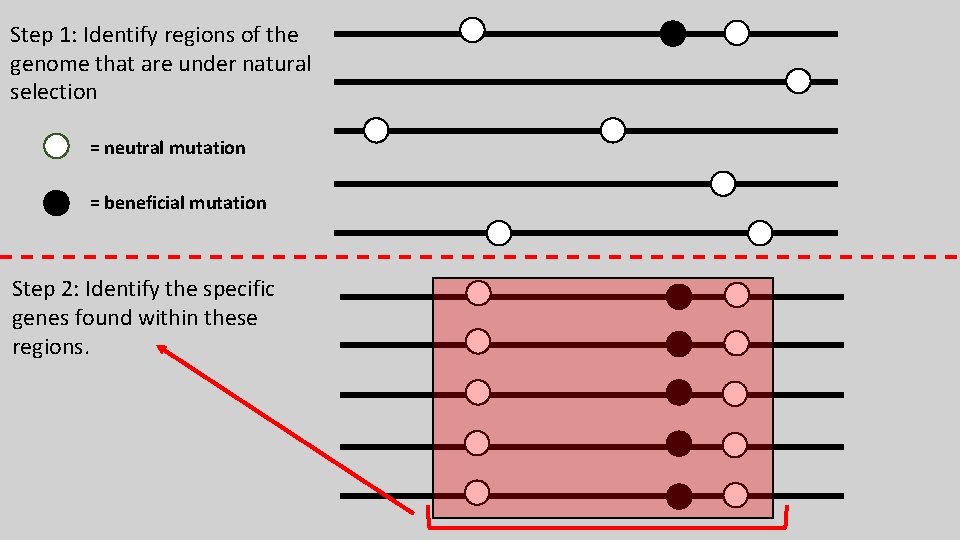
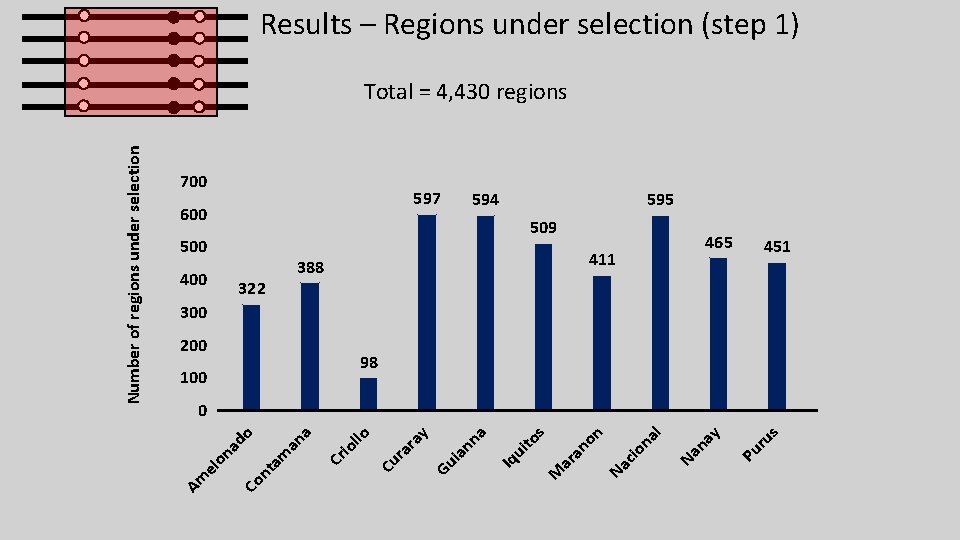
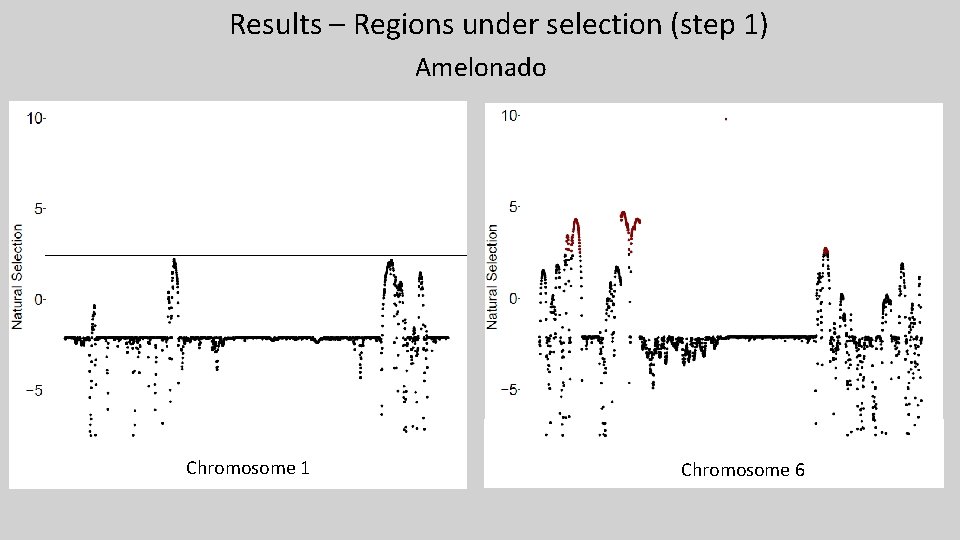
Step 1: Identify regions of the genome that are under natural selection = neutral mutation = beneficial mutation Step 2: Identify the specific genes found within these regions.
What is the goal? • What can the detection of selection tell us? • Genes that are under environmental pressure • Becoming locally adapted • How can identifying selection help with annual chocolate yields? • Assume we find disease resistant genes under selection • Indicates which populations are less susceptible to infections Effective management methods • Allocation of farming resources • Breeding programs • If a population becomes more resistant, mortality rates decrease, thus, increasing annual chocolate yields. Have be applied to many other study systems
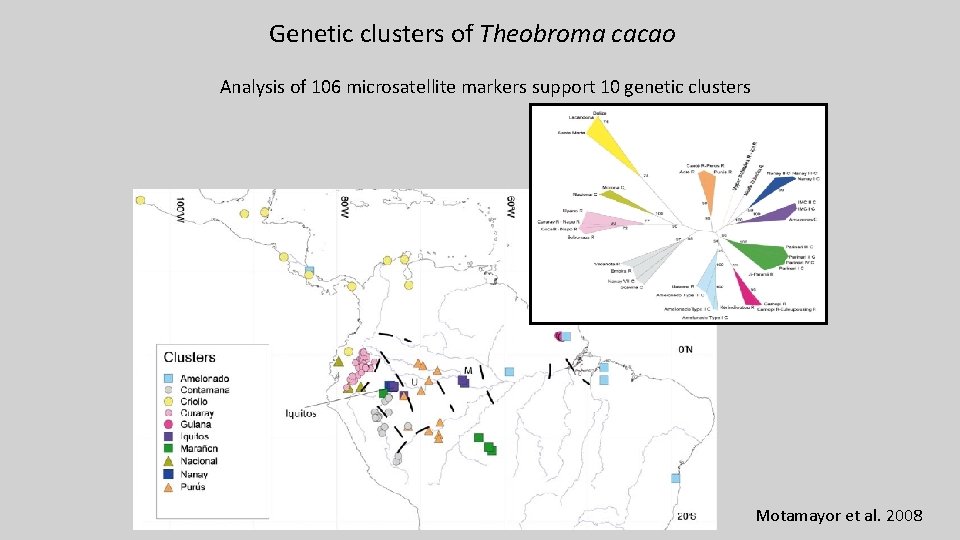
Genetic clusters of Theobroma cacao Analysis of 106 microsatellite markers support 10 genetic clusters Motamayor et al. 2008
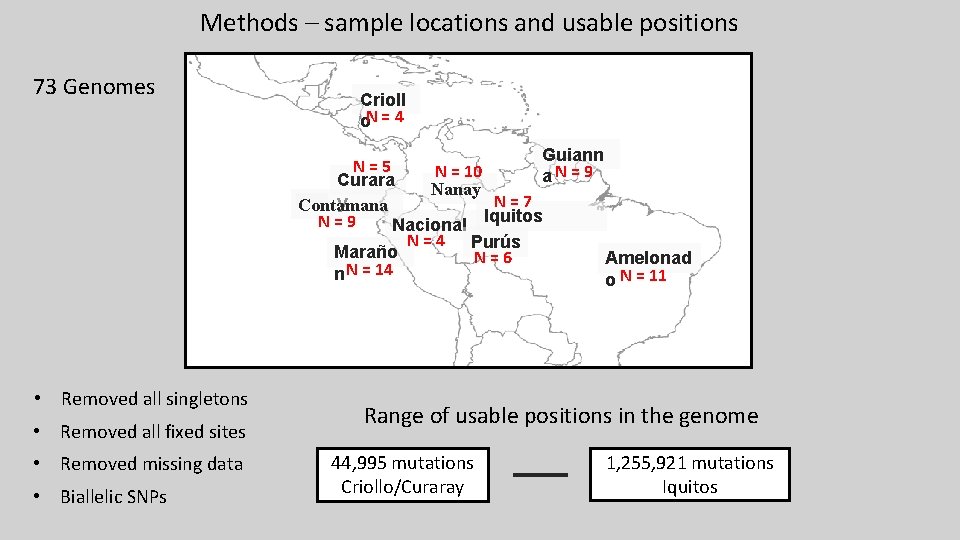
Methods – sample locations and usable positions 73 Genomes Crioll o. N = 4 Guiann N=5 N = 10 a. N=9 Curara Nanay N=7 y Contamana Iquitos N=9 Nacional N = 4 Purús Maraño N=6 Amelonad N = 14 n o N = 11 • Removed all singletons • Removed all fixed sites • Removed missing data • Biallelic SNPs Range of usable positions in the genome 44, 995 mutations Criollo/Curaray 1, 255, 921 mutations Iquitos
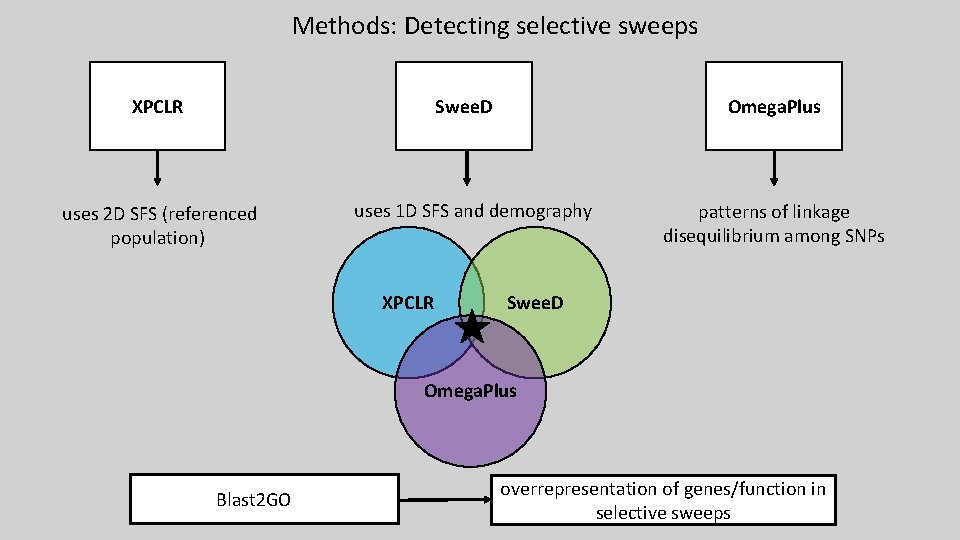
Methods: Detecting selective sweeps Swee. D XPCLR uses 2 D SFS (referenced population) Omega. Plus uses 1 D SFS and demography XPCLR patterns of linkage disequilibrium among SNPs Swee. D Omega. Plus Blast 2 GO overrepresentation of genes/function in selective sweeps
Methods: Multivariant data Use multivariant analyses to identify putative selective sweeps How to summarize the data? How to identify outliers is multivariant space?
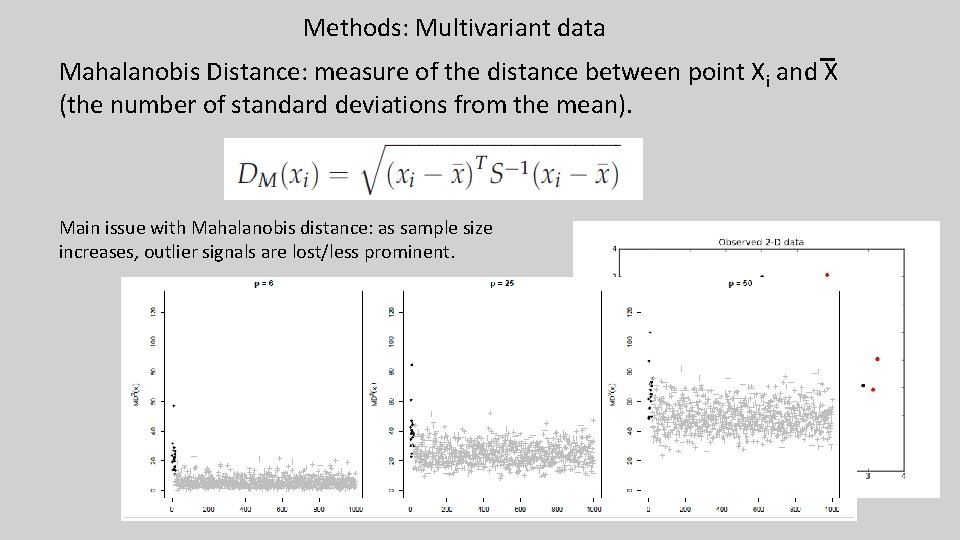
Methods: Multivariant data Mahalanobis Distance: measure of the distance between point Xi and X (the number of standard deviations from the mean). Main issue with Mahalanobis distance: as sample size increases, outlier signals are lost/less prominent.
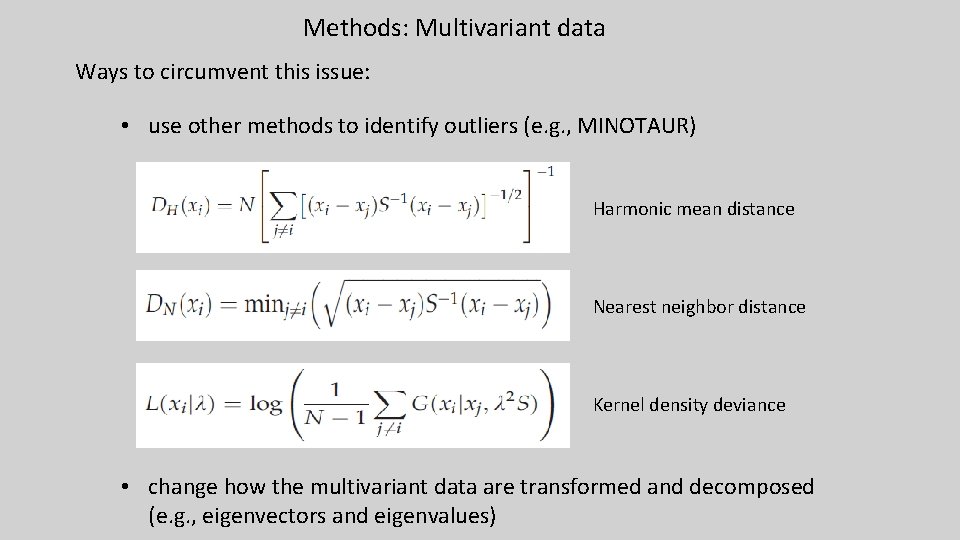
Methods: Multivariant data Ways to circumvent this issue: • use other methods to identify outliers (e. g. , MINOTAUR) Harmonic mean distance Nearest neighbor distance Kernel density deviance • change how the multivariant data are transformed and decomposed (e. g. , eigenvectors and eigenvalues)
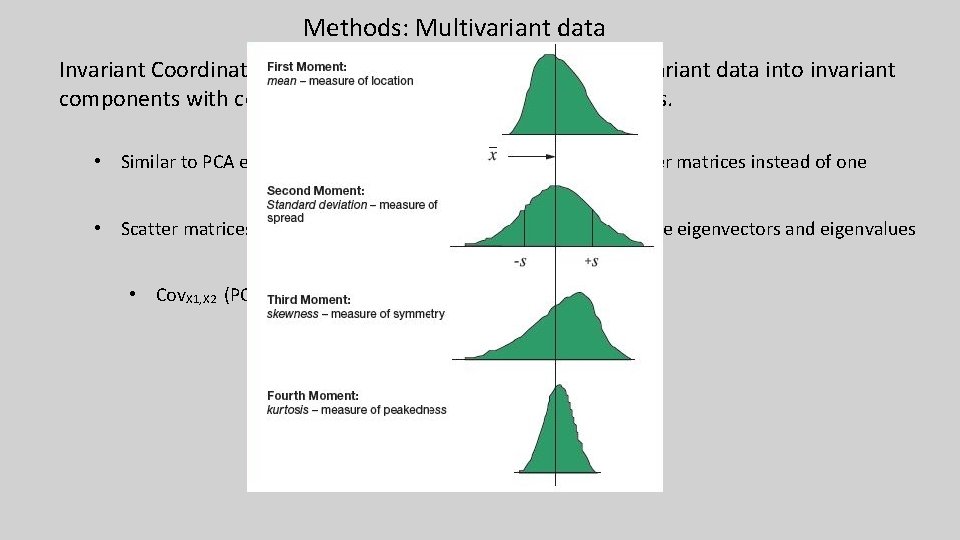
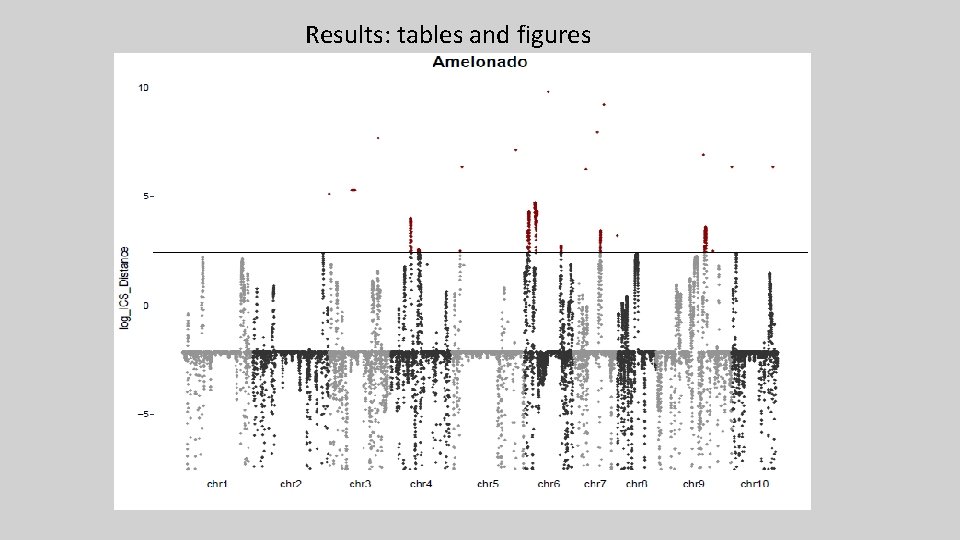
Methods: Multivariant data Invariant Coordinate Selection (ICS): decomposition of multivariant data into invariant components with corresponding eigenvectors and eigenvalues. • Similar to PCA except ICS relies on the decomposition of two scatter matrices instead of one • Scatter matrices use different moments of the distribution to create eigenvectors and eigenvalues • Cov. X 1, X 2 (PCA) vs. Cov. X 1, X 2 and Cov 4 X 1, X 2 (ICS)
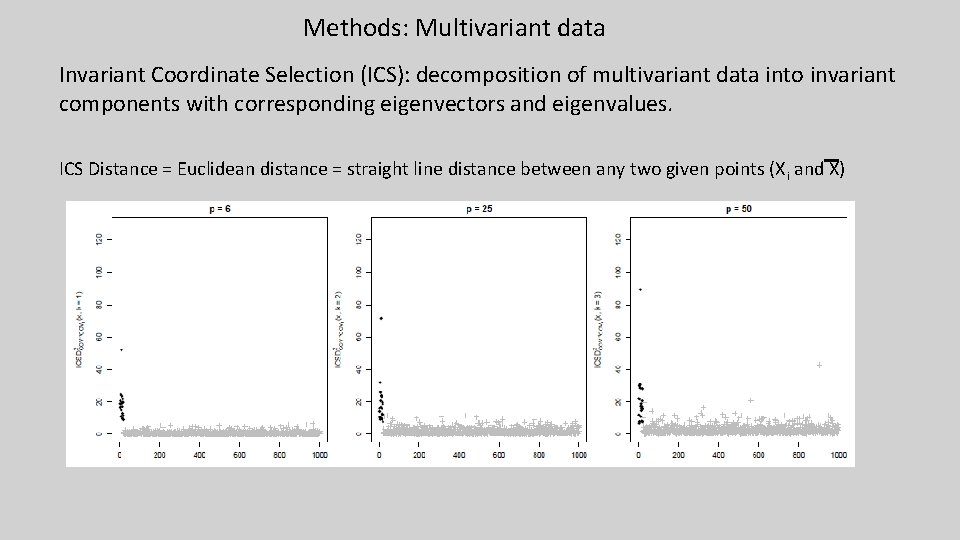
Methods: Multivariant data Invariant Coordinate Selection (ICS): decomposition of multivariant data into invariant components with corresponding eigenvectors and eigenvalues. ICS Distance = Euclidean distance = straight line distance between any two given points (X i and X) Euclidian Distance
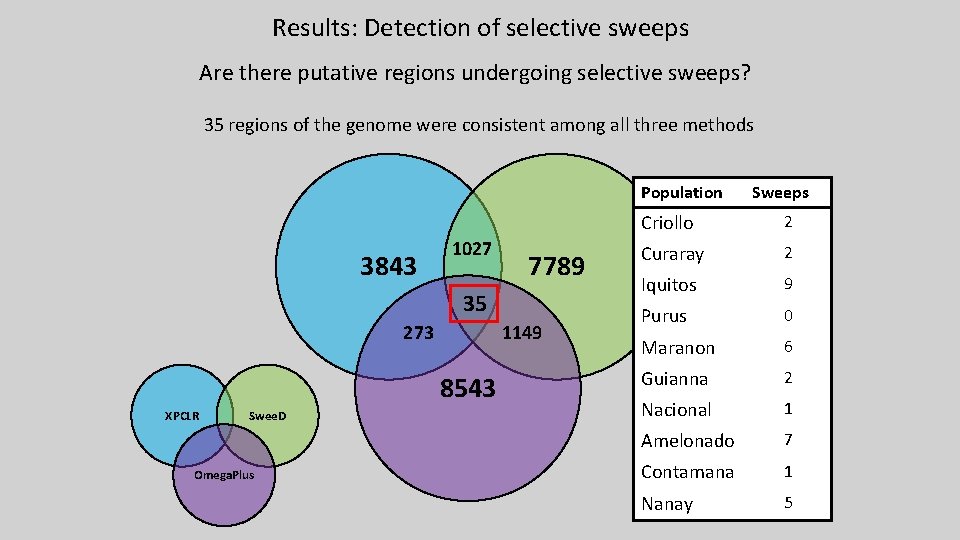
Results: Detection of selective sweeps Are there putative regions undergoing selective sweeps? 35 regions of the genome were consistent among all three methods Population 3843 1027 7789 35 273 1149 8543 XPCLR Swee. D Omega. Plus Sweeps Criollo 2 Curaray 2 Iquitos 9 Purus 0 Maranon 6 Guianna 2 Nacional 1 Amelonado 7 Contamana 1 Nanay 5
Results – Regions under selection (step 1) 700 597 600 595 594 509 500 411 388 322 465 451 300 200 98 100 s ru Pu y na Na l na Na cio on an s M ar to ui Iq Gu ia nn a y ra ra Cu llo io Cr an am nt Co el on ad o a 0 Am Number of regions under selection Total = 4, 430 regions
Results – Regions under selection (step 1) Amelonado Chromosome 1 Chromosome 6
Results: tables and figures
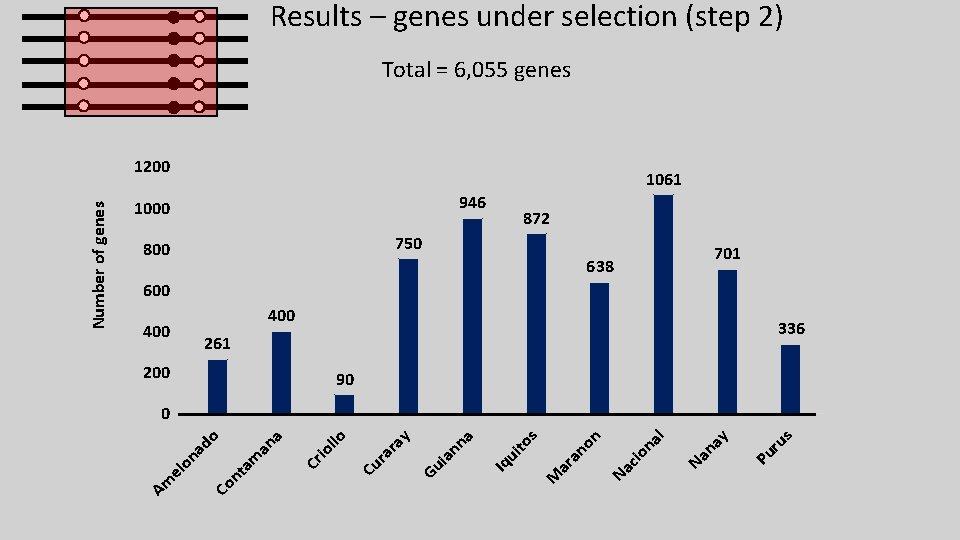
Results – genes under selection (step 2) Total = 6, 055 genes 1061 946 1000 872 750 800 701 638 600 400 336 261 200 90 s ru Pu y na Na l na cio Na on M ar an s to ui Iq Gu ia nn a y ra ra Cu llo io Cr an am nt Co el on ad o a 0 Am Number of genes 1200
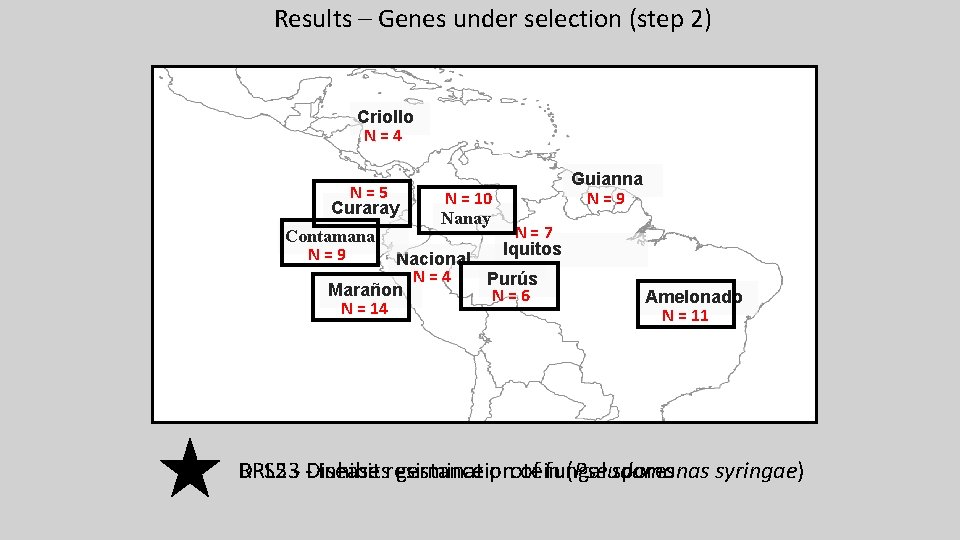
Results – Genes under selection (step 2) Criollo N=4 N=5 Curaray Contamana N=9 N = 10 Nanay Guianna N=9 N=7 Iquitos Nacional N=4 Purús Marañon N=6 N = 14 Amelonado N = 11 DRL 23 RPS 5 - -Disease Inhibitsresistance germination protein of fungal (Pseudomonas spores syringae)
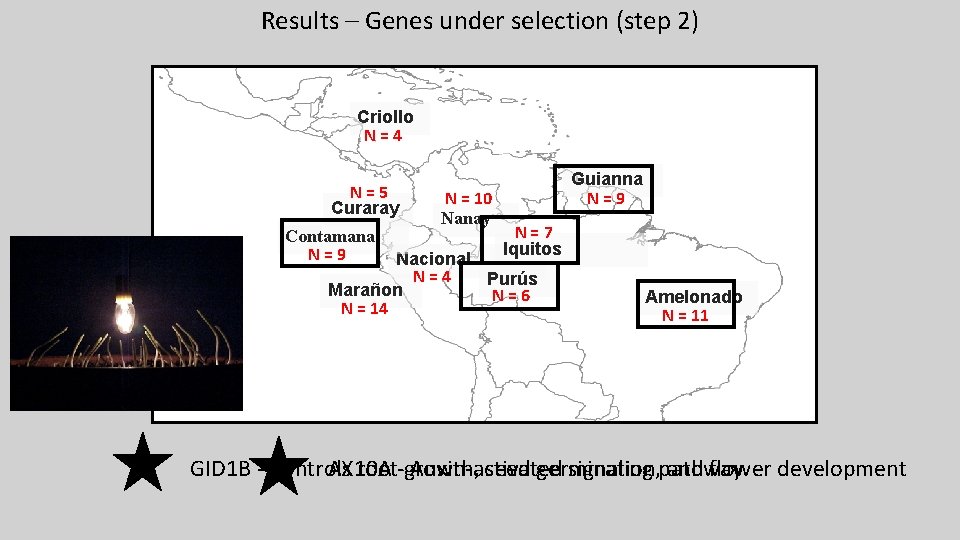
Results – Genes under selection (step 2) Criollo N=4 N=5 Curaray Contamana N=9 N = 10 Nanay Guianna N=9 N=7 Iquitos Nacional N=4 Purús Marañon N=6 N = 14 Amelonado N = 11 AX 10 A Auxin-activated signaling pathway GID 1 B - Controls root-growth, seed germination, and flower development
Summary • Are there regions of the genome under selection? • What genes are involved and how many? • 4, 430 regions of the genome under selection • 6, 055 genes • Many genes involved with disease resistance and stress responses • Many other genes, including plant development, root growth and flower timing Conclusions 1. Show genomic evidence to how cacao populations are locally adapting to different environmental stressors. 2. Provides more information that could be utilized for management purposes (resource management and selective breeding).
Questions?