National Health Systems Resource Centre HCF Healthcare Financing



- Slides: 18
National Health Systems Resource Centre HCF Healthcare Financing
Health Financing in Health System A health system consists of all organizations, people and actions whose primary intent is to promote, restore or maintain health. This includes efforts to influence determinants of health as well as more direct health-improving activities. A health system is therefore more than the pyramid of publicly owned facilities that deliver personal health services. "Everybody's business. Strengthening health systems to improve health outcomes : WHO's framework for action" (PDF). WHO. 2007.
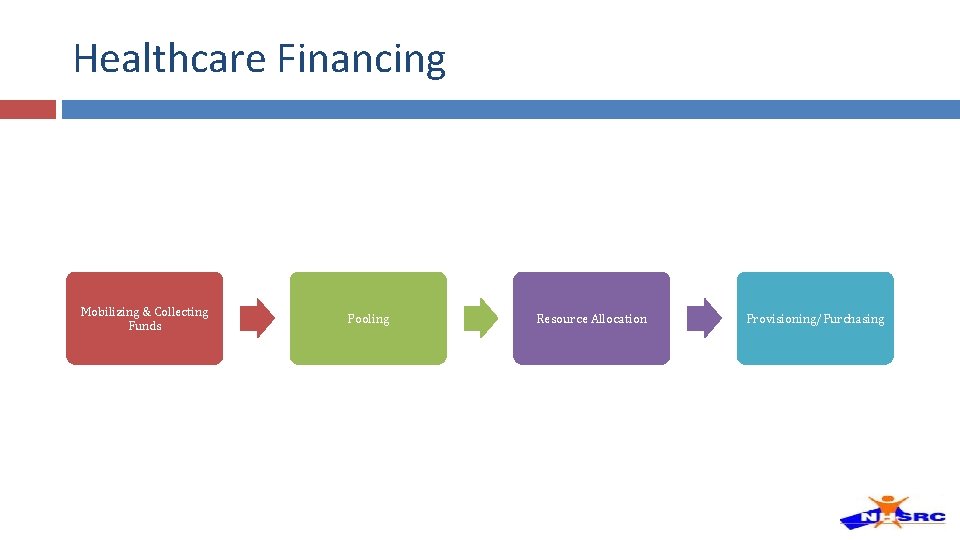
Healthcare Financing Mobilizing & Collecting Funds Pooling Resource Allocation Provisioning/Purchasing
The connection between health financing and overall system goals The health financing system does not act alone in affecting the intermediate objectives and final goals; Co-ordinated policy and implementation across health system functions are essential for making progress on the desired objectives Adapted from Kutzin J, 2008
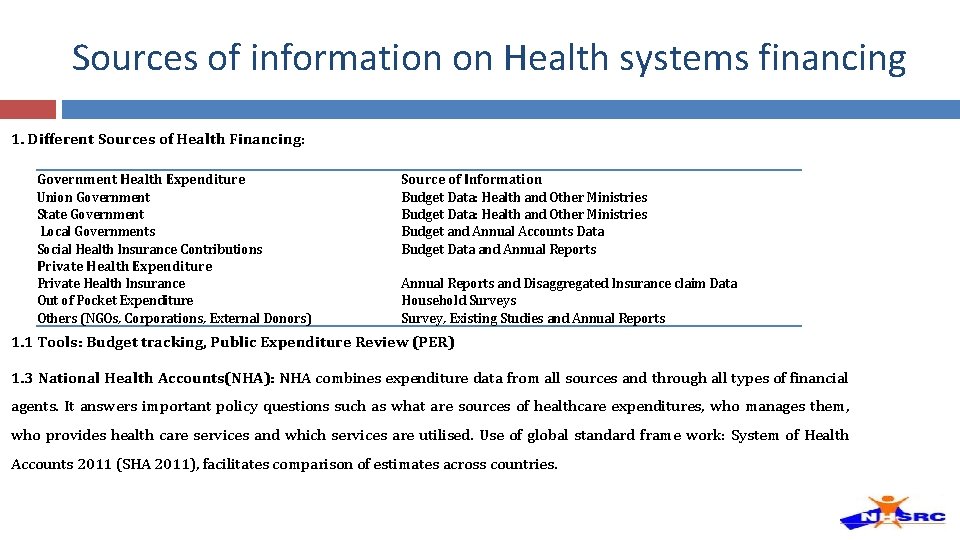
Sources of information on Health systems financing 1. Different Sources of Health Financing: Government Health Expenditure Union Government State Government Local Governments Social Health Insurance Contributions Private Health Expenditure Private Health Insurance Out of Pocket Expenditure Others (NGOs, Corporations, External Donors) Source of Information Budget Data: Health and Other Ministries Budget and Annual Accounts Data Budget Data and Annual Reports and Disaggregated Insurance claim Data Household Surveys Survey, Existing Studies and Annual Reports 1. 1 Tools: Budget tracking, Public Expenditure Review (PER) 1. 3 National Health Accounts(NHA): NHA combines expenditure data from all sources and through all types of financial agents. It answers important policy questions such as what are sources of healthcare expenditures, who manages them, who provides health care services and which services are utilised. Use of global standard frame work: System of Health Accounts 2011 (SHA 2011), facilitates comparison of estimates across countries.
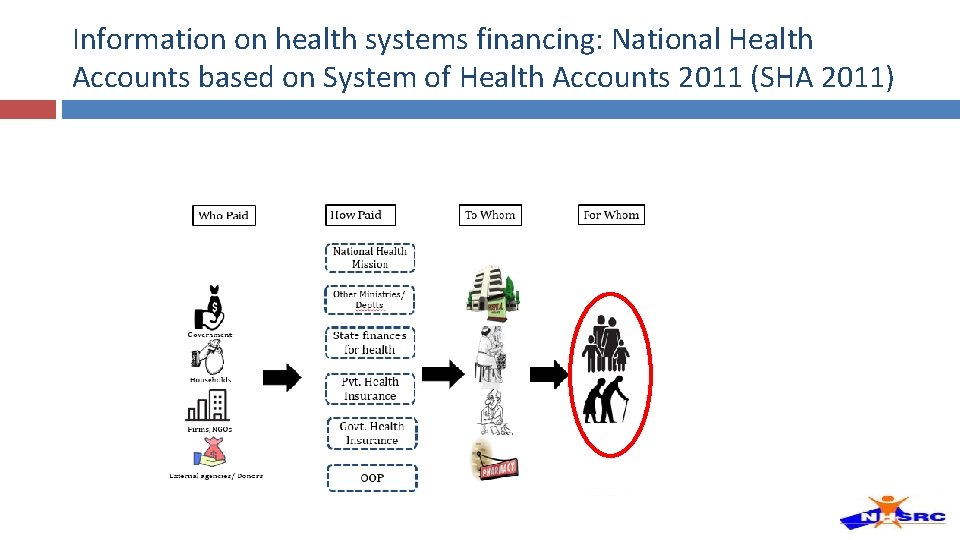
Information on health systems financing: National Health Accounts based on System of Health Accounts 2011 (SHA 2011)
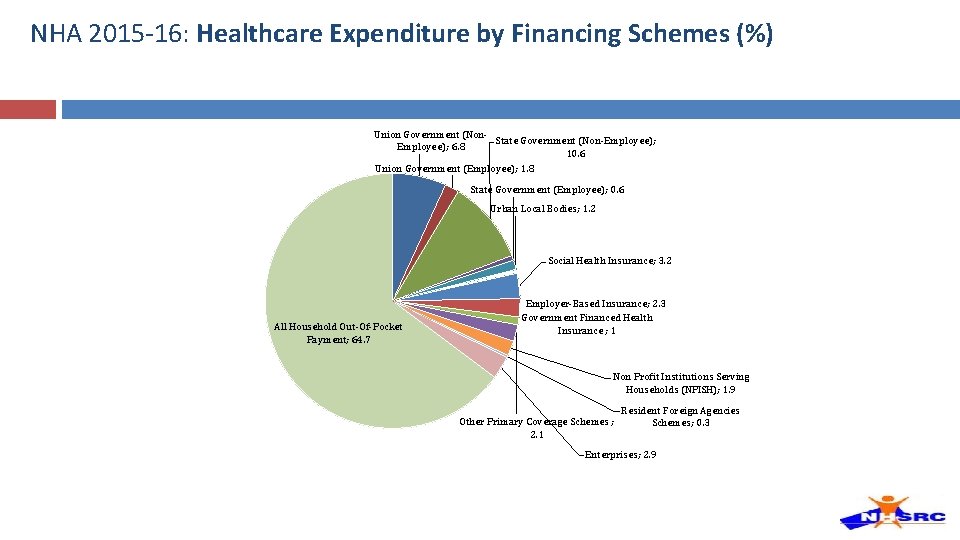
NHA 2015 -16: Healthcare Expenditure by Financing Schemes (%) Union Government (Non. State Government (Non-Employee); 6. 8 10. 6 Union Government (Employee); 1. 8 State Government (Employee); 0. 6 Urban Local Bodies; 1. 2 Social Health Insurance; 3. 2 All Household Out-Of-Pocket Payment; 64. 7 Employer-Based Insurance; 2. 3 Government Financed Health Insurance ; 1 Non Profit Institutions Serving Households (NPISH); 1. 9 Other Primary Coverage Schemes ; 2. 1 Resident Foreign Agencies Schemes; 0. 3 Enterprises; 2. 9
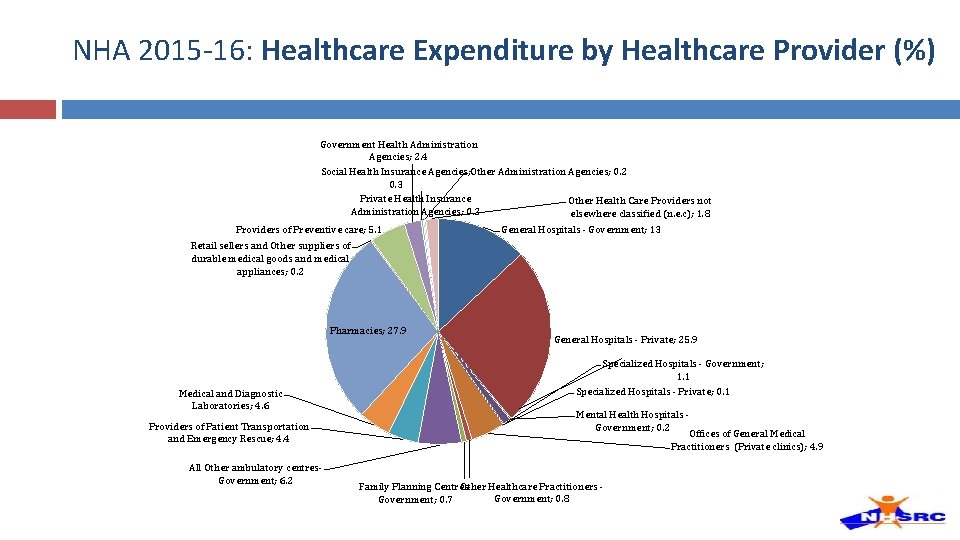
NHA 2015 -16: Healthcare Expenditure by Healthcare Provider (%) Government Health Administration Agencies; 2. 4 Social Health Insurance Agencies; Other Administration Agencies; 0. 2 0. 3 Private Health Insurance Other Health Care Providers not Administration Agencies; 0. 2 elsewhere classified (n. e. c); 1. 8 Providers of Preventive care; 5. 1 General Hospitals - Government; 13 Retail sellers and Other suppliers of durable medical goods and medical appliances; 0. 2 Pharmacies; 27. 9 Medical and Diagnostic Laboratories; 4. 6 Providers of Patient Transportation and Emergency Rescue; 4. 4 All Other ambulatory centres- Government; 6. 2 General Hospitals - Private; 25. 9 Specialized Hospitals - Government; 1. 1 Specialized Hospitals - Private; 0. 1 Mental Health Hospitals - Government; 0. 2 Offices of General Medical Practitioners (Private clinics); 4. 9 Other Healthcare Practitioners - Family Planning Centres- Government; 0. 8 Government; 0. 7
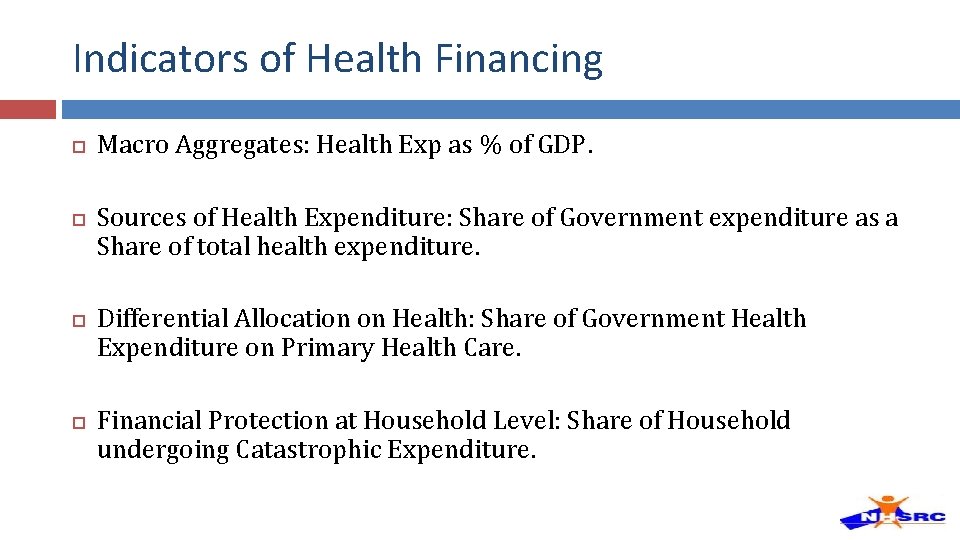
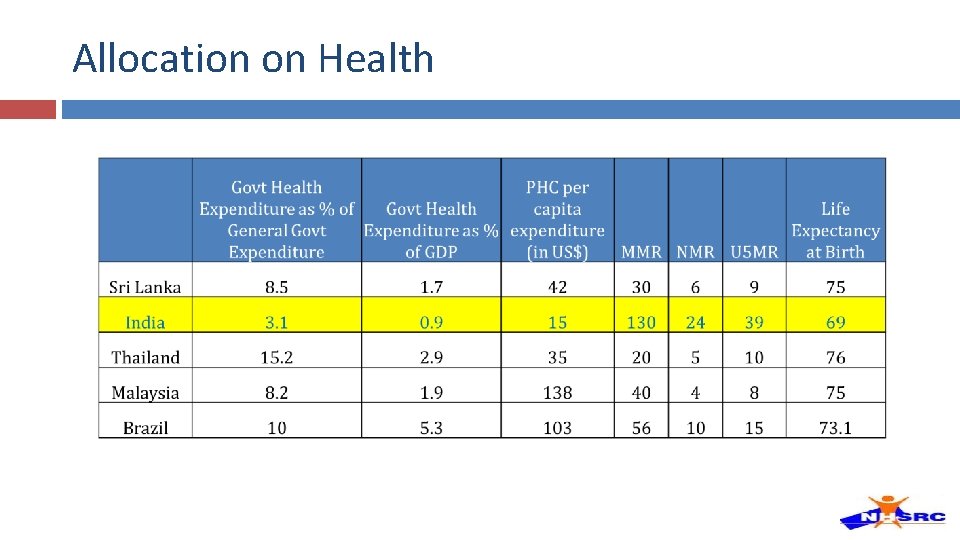
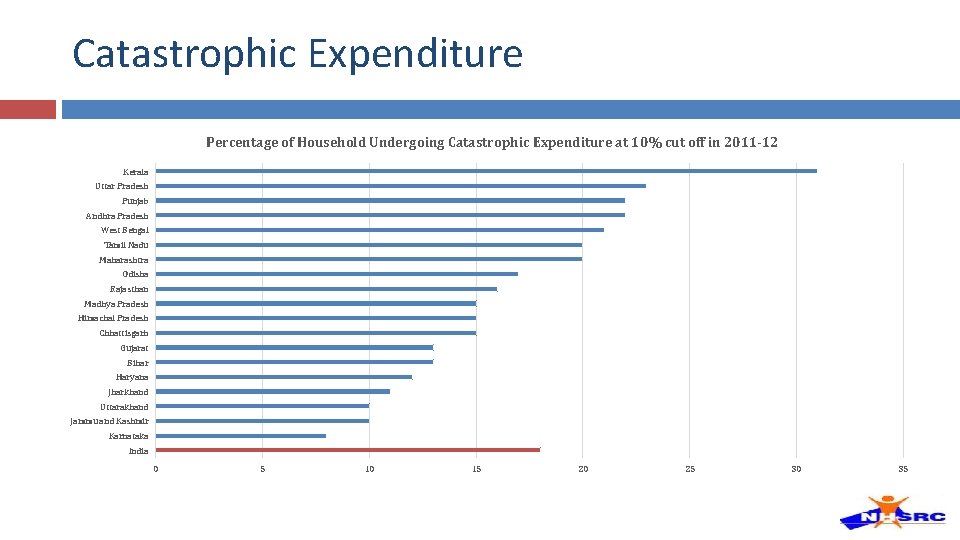
Indicators of Health Financing Macro Aggregates: Health Exp as % of GDP. Sources of Health Expenditure: Share of Government expenditure as a Share of total health expenditure. Differential Allocation on Health: Share of Government Health Expenditure on Primary Health Care. Financial Protection at Household Level: Share of Household undergoing Catastrophic Expenditure.
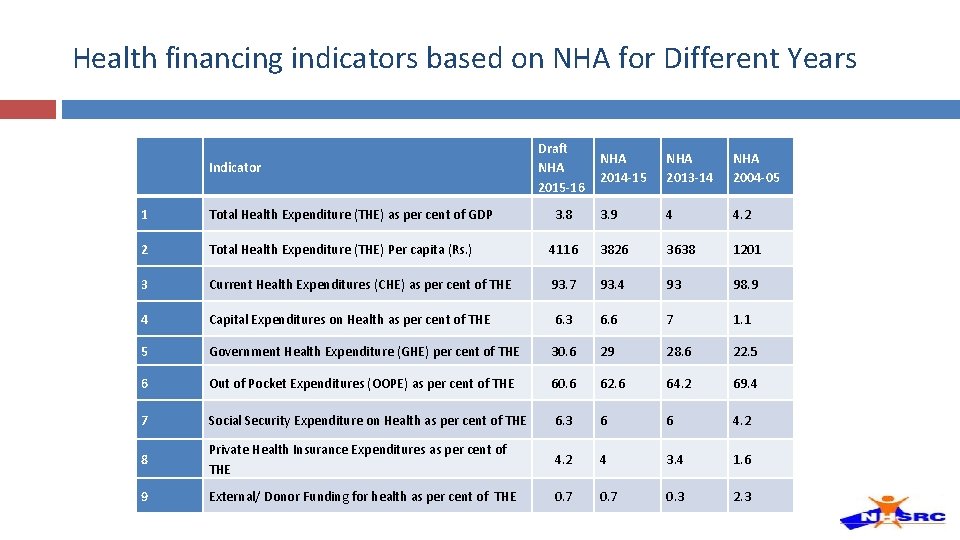
Health financing indicators based on NHA for Different Years Indicator Draft NHA 2015 -16 3. 8 NHA 2014 -15 NHA 2013 -14 NHA 2004 -05 3. 9 4 4. 2 1 Total Health Expenditure (THE) as per cent of GDP 2 Total Health Expenditure (THE) Per capita (Rs. ) 4116 3826 3638 1201 3 Current Health Expenditures (CHE) as per cent of THE 93. 7 93. 4 93 98. 9 4 Capital Expenditures on Health as per cent of THE 6. 3 6. 6 7 1. 1 5 Government Health Expenditure (GHE) per cent of THE 30. 6 29 28. 6 22. 5 6 Out of Pocket Expenditures (OOPE) as per cent of THE 60. 6 62. 6 64. 2 69. 4 7 Social Security Expenditure on Health as per cent of THE 6. 3 6 6 4. 2 8 Private Health Insurance Expenditures as per cent of THE 4. 2 4 3. 4 1. 6 9 External/ Donor Funding for health as per cent of THE 0. 7 0. 3 2. 3
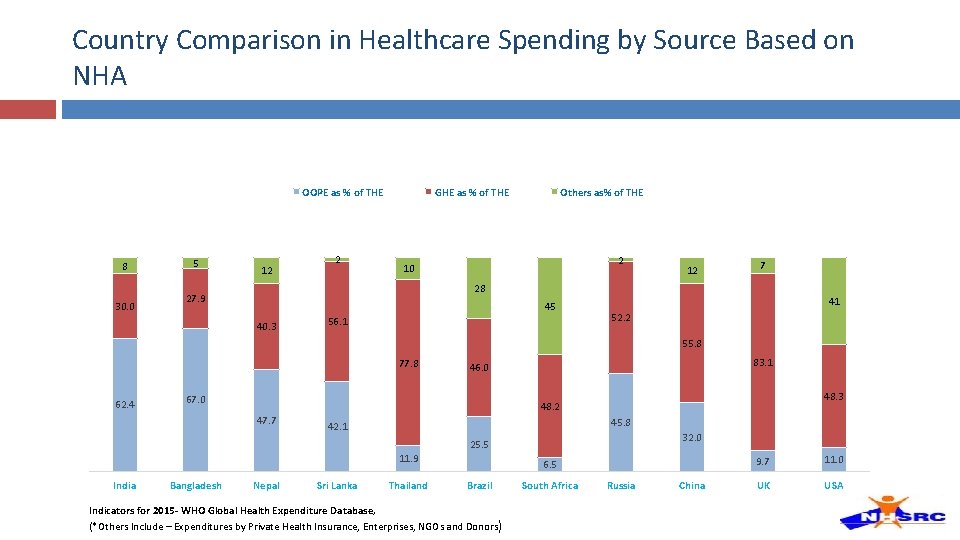
Country Comparison in Healthcare Spending by Source Based on NHA OOPE as % of THE 8 30. 0 5 12 2 GHE as % of THE Others as% of THE 2 10 12 7 28 27. 9 45 40. 3 56. 1 41 52. 2 55. 8 77. 8 62. 4 83. 1 46. 0 67. 0 48. 3 48. 2 47. 7 45. 8 42. 1 32. 0 25. 5 11. 9 India Bangladesh Nepal Sri Lanka Thailand 6. 5 Brazil Indicators for 2015 - WHO Global Health Expenditure Database, (*Others Include – Expenditures by Private Health Insurance, Enterprises, NGOs and Donors) South Africa Russia China 9. 7 11. 0 UK USA
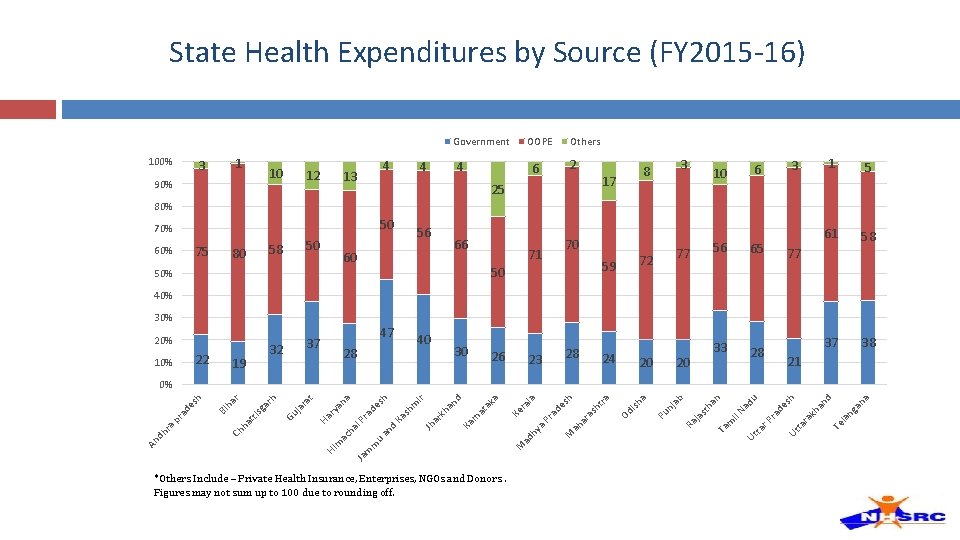
State Health Expenditures by Source (FY 2015 -16) Government 100% 3 1 10 90% 12 4 13 4 OOPE 4 Others 2 6 17 25 3 8 3 6 10 1 5 61 58 37 38 80% 50 70% 75 60% 50 58 80 56 60 66 70 71 59 50 50% 72 77 56 65 33 28 77 40% 30% 22 10% 32 19 47 37 28 40 30 26 28 23 24 20 20 21 *Others Include – Private Health Insurance, Enterprises, NGOs and Donors. Figures may not sum up to 100 due to rounding off. na ng a la nd Te ak ha sh Ut ta r ra de r P Ut ta il N ad u n m st ha ja Pu nj Od ish a ab Ra Ta M ah ar ra a P ad hy M as ht ra h de s la ra Ja m m u ha l P Ke ra de sh an d Ka sh m ir Jh ar kh an d Ka rn at ak a a an ry ac ra h ar sg Gu ja Ha m Ch ha tti Bi ha r t Hi An dh r a p ra de sh 0%
Allocation on Health
Catastrophic Expenditure Percentage of Household Undergoing Catastrophic Expenditure at 10% cut off in 2011 -12 Kerala Uttar Pradesh Punjab Andhra Pradesh West Bengal Tamil Nadu Maharashtra Odisha Rajasthan Madhya Pradesh Himachal Pradesh Chhattisgarh Gujarat Bihar Haryana Jharkhand Uttarakhand Jammu and Kashmir Karnataka India 0 5 10 15 20 25 30 35
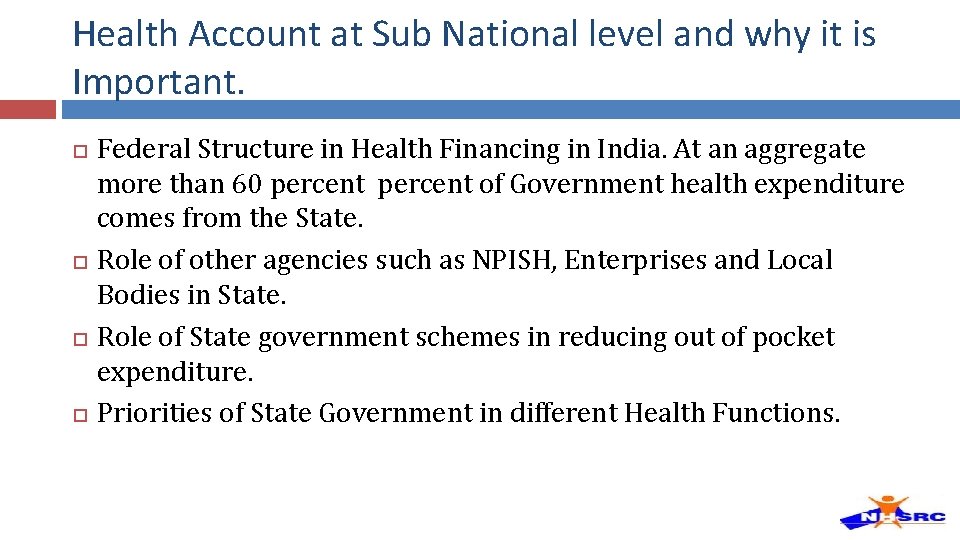
Health Account at Sub National level and why it is Important. Federal Structure in Health Financing in India. At an aggregate more than 60 percent of Government health expenditure comes from the State. Role of other agencies such as NPISH, Enterprises and Local Bodies in State. Role of State government schemes in reducing out of pocket expenditure. Priorities of State Government in different Health Functions.
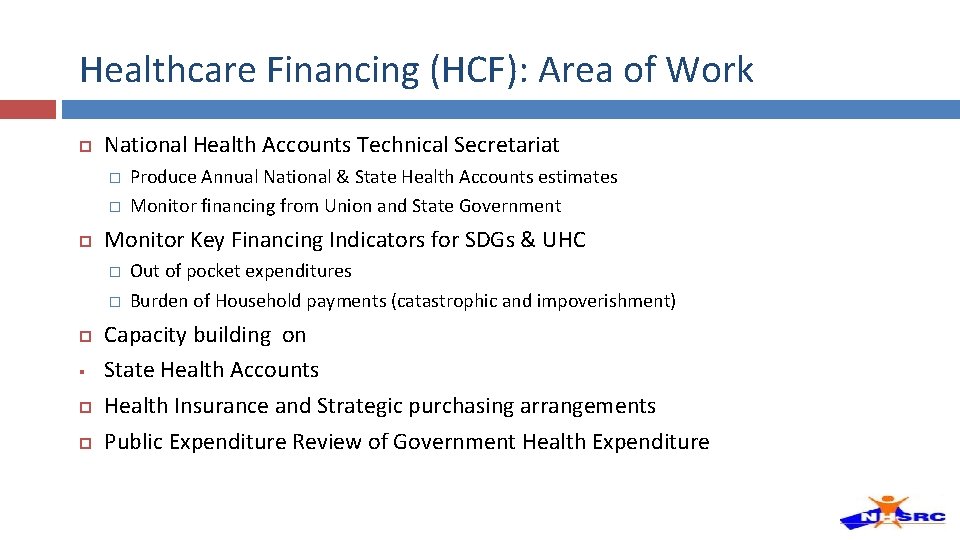
Healthcare Financing (HCF): Area of Work National Health Accounts Technical Secretariat � � Monitor Key Financing Indicators for SDGs & UHC � � § Produce Annual National & State Health Accounts estimates Monitor financing from Union and State Government Out of pocket expenditures Burden of Household payments (catastrophic and impoverishment) Capacity building on State Health Accounts Health Insurance and Strategic purchasing arrangements Public Expenditure Review of Government Health Expenditure
Present Engagement and Studies Planned NHA 2016 -17 State Heath Account (2017 -18) Mizoram and Karnataka Financial Protection Indicators based on NSSO, 2017 -18. Utilisation and OOP survey for ILCs. Analysis of Public Expenditure on Health in LMIC countries using the GHED Data. Evaluate and Monitor NHM Health financing. Creation of Data repository of all the NHA data from 2013 -14 to present. Study based on insurance data Evaluation of PPP Models
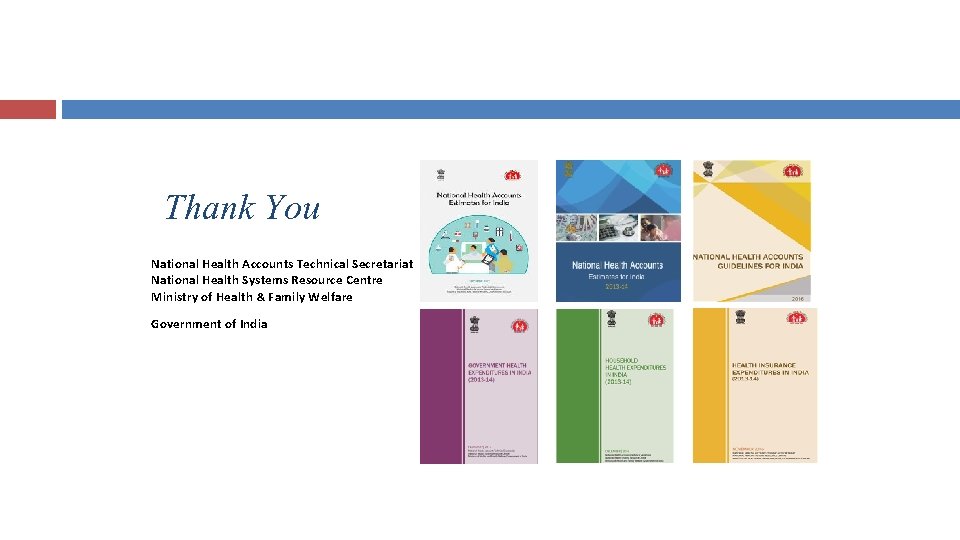
Thank You National Health Accounts Technical Secretariat National Health Systems Resource Centre Ministry of Health & Family Welfare Government of India