Meta Eval A JMP AddIn to evaluate a
- Slides: 12
Meta. Eval: A JMP Add-In to evaluate a claim coming from a meta-analysis S. Stanley Young CGStat genetree@bellsouth. net Paul Fogel Consultant, Paris, France JMP Discovery Summit Cary, NC 10/23 -26/2018 1
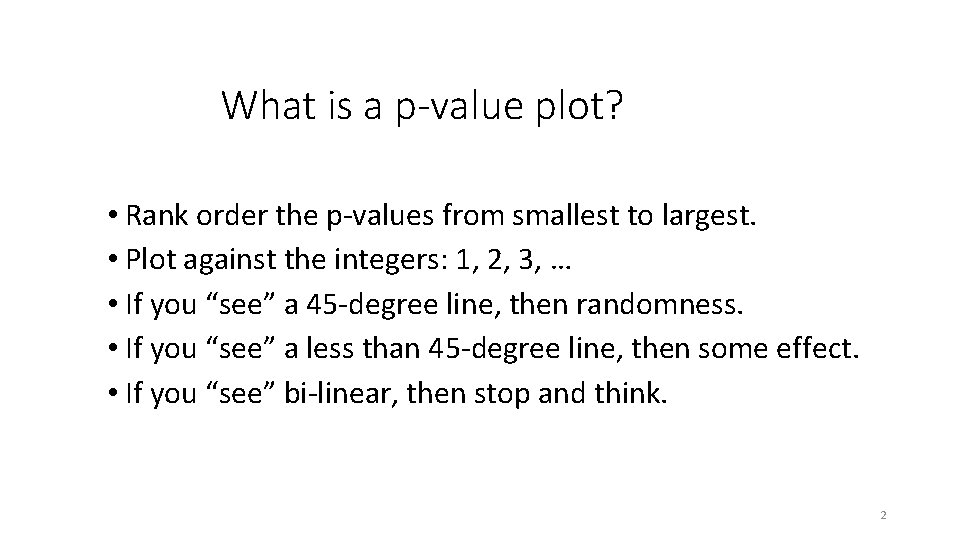
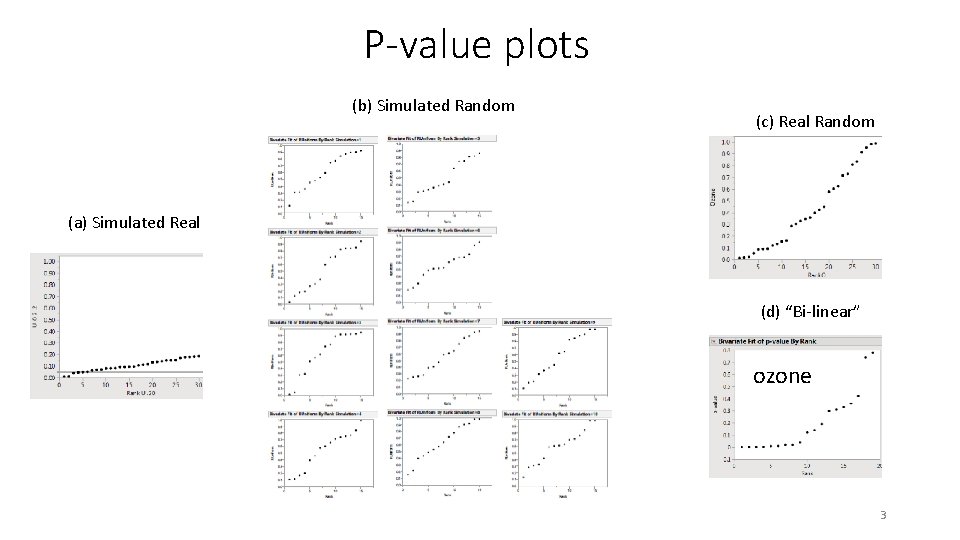
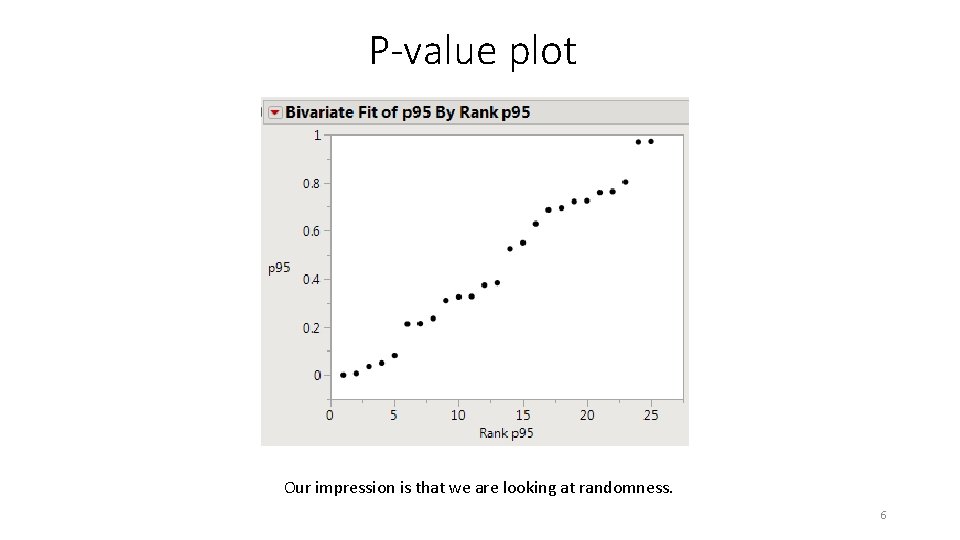
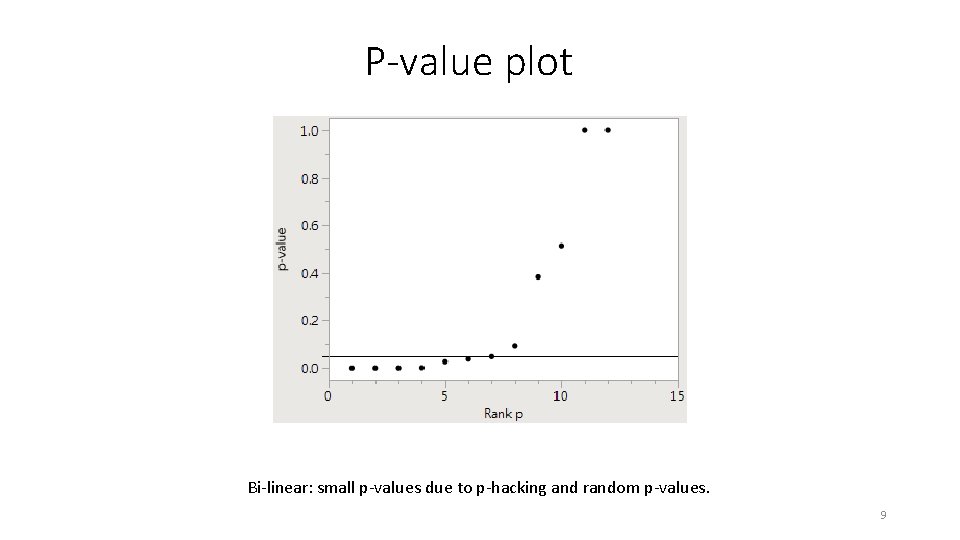
What is a p-value plot? • Rank order the p-values from smallest to largest. • Plot against the integers: 1, 2, 3, … • If you “see” a 45 -degree line, then randomness. • If you “see” a less than 45 -degree line, then some effect. • If you “see” bi-linear, then stop and think. 2
P-value plots (b) Simulated Random (c) Real Random (a) Simulated Real (d) “Bi-linear” ozone 3
What is a meta-analysis? 1. 2. 3. 4. 5. Pick a question Computer search the literature Select papers (selection bias) Combine the individual results Publish a paper Cookbook: A team can publish one paper week. Google Scholar search for “meta-analysis” => 3. 3 M 4
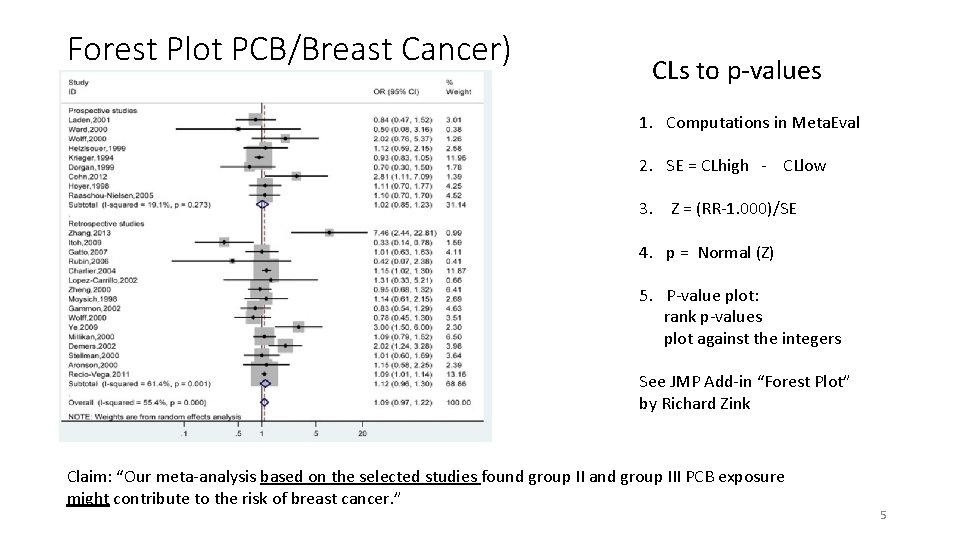
Forest Plot PCB/Breast Cancer) CLs to p-values 1. Computations in Meta. Eval 2. SE = CLhigh - CLlow 3. Z = (RR-1. 000)/SE 4. p = Normal (Z) 5. P-value plot: rank p-values plot against the integers See JMP Add-in “Forest Plot” by Richard Zink Claim: “Our meta-analysis based on the selected studies found group II and group III PCB exposure might contribute to the risk of breast cancer. ” 5
P-value plot Our impression is that we are looking at randomness. 6
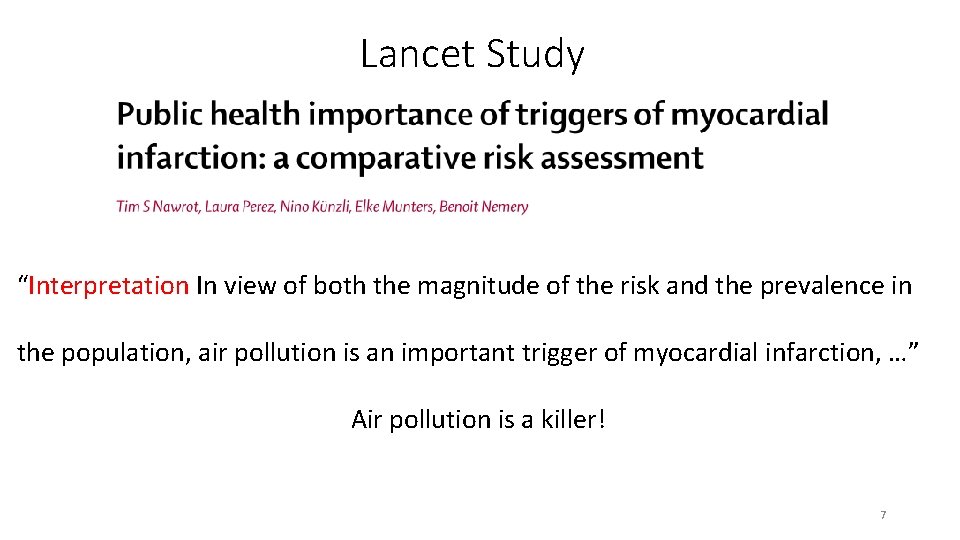
Lancet Study “Interpretation In view of both the magnitude of the risk and the prevalence in the population, air pollution is an important trigger of myocardial infarction, …” Air pollution is a killer! 7
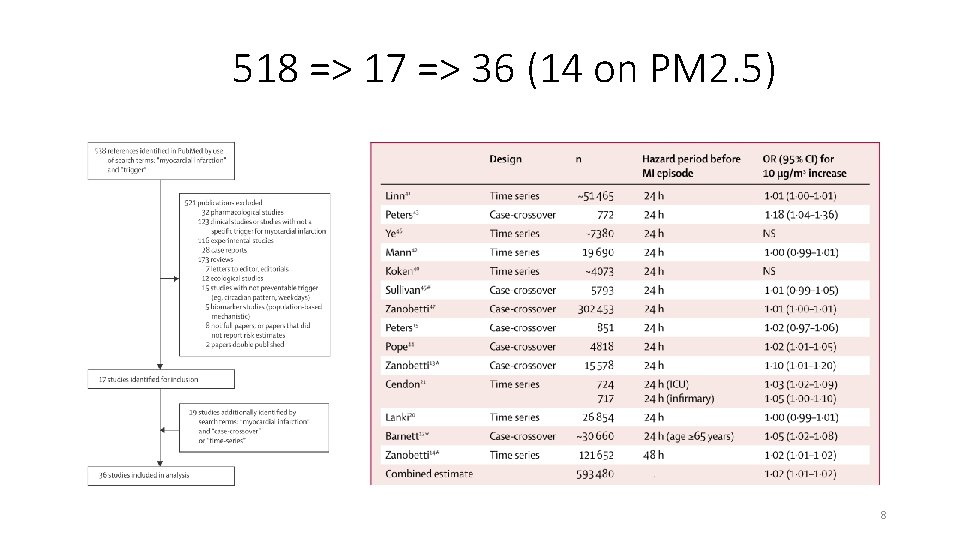
518 => 17 => 36 (14 on PM 2. 5) 8
P-value plot Bi-linear: small p-values due to p-hacking and random p-values. 9
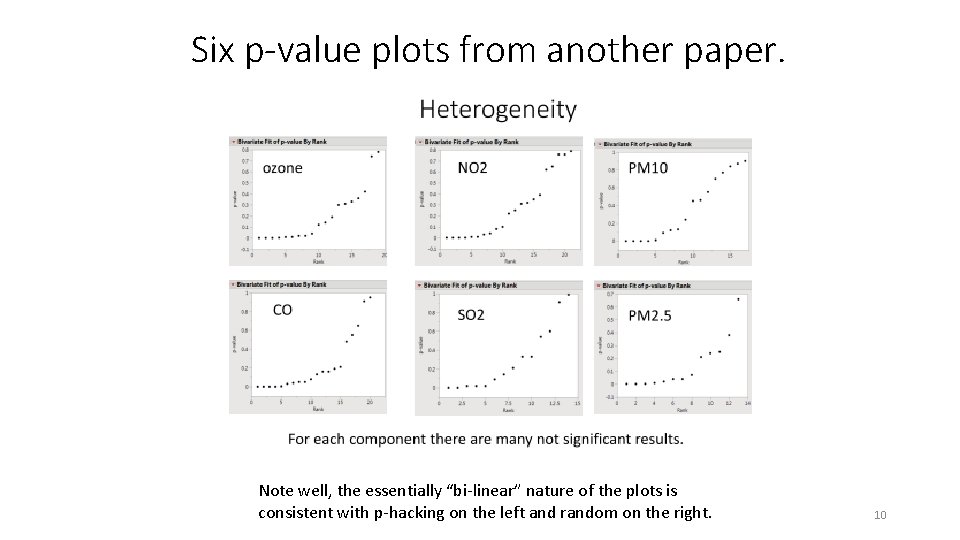
Six p-value plots from another paper. Note well, the essentially “bi-linear” nature of the plots is consistent with p-hacking on the left and random on the right. 10
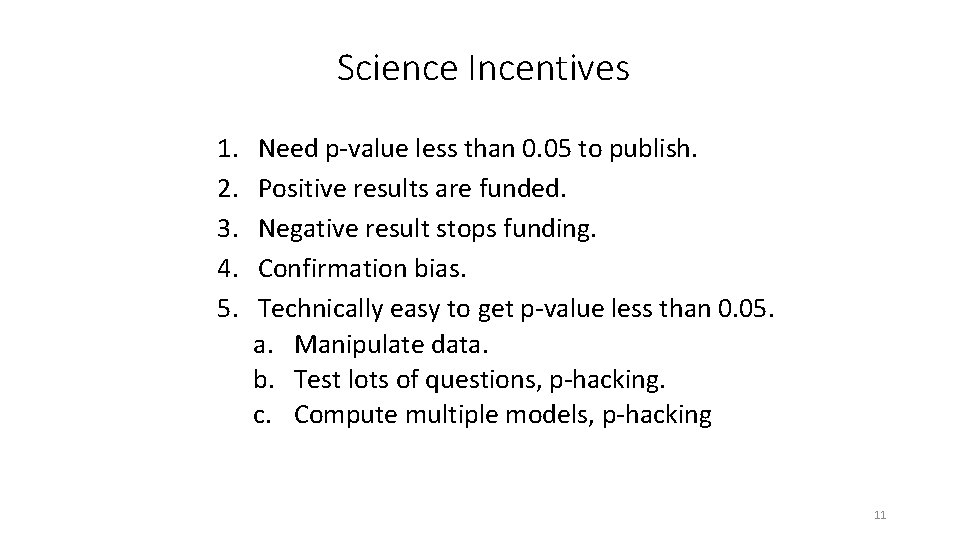
Science Incentives 1. 2. 3. 4. 5. Need p-value less than 0. 05 to publish. Positive results are funded. Negative result stops funding. Confirmation bias. Technically easy to get p-value less than 0. 05. a. Manipulate data. b. Test lots of questions, p-hacking. c. Compute multiple models, p-hacking 11
Information § Stan Young, genetree@bellsouth. net § Paul Fogel, paul_fogel@hotmail. com § JMP Add-in to go from RR, CLs to p-values is available from the author. § Virtually all observational studies do not correct for multiple testing. § P-value plots appear to be a sensitive way to check heterogeneity. § This area is wide open. § Young is willing to collaborate. 12