Logistics and Construction Supply Chains Scott J Mason
- Slides: 12
Logistics and Construction Supply Chains Scott J. Mason, Ph. D. Fluor Endowed Chair in Supply Chain Optimization and Logistics Professor of Industrial Engineering
Overview • Construction supply chain management research has focused on one element of the delivery chain, the contractor • Supply chains should not be viewed from the perspective of a single organization and its ability to control other firms • Necessary to examine all links of the supply chain cutting across organizational and industrial boundaries Scott J. Mason, mason@clemson. edu 2
Builder’s Merchants • Some view the construction supply chain as a pyramid – At the apex sits the “major assembler, ” followed by successive tiers of subcontractors • Efficient information sharing ensures the major assembler is supplied with sub-assemblies, materials, and building components by first-tier suppliers – In the United Kingdom, builder’s merchants (BMs) represent the first-tier suppliers linking manufacturers and contractors Scott J. Mason, mason@clemson. edu 3
Two Way Flow • Due to their location in the supply chain, BMs must manage flow in two directions – Money and information upstream – Materials downstream • In contrast, contractors located at the end of the supply chain only manage upstream flow of money and information • BMs also known as “builders’ bankers” – They bear the cost and risk of holding contingency inventories Scott J. Mason, mason@clemson. edu 4
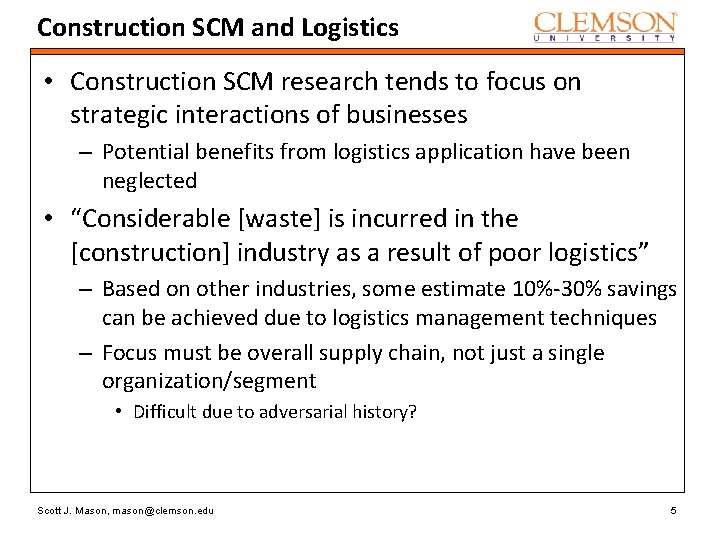
Construction SCM and Logistics • Construction SCM research tends to focus on strategic interactions of businesses – Potential benefits from logistics application have been neglected • “Considerable [waste] is incurred in the [construction] industry as a result of poor logistics” – Based on other industries, some estimate 10%-30% savings can be achieved due to logistics management techniques – Focus must be overall supply chain, not just a single organization/segment • Difficult due to adversarial history? Scott J. Mason, mason@clemson. edu 5
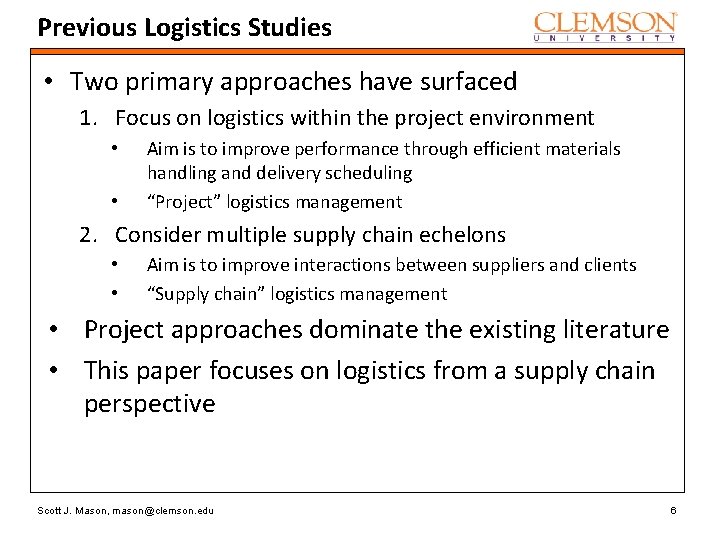
Previous Logistics Studies • Two primary approaches have surfaced 1. Focus on logistics within the project environment • • Aim is to improve performance through efficient materials handling and delivery scheduling “Project” logistics management 2. Consider multiple supply chain echelons • • Aim is to improve interactions between suppliers and clients “Supply chain” logistics management • Project approaches dominate the existing literature • This paper focuses on logistics from a supply chain perspective Scott J. Mason, mason@clemson. edu 6
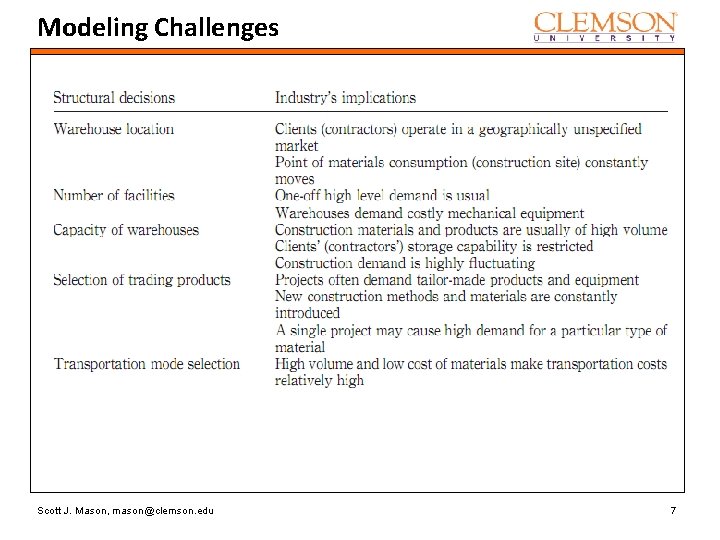
Modeling Challenges Scott J. Mason, mason@clemson. edu 7
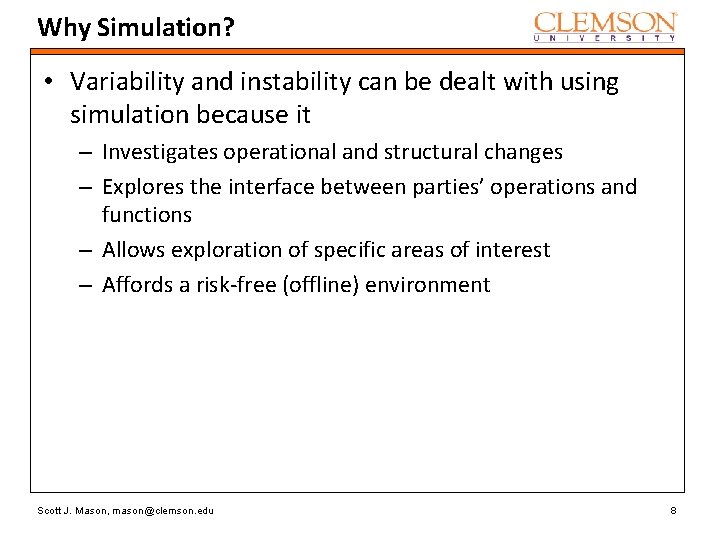
Why Simulation? • Variability and instability can be dealt with using simulation because it – Investigates operational and structural changes – Explores the interface between parties’ operations and functions – Allows exploration of specific areas of interest – Affords a risk-free (offline) environment Scott J. Mason, mason@clemson. edu 8
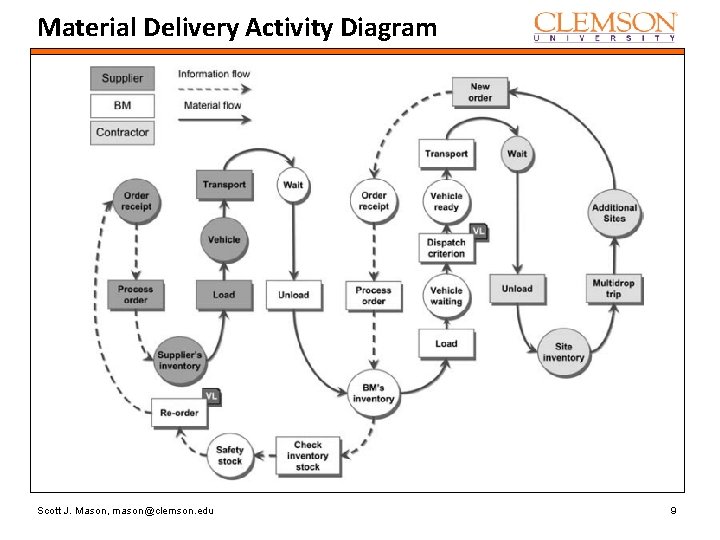
Material Delivery Activity Diagram Scott J. Mason, mason@clemson. edu 9
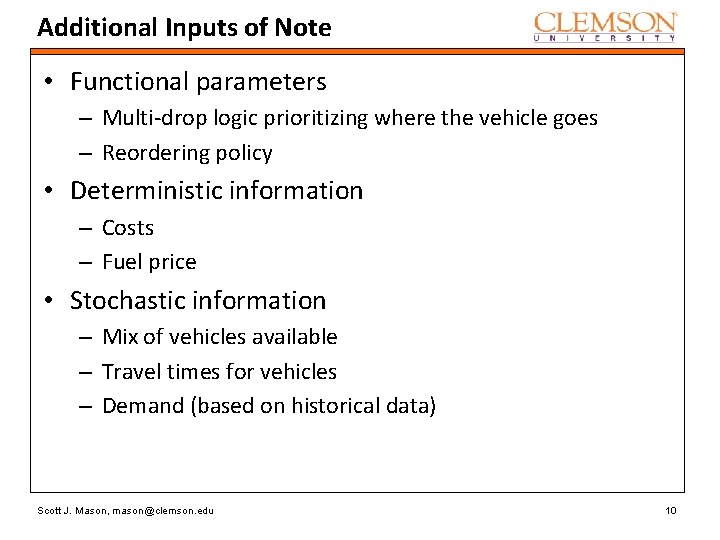
Additional Inputs of Note • Functional parameters – Multi-drop logic prioritizing where the vehicle goes – Reordering policy • Deterministic information – Costs – Fuel price • Stochastic information – Mix of vehicles available – Travel times for vehicles – Demand (based on historical data) Scott J. Mason, mason@clemson. edu 10
Really? • Figure 2 shows a continuous line drawn through discrete experimental points – If a line fit was found, this should be annotated • Two different exponential models were fit with a coefficient of determination R 2=0. 99 – “seem to fit the data very well” • This is beyond the realm of expected goodness! Scott J. Mason, mason@clemson. edu 11
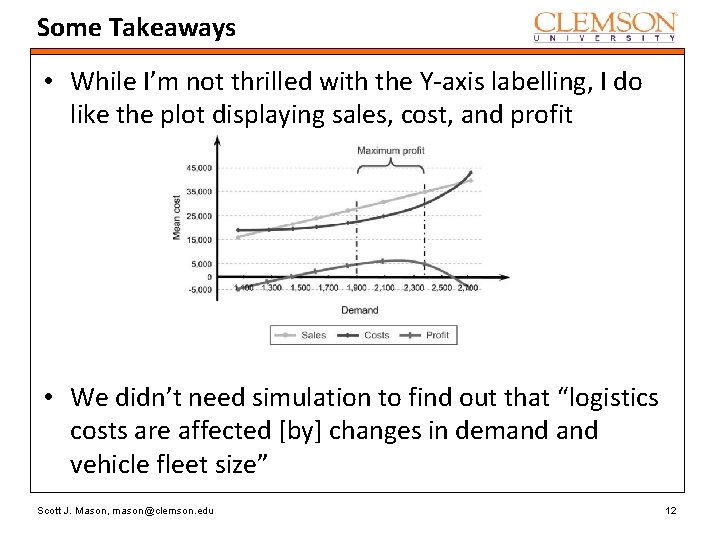
Some Takeaways • While I’m not thrilled with the Y-axis labelling, I do like the plot displaying sales, cost, and profit • We didn’t need simulation to find out that “logistics costs are affected [by] changes in demand vehicle fleet size” Scott J. Mason, mason@clemson. edu 12