League of Legends Game Analytics Project 4 IMGD
- Slides: 14
League of Legends Game Analytics Project 4 IMGD 2905
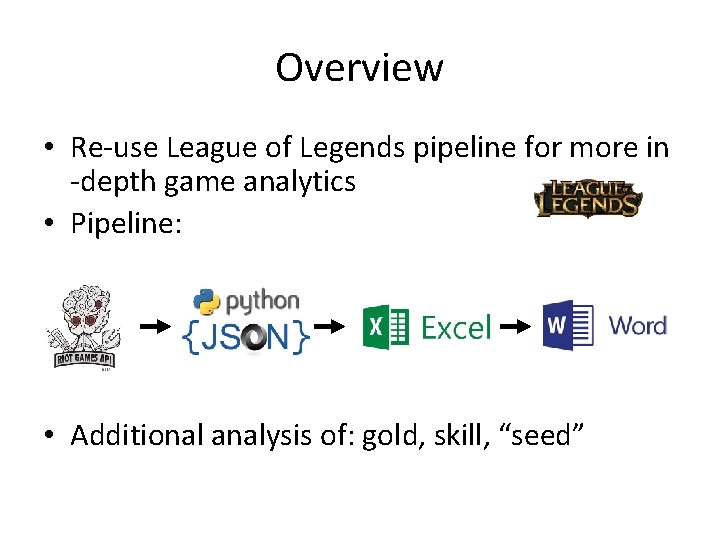
Overview • Re-use League of Legends pipeline for more in -depth game analytics • Pipeline: • Additional analysis of: gold, skill, “seed”
Parts • • Part 0 - Setup Part 1 - Gold Part 2 - Skill Part 3 - Seed Part 4 - Puck. Hunt Writeup Submission Grading
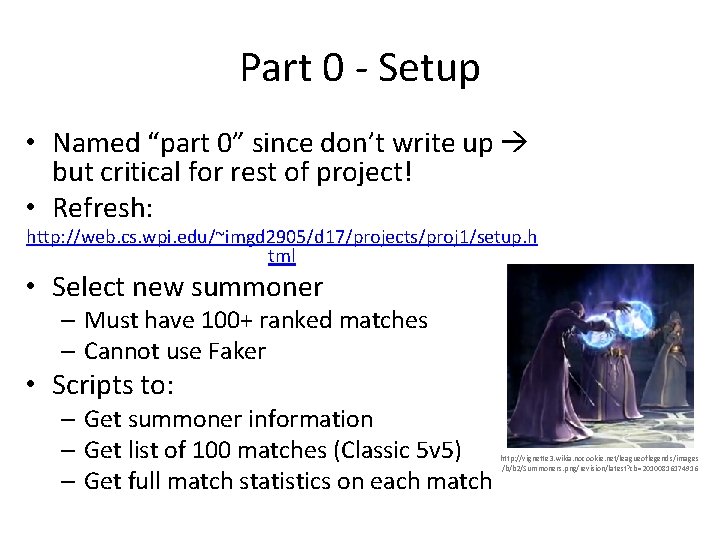
Part 0 - Setup • Named “part 0” since don’t write up but critical for rest of project! • Refresh: http: //web. cs. wpi. edu/~imgd 2905/d 17/projects/proj 1/setup. h tml • Select new summoner – Must have 100+ ranked matches – Cannot use Faker • Scripts to: – Get summoner information – Get list of 100 matches (Classic 5 v 5) – Get full match statistics on each match http: //vignette 3. wikia. nocookie. net/leagueoflegends/images /b/b 2/Summoners. png/revision/latest? cb=20100816174916
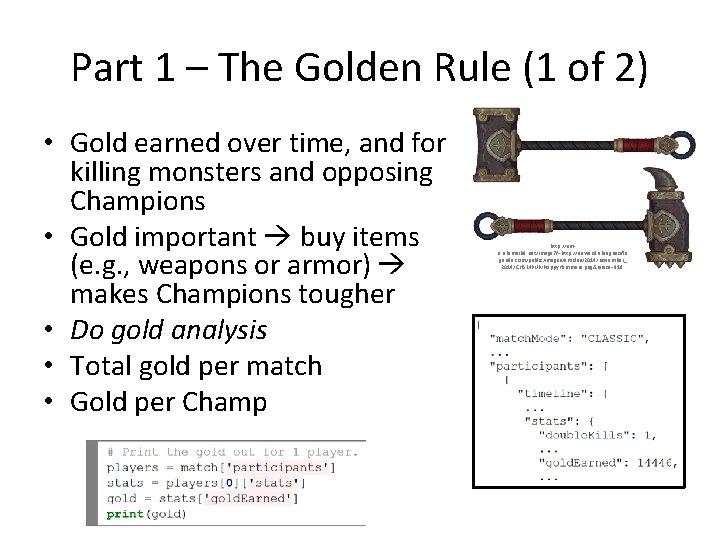
Part 1 – The Golden Rule (1 of 2) • Gold earned over time, and for killing monsters and opposing Champions • Gold important buy items (e. g. , weapons or armor) makes Champions tougher • Do gold analysis • Total gold per match • Gold per Champ http: //ama. akamaihd. net/image? f=http: //news. cdn. leagueofle gends. com/public/images/articles/2014/november_ 2014/CHAMPUP/Poppy. Hammers. png&resize=819:
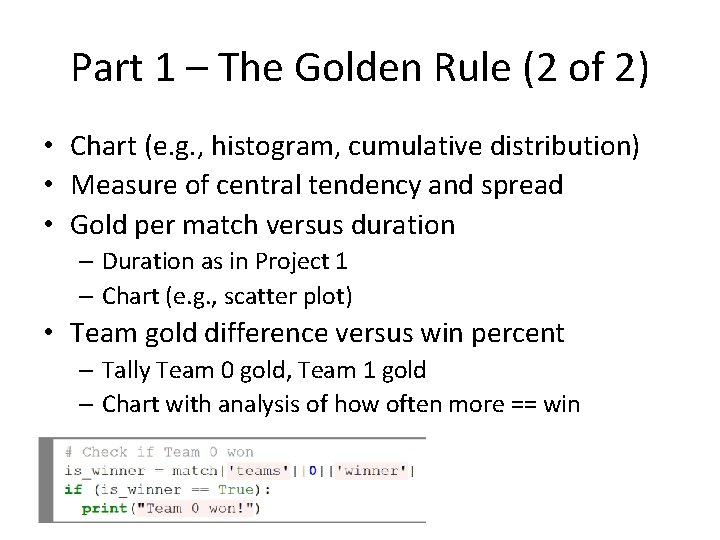
Part 1 – The Golden Rule (2 of 2) • Chart (e. g. , histogram, cumulative distribution) • Measure of central tendency and spread • Gold per match versus duration – Duration as in Project 1 – Chart (e. g. , scatter plot) • Team gold difference versus win percent – Tally Team 0 gold, Team 1 gold – Chart with analysis of how often more == win
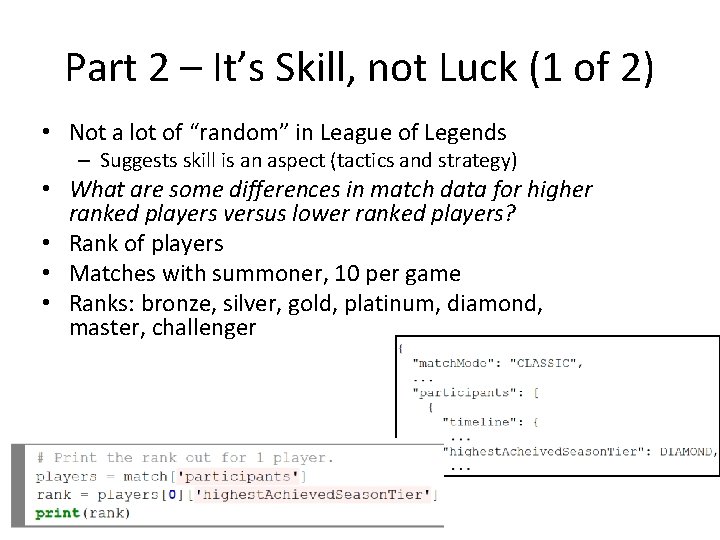
Part 2 – It’s Skill, not Luck (1 of 2) • Not a lot of “random” in League of Legends – Suggests skill is an aspect (tactics and strategy) • What are some differences in match data for higher ranked players versus lower ranked players? • Rank of players • Matches with summoner, 10 per game • Ranks: bronze, silver, gold, platinum, diamond, master, challenger
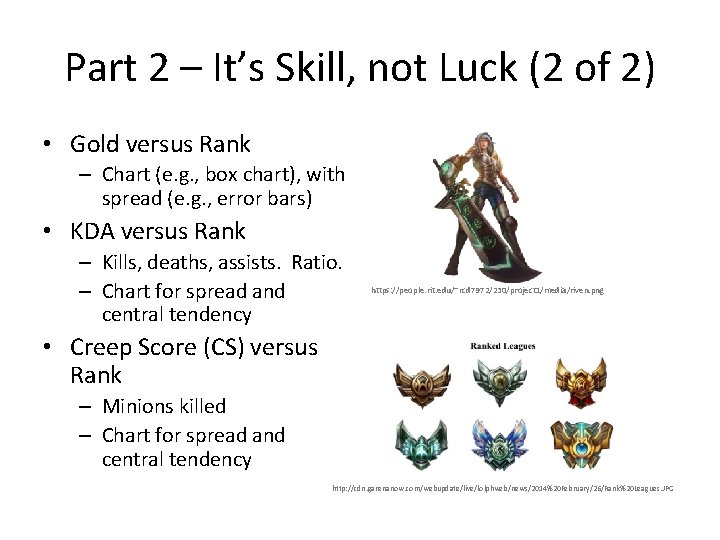
Part 2 – It’s Skill, not Luck (2 of 2) • Gold versus Rank – Chart (e. g. , box chart), with spread (e. g. , error bars) • KDA versus Rank – Kills, deaths, assists. Ratio. – Chart for spread and central tendency https: //people. rit. edu/~rcd 7972/230/project 1/media/riven. png • Creep Score (CS) versus Rank – Minions killed – Chart for spread and central tendency http: //cdn. garenanow. com/webupdate/live/lolphweb/news/2014%20 February/26/Rank%20 Leagues. JPG
Part 3 – A Bad Seed? • 100 matches, 1000 players • But based on summoner chosen • How much does that matter? • Swap data with classmate – Part 1 or Part 2 http: //vignette 3. wikia. nocookie. net/leagueoflegends/images /b/b 2/Summoners. png/revision/latest? cb=20100816174916 – Not “raw” data, but ready to draw charat • Compare to your data – e. g. , side by side or two trend lines http: //vignette 3. wikia. nocookie. net/leagueoflegends/images /b/b 2/Summoners. png/revision/latest? cb=20100816174916
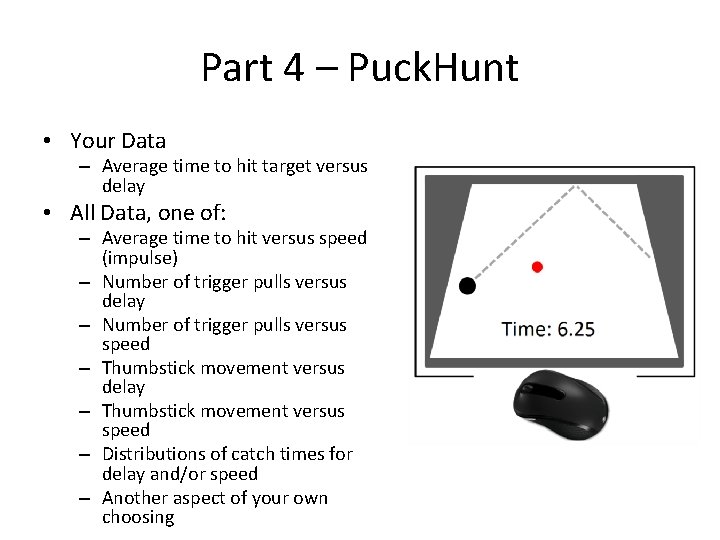
Part 4 – Puck. Hunt • Your Data – Average time to hit target versus delay • All Data, one of: – Average time to hit versus speed (impulse) – Number of trigger pulls versus delay – Number of trigger pulls versus speed – Thumbstick movement versus delay – Thumbstick movement versus speed – Distributions of catch times for delay and/or speed – Another aspect of your own choosing
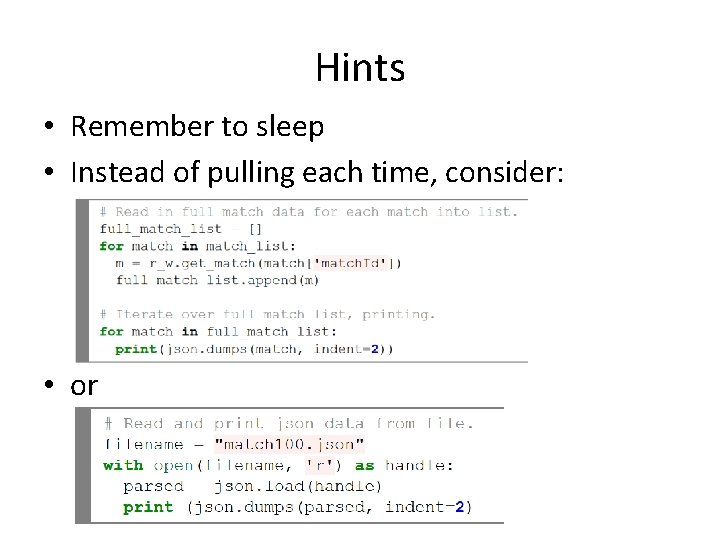
Hints • Remember to sleep • Instead of pulling each time, consider: • or
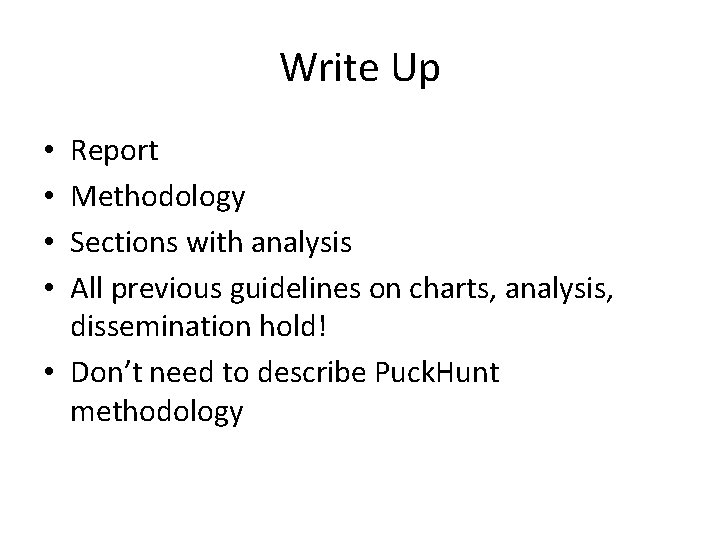
Write Up Report Methodology Sections with analysis All previous guidelines on charts, analysis, dissemination hold! • Don’t need to describe Puck. Hunt methodology • •
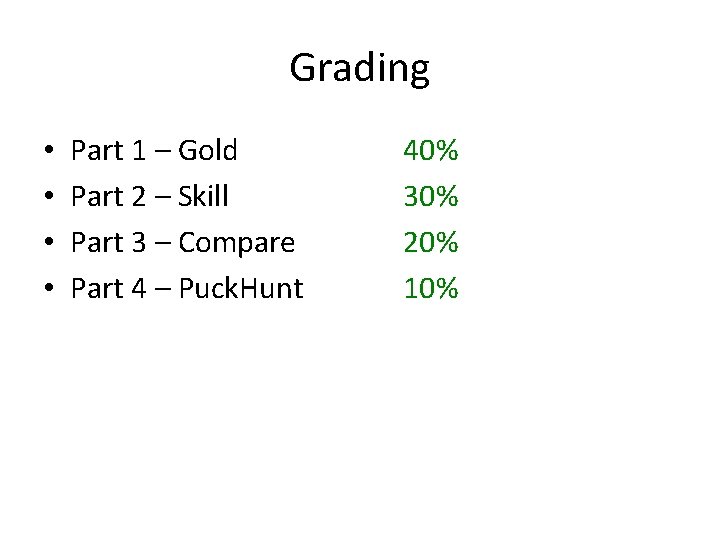
Grading • • Part 1 – Gold Part 2 – Skill Part 3 – Compare Part 4 – Puck. Hunt 40% 30% 20% 10%
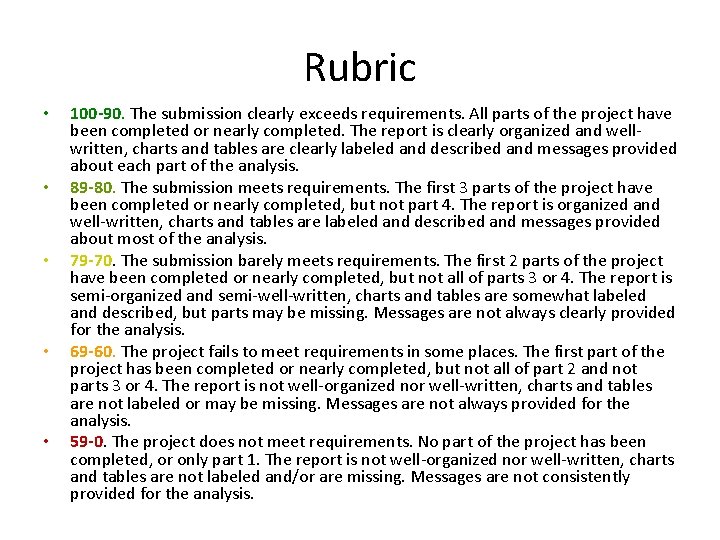
Rubric • • • 100 -90. The submission clearly exceeds requirements. All parts of the project have been completed or nearly completed. The report is clearly organized and wellwritten, charts and tables are clearly labeled and described and messages provided about each part of the analysis. 89 -80. The submission meets requirements. The first 3 parts of the project have been completed or nearly completed, but not part 4. The report is organized and well-written, charts and tables are labeled and described and messages provided about most of the analysis. 79 -70. The submission barely meets requirements. The first 2 parts of the project have been completed or nearly completed, but not all of parts 3 or 4. The report is semi-organized and semi-well-written, charts and tables are somewhat labeled and described, but parts may be missing. Messages are not always clearly provided for the analysis. 69 -60. The project fails to meet requirements in some places. The first part of the project has been completed or nearly completed, but not all of part 2 and not parts 3 or 4. The report is not well-organized nor well-written, charts and tables are not labeled or may be missing. Messages are not always provided for the analysis. 59 -0. The project does not meet requirements. No part of the project has been completed, or only part 1. The report is not well-organized nor well-written, charts and tables are not labeled and/or are missing. Messages are not consistently provided for the analysis.