Introduction to Educational Research 6 th ed Craig

- Slides: 12
Introduction to Educational Research (6 th ed. ) Craig A. Mertler & C. M. Charles Chapter 8 This multimedia product and its contents are protected under copyright law. The following are prohibited by law: • Any public performance or display, including transmission of any image over a network; • Preparation of any derivative work, including the extraction, in whole or in part, of any images; • Any rental, lease, or lending of the program. Analyzing Research Data and Presenting Findings 1
Qualitative versus Quantitative Data • Qualitative data » Analyzed inductively—thought process using logic to make sense of observations » Goal is to uncover patterns, themes, categories, etc. • Quantitative data » Analyzed mathematically » Goal is to describe data, show degree of relationship or difference, & determine likelihood that sample findings also exist in population 2 Copyright © Allyn & Bacon 2008
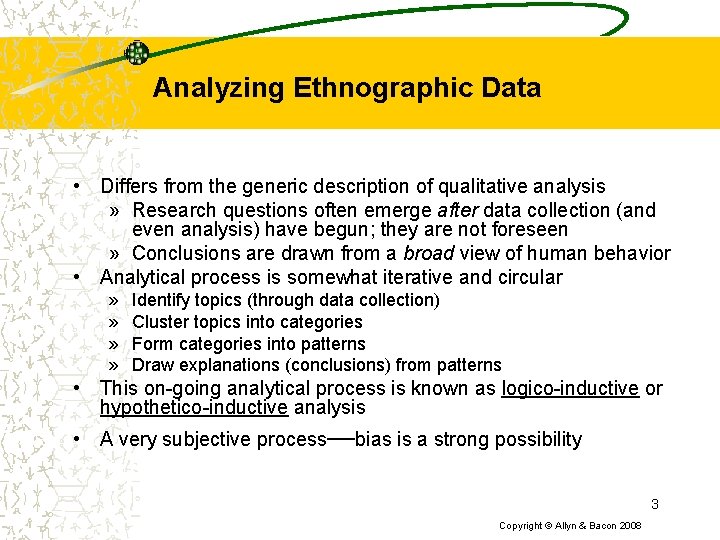
Analyzing Ethnographic Data • Differs from the generic description of qualitative analysis » Research questions often emerge after data collection (and even analysis) have begun; they are not foreseen » Conclusions are drawn from a broad view of human behavior • Analytical process is somewhat iterative and circular » » Identify topics (through data collection) Cluster topics into categories Form categories into patterns Draw explanations (conclusions) from patterns • This on-going analytical process is known as logico-inductive or hypothetico-inductive analysis • A very subjective process—bias is a strong possibility 3 Copyright © Allyn & Bacon 2008
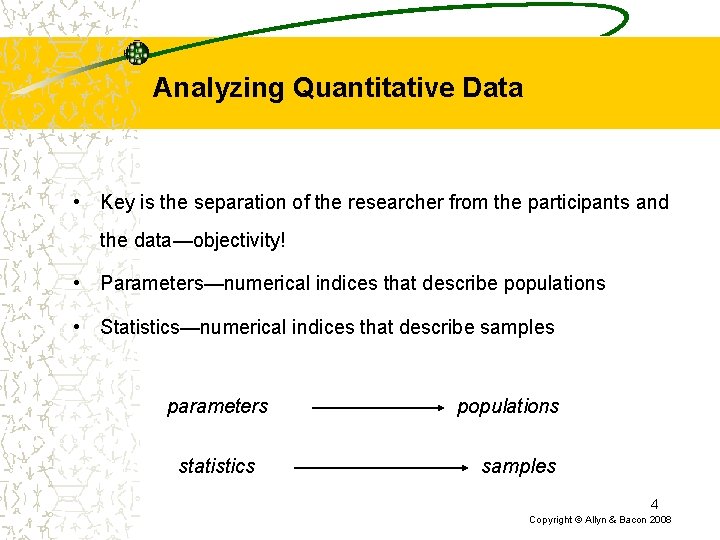
Analyzing Quantitative Data • Key is the separation of the researcher from the participants and the data—objectivity! • Parameters—numerical indices that describe populations • Statistics—numerical indices that describe samples parameters statistics populations samples 4 Copyright © Allyn & Bacon 2008
What Statistics Are Used For • To summarize data in order to reveal what is typical and atypical about a group • To show relative standing of individuals in a group • To show relationships among variables • To show similarities and differences among groups • To identify error inherent in sample selection • To test for significance of findings • To make inferences about a population 5
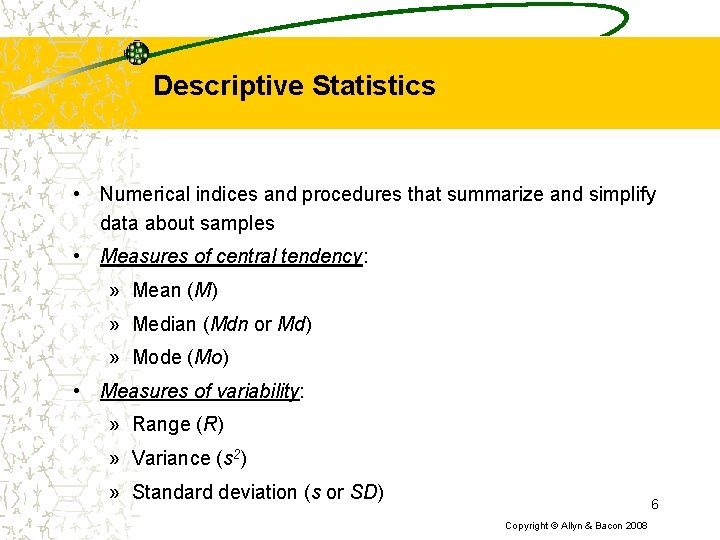
Descriptive Statistics • Numerical indices and procedures that summarize and simplify data about samples • Measures of central tendency: » Mean (M) » Median (Mdn or Md) » Mode (Mo) • Measures of variability: » Range (R) » Variance (s 2) » Standard deviation (s or SD) 6 Copyright © Allyn & Bacon 2008
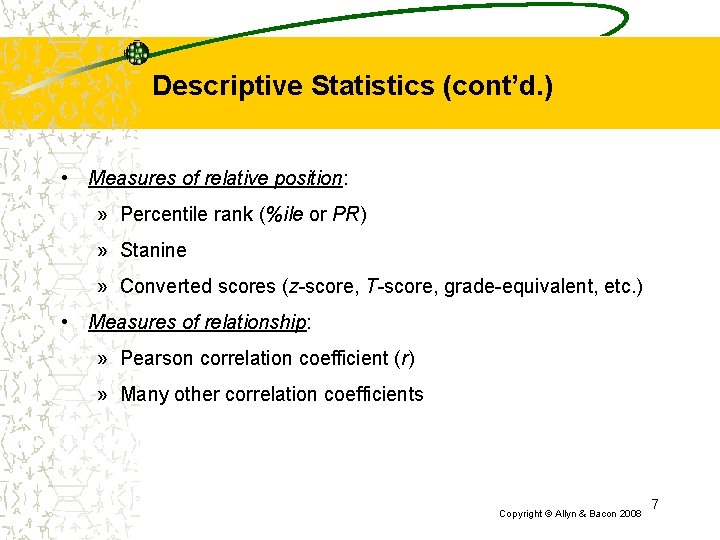
Descriptive Statistics (cont’d. ) • Measures of relative position: » Percentile rank (%ile or PR) » Stanine » Converted scores (z-score, T-score, grade-equivalent, etc. ) • Measures of relationship: » Pearson correlation coefficient (r) » Many other correlation coefficients Copyright © Allyn & Bacon 2008 7
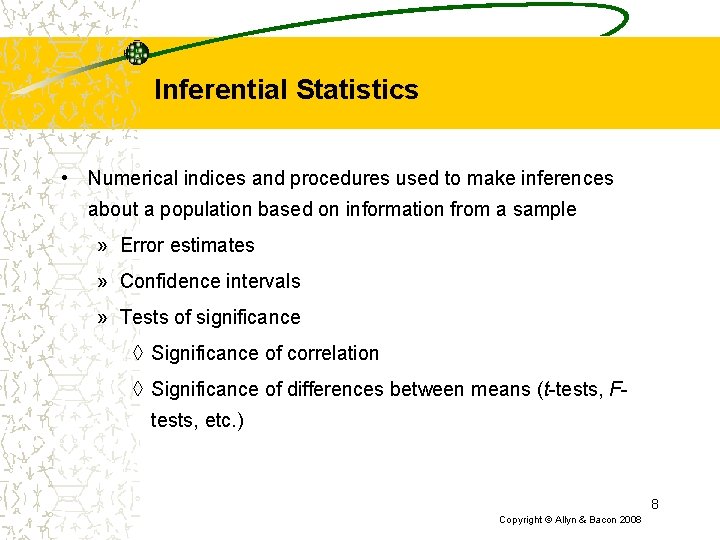
Inferential Statistics • Numerical indices and procedures used to make inferences about a population based on information from a sample » Error estimates » Confidence intervals » Tests of significance ◊ Significance of correlation ◊ Significance of differences between means (t-tests, Ftests, etc. ) 8 Copyright © Allyn & Bacon 2008
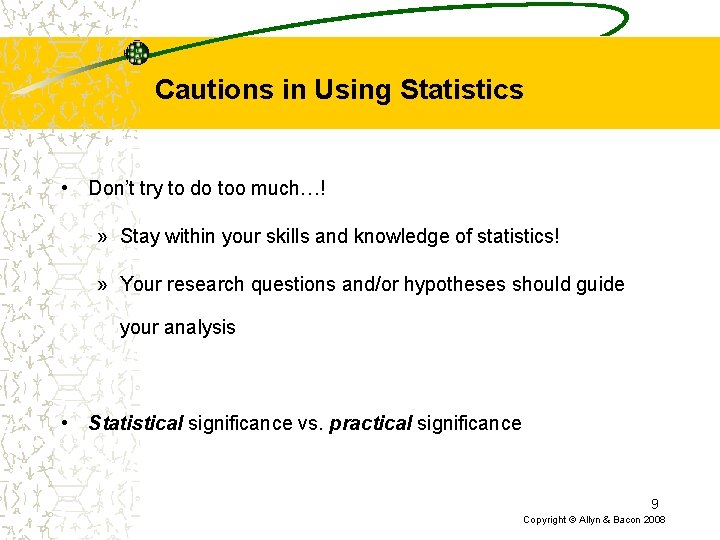
Cautions in Using Statistics • Don’t try to do too much…! » Stay within your skills and knowledge of statistics! » Your research questions and/or hypotheses should guide your analysis • Statistical significance vs. practical significance 9 Copyright © Allyn & Bacon 2008
Presenting Your Findings • Research findings are the information that results from your analysis • Findings from qualitative data analysis are usually presented as summary statements and discussion about the patterns which were observed • Findings from quantitative data analysis are typically presented in narrative form as well as visually (in tables or graphs) 10 Copyright © Allyn & Bacon 2008
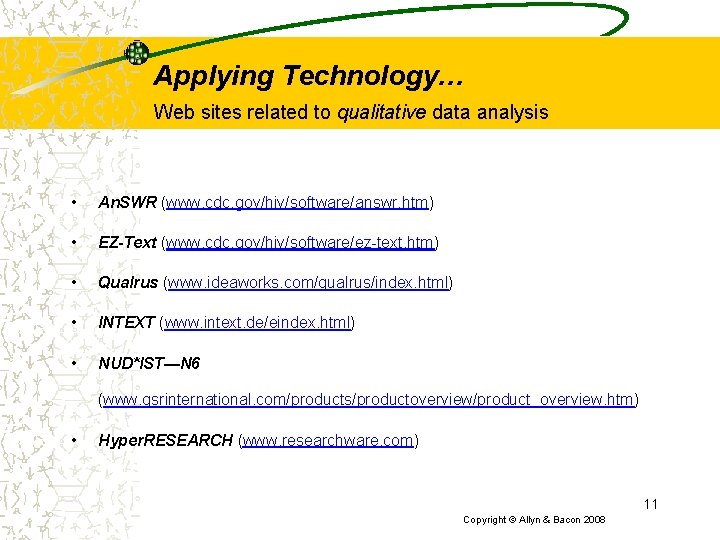
Applying Technology… Web sites related to qualitative data analysis • An. SWR (www. cdc. gov/hiv/software/answr. htm) • EZ-Text (www. cdc. gov/hiv/software/ez-text. htm) • Qualrus (www. ideaworks. com/qualrus/index. html) • INTEXT (www. intext. de/eindex. html) • NUD*IST—N 6 (www. qsrinternational. com/products/productoverview/product_overview. htm) • Hyper. RESEARCH (www. researchware. com) 11 Copyright © Allyn & Bacon 2008
Applying Technology… Web sites related to quantitative data analysis • Dr. Trochim’s discussion of "Data Preparation" (socialresearchmethods. net/kb/statprep. htm) • Dr. Trochim’s discussion of "Descriptive Statistics" (socialresearchmethods. net/kb/statdesc. htm) • Dr. Trochim’s discussion of ”Inferential Statistics" (socialresearchmethods. net/kb/statinf. htm) • Dr. Trochim’s discussion of "Correlation" (socialresearchmethods. net/kb/statcorr. htm) • Dr. David W. Stockburger’s online statistics textbook (business. clayton. edu/arjomand/book/sbk 00. htm) • Dr. David W. Stockburger’s bibliography and statistics web resources (business. clayton. edu/arjomand/book/biblio. htm) • Stat. Crunch online statistical analysis program (www. statcrunch. com/) • Dr. Trochim’s interactive page for "Selecting Statistics" (socialresearchmethods. net/selstat/ssstart. htm) 12 Copyright © Allyn & Bacon 2008