International Social Dialogue on Technical and Vocational Education




- Slides: 9
International Social Dialogue on Technical and Vocational Education and Training (TVET) Country Labour Markets and their TVET Systems (Ghana) By Dan Baffour-Awuah Executive Director-COTVET Country Labour Markets and their TVET Systems (Session One) 1
Context Government GDP per Capita Education Exp % GDP Population Average annual growth Executive US$16. 7 billion US$700 10. 1% 23. 4 million Population GDP per Capita 2. 2 7. 3% 5. 1% Agriculture Industry Services 33. 5% 25. 3% 41. 2% 56 years % of GDP Life expectancy Literacy Rate +15 yrs Country Labour Markets and their TVET Systems (Session One) 65% 2
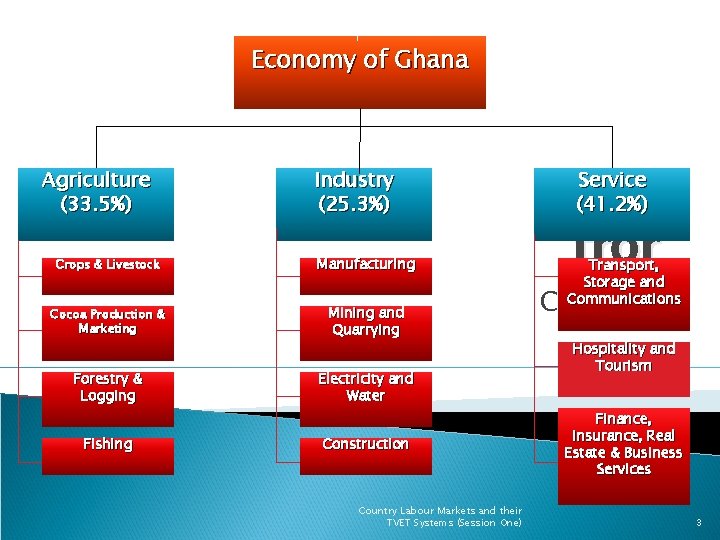
Economy of Ghana Agriculture (33. 5%) Industry (25. 3%) Crops & Livestock Manufacturing Cocoa Production & Marketing Mining and Quarrying Forestry & Logging Electricity and Water Fishing Construction Country Labour Markets and their TVET Systems (Session One) Service (41. 2%) fror Transport, Storage and Communications Crops da Hospitality and Tourism Finance, Insurance, Real Estate & Business Services 3
Pathways from Education to Employment in Ghana 5 Universities 10 Polytechnics 121. 000 Public Service Sector 2. 73 Mio 200 Public Providers 33. 000 670 Senior High Schools 490. 000 10. 213 Junior High Schools 1. 285. 000 Formal Private Sector 1. 85 Mio 430 Private Training Centres 34. 000 Traditional Apprenticeship System 225. 000 – 300. 000 Semi-Informal Micro Enterprises 4. 66 Mio National Functional Literacy Program 182. 000 17. 881 Primary Schools 3. 910. 000 Own Account Worker Country Labour Markets and their TVET Systems (Session One) Kf. W / PLANCO Hamburg 4
Educational Qualification of the Working Age Population in Ghana Educational Background Frequency Percentage No Basic Education 6821 53. 1 Basic Education 4120 32. 2 Secondary 1135 8. 9 Post Basic 553 4. 3 Higher Education 148 1. 2 37 0. 3 Others *Source GLSS (2005/06) Country Labour Markets and their TVET Systems (Session One) 5
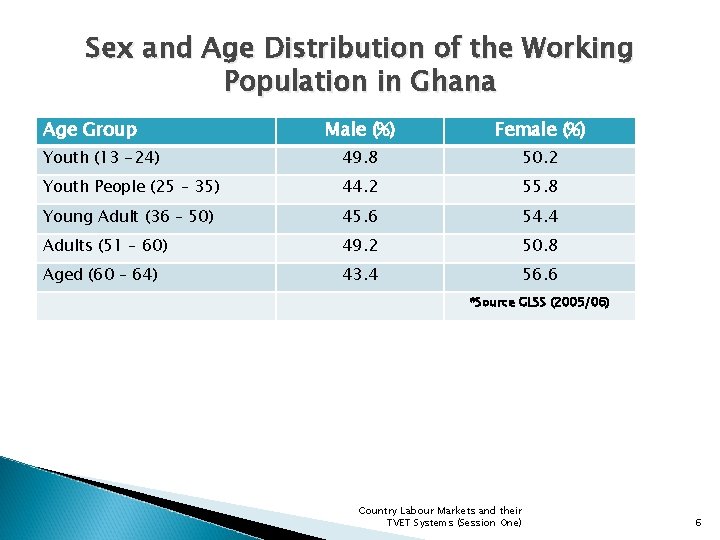
Sex and Age Distribution of the Working Population in Ghana Age Group Male (%) Female (%) Youth (13 -24) 49. 8 50. 2 Youth People (25 – 35) 44. 2 55. 8 Young Adult (36 – 50) 45. 6 54. 4 Adults (51 – 60) 49. 2 50. 8 Aged (60 – 64) 43. 4 56. 6 *Source GLSS (2005/06) Country Labour Markets and their TVET Systems (Session One) 6
Categories of Occupations of the Employed by Locality Main Occupation Urban Rural All Legislators and Managers 1. 1 0. 4 Professionals 5. 7 1. 3 2. 8 Technicians and Associate Professionals 4. 2 0. 9 2. 0 Clerks 2. 9 0. 2 1. 1 Service/Sales Workers 25. 9 6. 3 13. 0 Agric/Fishery 18. 6 74. 2 55. 1 Craft and Related Trade Workers 21. 7 9. 1 13. 4 6. 4 1. 6 3. 2 11. 4 6. 2 8. 0 2. 2 0. 3 0. 9 Plant and Machine Operators Elementary Occupations Armed Forces/Security Personnel *Source GLSS (2005/06) Country Labour Markets and their TVET Systems (Session One) 7
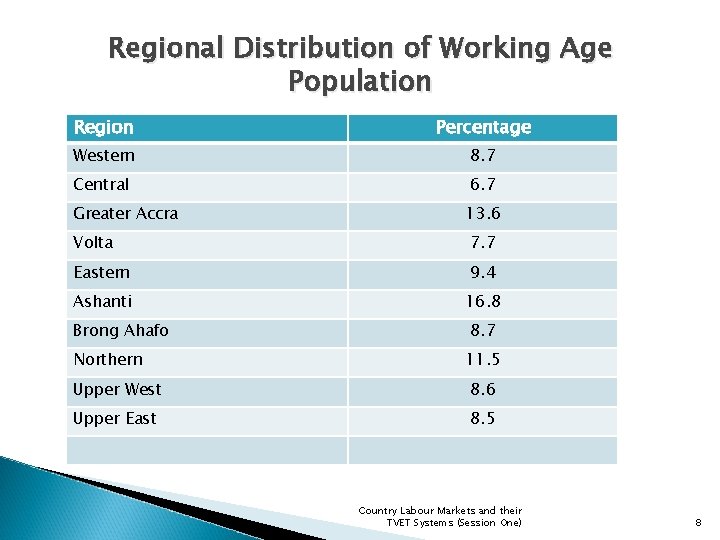
Regional Distribution of Working Age Population Region Percentage Western 8. 7 Central 6. 7 Greater Accra 13. 6 Volta 7. 7 Eastern 9. 4 Ashanti 16. 8 Brong Ahafo Northern 8. 7 11. 5 Upper West 8. 6 Upper East 8. 5 Country Labour Markets and their TVET Systems (Session One) 8
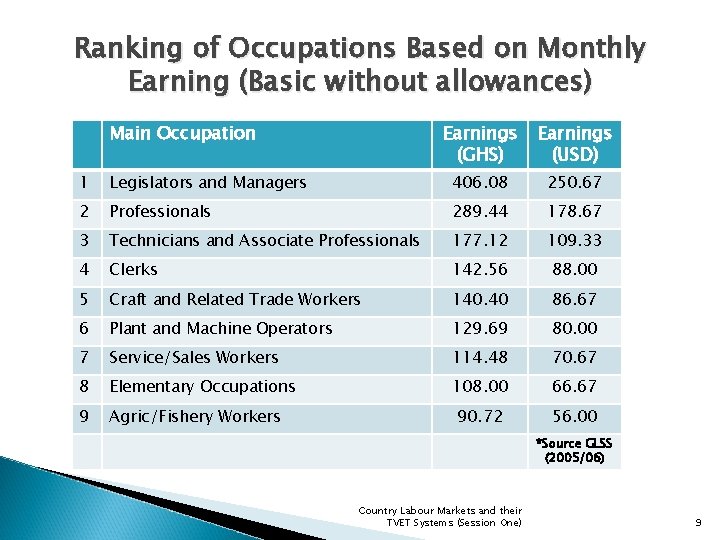
Ranking of Occupations Based on Monthly Earning (Basic without allowances) Main Occupation Earnings (GHS) Earnings (USD) 1 Legislators and Managers 406. 08 250. 67 2 Professionals 289. 44 178. 67 3 Technicians and Associate Professionals 177. 12 109. 33 4 Clerks 142. 56 88. 00 5 Craft and Related Trade Workers 140. 40 86. 67 6 Plant and Machine Operators 129. 69 80. 00 7 Service/Sales Workers 114. 48 70. 67 8 Elementary Occupations 108. 00 66. 67 9 Agric/Fishery Workers 90. 72 56. 00 *Source GLSS (2005/06) Country Labour Markets and their TVET Systems (Session One) 9